Radon Levels
Radon levels: what your number means, from safe to high
Short answer
Radon levels in U.S. homes are measured in picocuries per liter (pCi/L): EPA estimates the average indoor level at about 1.3 pCi/L, recommends fixing a home at 4 pCi/L or more, and recommends considering a fix between 2 and 4 pCi/L. No level of radon is safe, so lower is always better, and the only way to know a home's level is to test it.
Next step: pick the right test for your home. Which test to use
Key takeaways
- U.S. radon results are in picocuries per liter (pCi/L). 4 pCi/L is about 150 Bq/m3, the unit used in most other countries.
- EPA estimates the average U.S. home at about 1.3 pCi/L and outdoor air at about 0.4 pCi/L.
- EPA recommends fixing at 4 pCi/L or more and considering a fix between 2 and 4 pCi/L. No level is safe.
- Levels change from hour to hour, day to day and season to season, and are usually highest in basements and rooms touching the ground.
- A system usually brings a home to 2 pCi/L or below. WHO recommends national reference levels of 100 Bq/m3 where possible.
The two numbers
What radon levels mean
Radon levels describe how much radon is in a building's air. In the United States a test reports the result in
- 4 pCi/L
- EPA's action level, about 150 Bq/m3: the point at which EPA recommends fixing a home.
- 2 to 4 pCi/L
- The range where EPA recommends considering a fix.
- No level is safe
- Any radon exposure carries some risk, so lower is always better.
Read moreA paragraph and a figure, 1 min
Two numbers frame every result. EPA recommends fixing a home when the radon level is 4 pCi/L or higher. EPA recommends considering a fix when the level is between 2 and 4 pCi/L. Neither is a line between safe and unsafe: any radon exposure carries some risk, and you can reduce your risk of lung cancer by lowering your radon level. The rest of this page puts your number in context. If you already have a result, the interpreter reads it for you.

Read this figure as textHide the text version
- Below 2 pCi/L (below 74 Bq/m³)Below both of EPA's guidance levels.
- 2 to 4 pCi/L (74 Bq/m³ to 148 Bq/m³)EPA recommends considering a fix when the level is between 2 and 4 pCi/L.
- At or above 4 pCi/L (148 Bq/m³ and up)EPA recommends fixing a home when the radon level is 4 pCi/L or higher.
Level chart
Radon level chart: from outdoor air to 20 pCi/L
EPA's risk chart is the closest thing to an official radon level chart. For each level it gives the Bq/m3 equivalent, an estimate of how many people out of 1,000 could get lung cancer if exposed to that level over a lifetime, for people who smoked and for people who never smoked, and what to do. These are population estimates from a 2003 risk assessment, not a prediction for any one person.
| Radon level | Bq/m3 | What it is | People who smoked | People who never smoked | What to do |
|---|---|---|---|---|---|
| 20 pCi/L | 740 | Five times the action level | About 260 | About 36 | Fix your home |
| 10 pCi/L | 370 | 2.5 times the action level | About 150 | About 18 | Fix your home |
| 8 pCi/L | 300 | Twice the action level | About 120 | About 15 | Fix your home |
| 4 pCi/L | 150 | EPA's action level | About 62 | About 7 | Fix your home |
| 2 pCi/L | 75 | Bottom of EPA's consider-fixing range | About 32 | About 4 | Consider fixing between 2 and 4 pCi/L |
| 1.3 pCi/L | 50 | Average U.S. indoor level | About 20 | About 2 | Average indoor radon level |
| 0.4 pCi/L | 15 | Average U.S. outdoor level | About 3 | No figure given | Average outdoor radon level |
Show all 7 rows
Read moreA paragraph, 1 min
Two notes go with the chart: a former smoker's risk may be lower than the smokers' column and higher than the never-smokers' column, and reducing radon levels below 2 pCi/L is difficult. Readings above 20 pCi/L are off the chart but not unheard of: levels in buildings range from 10 Bq/m3 to more than 10 000 Bq/m3.
Safe level
What is a safe radon level?
There is none. Any radon exposure carries some risk and no level of radon is safe, and because there is no known safe level of exposure, EPA also recommends considering a fix between 2 and 4 pCi/L. The 4 pCi/L
Read moreA note and a paragraph, 1 min
The practical goal is the lowest radon level you can reach, to reduce the risk of lung cancer. The longer answers are on what is a safe level of radon, what radon level is dangerous and the radon limits guide.
Averages
Normal and average radon levels
- 1.3 pCi/L
- Average indoor radon level in U.S. homes (50 Bq/m3), according to EPA
- 0.4 pCi/L
- Average U.S. outdoor radon level (15 Bq/m3), about one tenth of EPA's action level
- Nearly one in 15
- U.S. homes with an elevated level, 4 pCi/L or more, by EPA's estimate.
Read moreTwo paragraphs, 1 min
Those two averages are the reference points for "normal". EPA based its estimate of 21,000 radon-related lung cancers a year on the 1.3 pCi/L indoor average, and Congress set a long-term goal that indoor radon levels be no higher than outdoor levels, which is not yet technologically achievable for every home.
An average hides a wide spread. EPA estimates that nearly one in 15 U.S. homes has an elevated level, 4 pCi/L or more. Typical outdoor levels run 5 to 15 Bq/m3, and indoor levels can range from 10 Bq/m3 to more than 10 000 Bq/m3. More is on what are normal radon levels.
Zones
Radon levels by zone, state and county
The national Map of Radon Zones gives every county a predicted radon potential, not a measurement. The zones are defined by the average indoor level a home in the area may have:
| Zone | Potential | Predicted average indoor level |
|---|---|---|
| Zone 1 | Highest potential | May be greater than 4 pCi/L |
| Zone 2 | Moderate potential | May be between 2 and 4 pCi/L |
| Zone 3 | Low potential | May be less than 2 pCi/L |
Read moreA paragraph, 1 min
An
By floor
Radon levels in the basement and on upper floors
Where you measure matters. Radon levels are usually higher in basements, cellars and living spaces in contact with the ground, but considerable radon concentrations can also be found above the ground floor. That is why a test goes in the lowest lived-in level: the basement if it is used often, otherwise the first floor.
Which floor a radon level describes
Basement or any room touching the ground
Usually the highest levelsFirst floor
The test location when the basement is not used oftenUpper floors
Considerable concentrations can still occur above the ground floorA lower floor you start using
Retest on that levelTesting for a home sale
The lowest level that could be used regularly, finished or not
Show all 5 cards
Read moreA paragraph, 1 min
A basement result is therefore not the level upstairs, and an upstairs result does not clear the basement. Placement rules are on radon testing and where should a radon test be placed.
Why it changes
Why radon levels go up and down
Radon concentrations vary considerably between neighboring buildings, and within a building from day to day and from hour to hour, which is why the yearly average is best estimated from measurements of at least 3 months. Because levels vary from day to day and season to season, a long-term test is more likely than a short-term one to show your year-round average.
What sets the radon level in a building
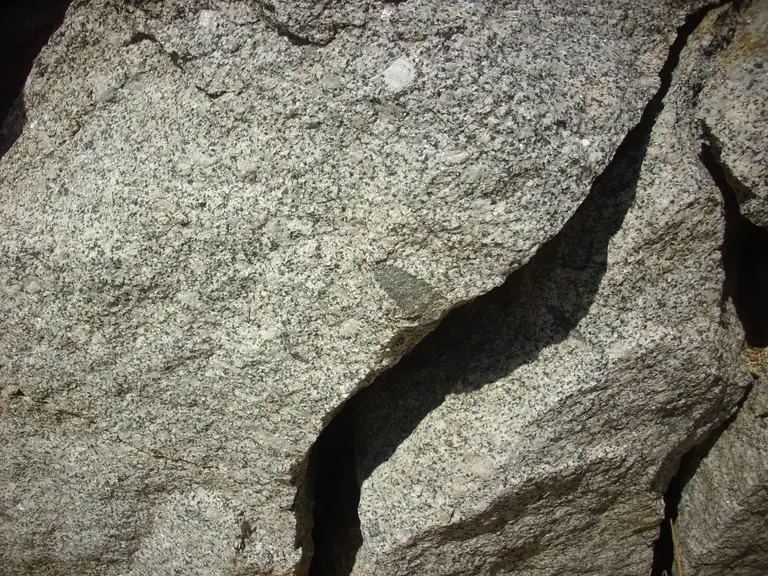
Local geology
The uranium content and permeability of the rocks and soils underneathEntry routes
The routes radon can take from the soil into the building: cracks in floors, floor-wall junctions, gaps around pipes or cables, pores in hollow-block walls, cavity walls, sumps and drainsBuilding materials
Radon exhaled from the materials the building is made ofAir exchange
How fast indoor and outdoor air exchange, which depends on construction, the occupants' ventilation habits and how airtight the building is
Show all 4 cards
Read moreA paragraph and a photo, 1 min
Changes to the house matter too: major renovations can change the radon level in any home. Why levels jump within a test is on what causes radon spikes, when they peak on when are radon levels highest, and whether they drift over years on can radon levels change.
After a fix
Radon levels after mitigation
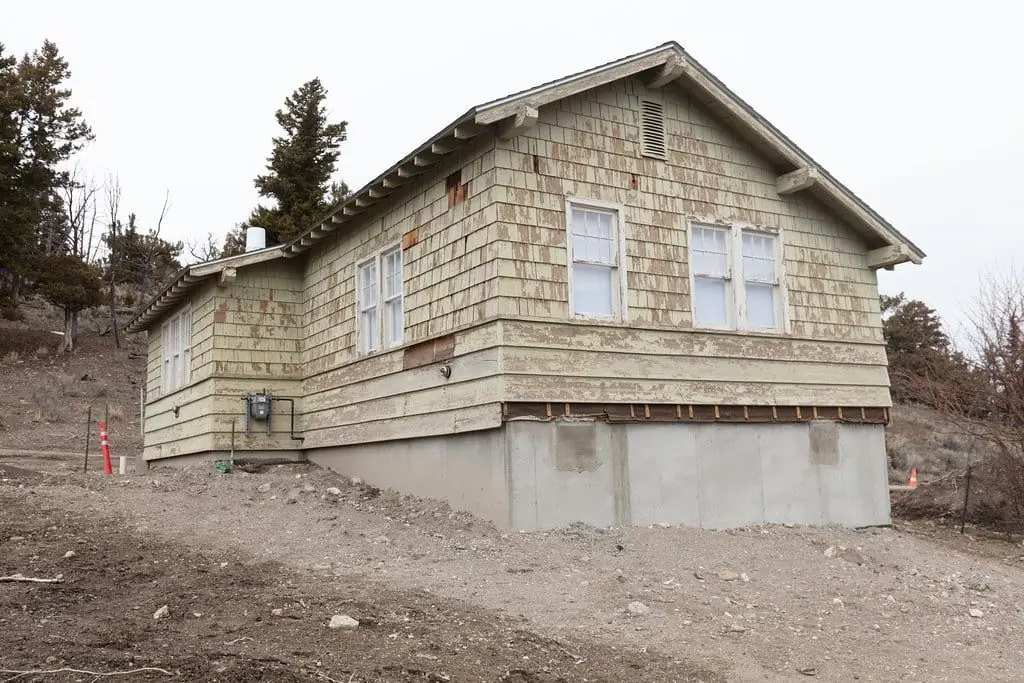
A working system usually brings a home well under the action level. Radon levels in most homes can be reduced to 2 pCi/L or below with today's technology. Every system should get the level below the 4 pCi/L action level, and a quality system may bring year-round levels below 2 pCi/L. Many contractors guarantee to reach a negotiated level, such as 2 pCi/L or less.
What a post-mitigation result means
4.0 pCi/L or greater
Fix the building; with a system already in, more work may be needed to lower radon furtherBetween 2.0 and 4.0 pCi/L
Consider fixing; with a system in, more work may be needed2.0 pCi/L or below
The radon levels are considered low
Read moreA paragraph, 1 min
Test no sooner than 24 hours and within 30 days after the system starts, then at least every two years. How systems get there is on radon mitigation.
By country
Acceptable radon levels by country: EPA and WHO
Other countries set their own figure, usually called a reference level. WHO recommends that national reference levels be set at 100 Bq/m3 (2.7 pCi/L) if possible, and not above 300 Bq/m3 (8.1 pCi/L). That does not directly change the U.S. 4 pCi/L (150 Bq/m3) action level, because EPA has long also recommended considering a fix from 2 pCi/L and holds that there is no known safe level.

Read this figure as textHide the text version
- U.S. EPA
- World Health Organization
- EPA: average indoor air48.1 Bq/m³ (1.3 pCi/L)The average for indoor air is 48.1 Bq/m3 (1.3 pCi/L).
- EPA: consider fixing2 pCi/L (74 Bq/m³, calculated)Consider fixing between 2 and 4 pCi/L.
- WHO: reference level100 Bq/m³ (2.7 pCi/L, calculated)A national annual average residential radon concentration reference level of 100 Bq/m3.
- EPA: fix your home148 Bq/m³ (4 pCi/L)EPA recommends fixing your home when the radon level is at or above 148 Bq/m3 (4 pCi/L).
- WHO: upper limit for a reference level300 Bq/m³ (8.1 pCi/L, calculated)If 100 Bq/m3 cannot be reached under the prevailing country-specific conditions, the reference level should not exceed 300 Bq/m3.
Calculated by Radon411: figures marked calculated convert the publisher's unit at 37 Bq/m³ per pCi/L, EPA's factor: “1 pCi/L corresponds to 37 Bq/m3”. A becquerel is one atomic nucleus transforming each second. WHO sets reference levels for countries; EPA's level is a recommendation to fix a home.
Show the whole figure
Read moreA paragraph, 1 min
Countries worldwide have adopted action levels, most of them similar to the U.S. 4 pCi/L, and the action level to follow is the one set by the country, state or local authority where the test is done. The radon limits guide compares them in detail.
Units
Radon units: pCi/L and Bq/m3
U.S. results are reported in pCi/L, with the Bq/m3 equivalent printed beside the key figures. The pairs below are the published ones. The general rule, about 37 Bq/m3 to 1 pCi/L, is our calculation from the published figure of 148 Bq/m3 for 4 pCi/L, which is also rounded to 150 Bq/m3.
| pCi/L | Bq/m3 (as EPA prints it) |
|---|---|
| 0.4 (outdoor average) | 15 |
| 1.3 (indoor average) | 50 |
| 2 (consider fixing) | 75 |
| 2.7 (WHO's recommended reference level) | 100 |
| 4 (action level) | 150, or 148 |
| 8 | 300 |
| 8.1 (WHO's upper limit) | 300 |
| 10 | 370 |
| 20 | 740 |
Show all 9 rows
Read moreA figure, 1 min
Calculated by Radon411
About 37 Bq/m3
Equal to 1 pCi/L: 148 Bq/m3 divided by 4 pCi/L, from the published figure for the action level
Health risk
Your radon level and lung cancer risk
Health risk
Your radon level and lung cancer risk
The higher the level and the longer the exposure, the higher the risk. WHO estimates that lung cancer risk rises by about 16% per 100 Bq/m3 increase in long-term average radon concentration, and the relation is assumed to be linear. Your chances of lung cancer from radon depend mostly on how much radon is in your home, how much time you spend there, and whether you smoke or have ever smoked.

Read this figure as textHide the text version
EPA estimate, lifetime exposure
- Out of 1,000 people who smoked
- Out of 1,000 people who never smoked
| Radon level | Could get lung cancer, per 1,000 | EPA's comparison | What to do |
|---|---|---|---|
| 20 pCi/L740 Bq/m³ | Smoked: About 260Never smoked: About 36 | Smoked: 250 times the risk of drowningNever smoked: 35 times the risk of drowning | Fix your home |
| 10 pCi/L370 Bq/m³ | Smoked: About 150Never smoked: About 18 | Smoked: 200 times the risk of dying in a home fireNever smoked: 20 times the risk of dying in a home fire | Fix your home |
| 8 pCi/L300 Bq/m³ | Smoked: About 120Never smoked: About 15 | Smoked: 30 times the risk of dying in a fallNever smoked: 4 times the risk of dying in a fall | Fix your home |
| 4 pCi/L150 Bq/m³ | Smoked: About 62Never smoked: About 7 | Smoked: 5 times the risk of dying in a car crashNever smoked: The risk of dying in a car crash | Fix your home |
| 2 pCi/L75 Bq/m³ | Smoked: About 32Never smoked: About 4 | Smoked: 6 times the risk of dying from poisonNever smoked: The risk of dying from poison | Consider fixing between 2 and 4 pCi/L |
| 1.3 pCi/L50 Bq/m³ | Smoked: About 20Never smoked: About 2 | Average indoor radon level | |
| 0.4 pCi/L15 Bq/m³ | Smoked: About 3Never smoked: No figure given | Average outdoor radon level |
- Smoked: If you are a former smoker, your risk may be lower.
- Never smoked: If you are a former smoker, your risk may be higher.
- Reducing radon levels below 2 pCi/L (75 Bq/m3) is difficult.
- Lifetime risk of lung cancer deaths, as EPA estimates it.
- The risk comparisons are EPA's.
Show the whole figure
Read moreA paragraph, 1 min
Smoking multiplies the effect: smokers are estimated to be 25 times more at risk from radon than non-smokers. How radon causes cancer is in the radon and lung cancer guide.
What to do
What to do at each radon level
Next steps by result
Below 2 pCi/L
You may want to test again sometime in the future, and after changes such as using a lower floor or renovating2 to 4 pCi/L
Consider fixing; levels in many homes can be reduced to 2 pCi/L or less4 pCi/L or more, first short-term test
Take a follow-up test: long-term, or a second short-term testMore than 8 pCi/L, first short-term test
Take a second short-term test immediately4 pCi/L or more, long-term test or the average of two short-term tests
Fix the home
Show all 5 cards
Read moreA paragraph, 1 min
Results near 4 are the hardest to call: two
Readings
Common radon readings, one by one
Each common reading has its own page, listed by band at the end of this section: whether it is high, what to do, the rows of the risk chart around it, how sure one test can be, what a system would typically leave, and when to retest. Readings just over 4 are answered in is a radon level of 4.1 considered high.
Below 2 pCi/L
A paragraph, 1 min
Readings such as 0.8, 1.1 or 1.9 are below the consider-fixing range. No level is safe, and you may want to test again sometime in the future, but reducing radon below 2 pCi/L is difficult, so the practical step is to retest after changes to the house or the way you use its lowest floor.
From 2 to 4 pCi/L
A paragraph, 1 min
Readings such as 2.6, 3.1, 3.5 or 3.6 are in the 2 to 4 pCi/L range, where EPA recommends considering a fix. Most of them are above WHO's recommended reference level of 2.7 pCi/L. A long-term test is the best way to see where the year-round average really sits before deciding.
From 4 to 8 pCi/L
A paragraph, 1 min
Readings such as 4.5, 4.8, 5.3, 6.1 or 7.2 are at or above the action level. The guidance is the same across the range: confirm a short-term result with a follow-up test, then fix the home if one long-term test or the average of two short-term tests is 4 pCi/L or more. Results just over 4 are the least certain.
Above 8 pCi/L
A paragraph, 1 min
Readings such as 9, 12, 14, 21 or the 20s and 30s are more than twice the action level, where a first short-term result calls for a second short-term test immediately rather than a long-term one. Even very high levels can be reduced to acceptable levels. Multiples of the action level in the table are our calculation from the 4 pCi/L figure; the high radon levels guide covers results well above 4 together.
4 to 8 pCi/L4
Questions
Radon level questions
What is a safe radon level?
No level of radon is safe. EPA recommends fixing at 4 pCi/L or more and considering a fix between 2 and 4 pCi/L, and lower is always better.
What is a normal radon level in a home?
EPA estimates the average U.S. indoor level at about 1.3 pCi/L and the outdoor average at about 0.4 pCi/L.
What radon level requires mitigation?
EPA recommends fixing a home when one long-term test, or the average of two short-term tests, is 4 pCi/L or more, and considering it between 2 and 4 pCi/L.
What should radon levels be after mitigation?
Below 4 pCi/L at the very least, and usually 2 pCi/L or below: most homes can be reduced to that with today's technology.
Are radon levels higher in the basement?
Usually. Levels are usually highest in basements and rooms in contact with the ground, though considerable concentrations can occur on upper floors too.
Are radon levels higher in winter?
Levels vary by season. Testing in winter, when the heating runs day and night, is more likely to give an accurate result.
Is 3 pCi/L of radon bad?
It is in the 2 to 4 pCi/L range, where EPA recommends considering a fix. It is more than twice the national indoor average of about 1.3 pCi/L.
Is a radon level under 4 pCi/L safe?
No level is called safe. Radon below 4 pCi/L still poses some risk and can often be reduced.
What is the WHO radon level?
WHO recommends national reference levels of 100 Bq/m3 (2.7 pCi/L) where possible, and no higher than 300 Bq/m3 (8.1 pCi/L).
How do I convert Bq/m3 to pCi/L?
Divide by about 37. EPA prints 4 pCi/L as 150 Bq/m3, 2 pCi/L as 75 Bq/m3 and 1.3 pCi/L as 50 Bq/m3.
Why are my two radon tests different?
Radon changes hour to hour and day to day, so two tests at different times rarely match. EPA uses their average, or a long-term test, to decide.
Does my county's radon zone tell me my level?
No. A zone is a prediction for an area, and homes with elevated levels have been found in all three zones; only a test measures your home.