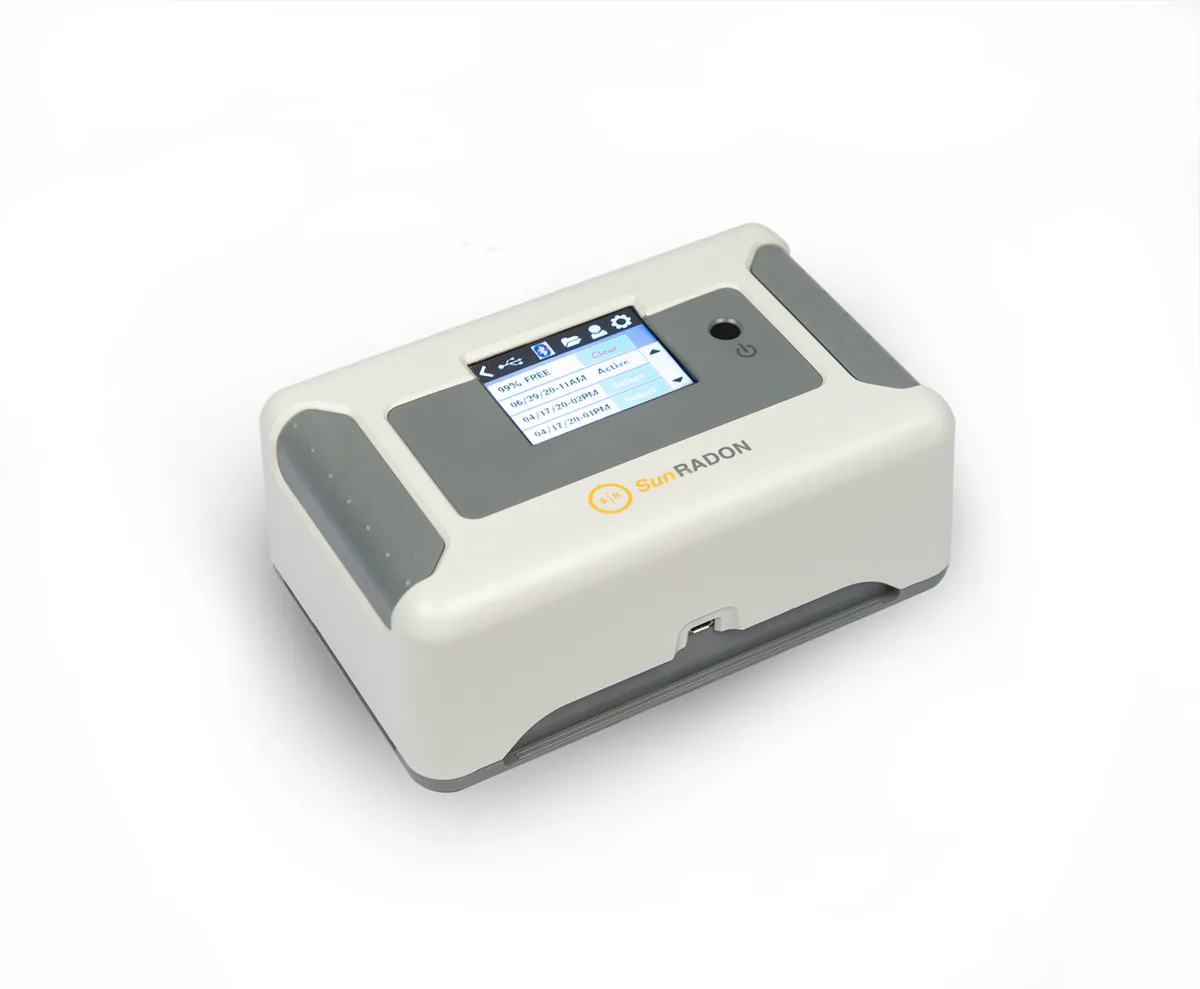
Short-term kit
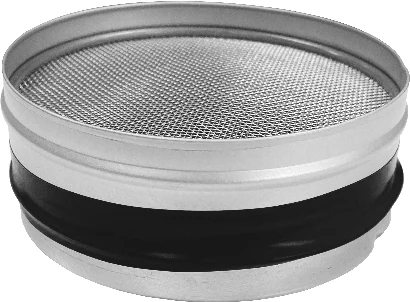
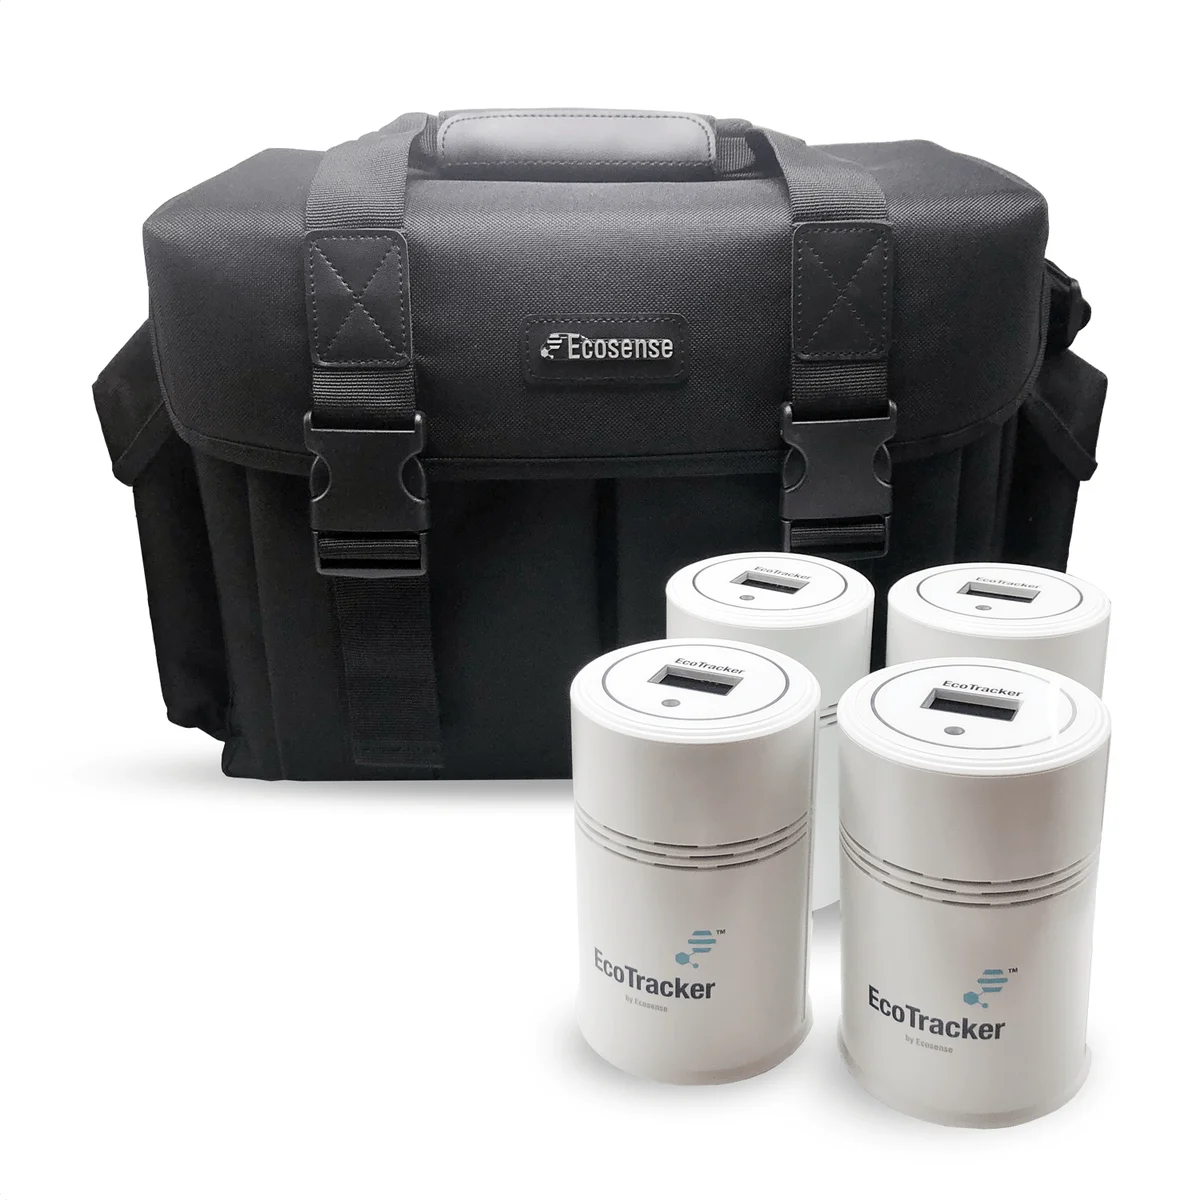
PicoCan short-term charcoal canister radon test
- Lab fee included
Method: Charcoal
In home: 48 to 96 hours
Independent U.S. radon data
Radon411 is an independent U.S. radon data site: the EPA radon zone and reported radon tests for every county, plain guides to radon testing and radon mitigation, and certified radon professionals with their published certifications. The Radon Action Brief, a dated PDF report for one county, is
See the radon levels for your county or ZIP code
Where most readers start: 1 of 3
Radon products
Each one has its own page with the figures its maker publishes, marked where we could read none, and for a kit or a monitor, how it measures and its independent test status.
Short-term kit
Method: Charcoal
In home: 48 to 96 hours
Short-term kit
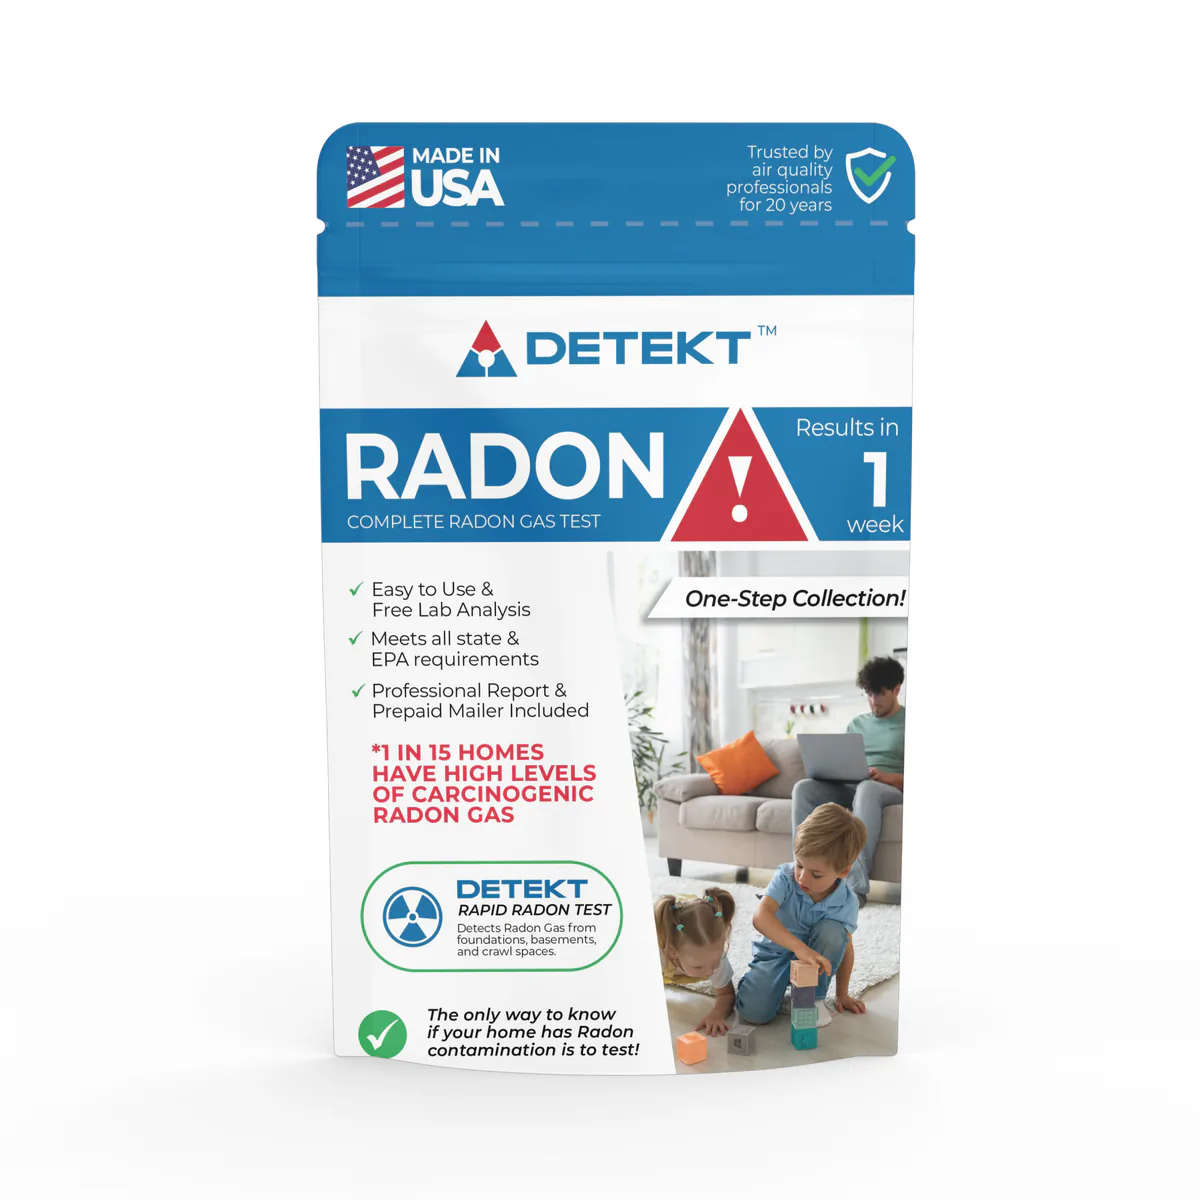
Method: Charcoal
In home: 2 to 7 days

Short-term kitempowerDX
Method: Passive sampler
In home: 48 to 96 hours
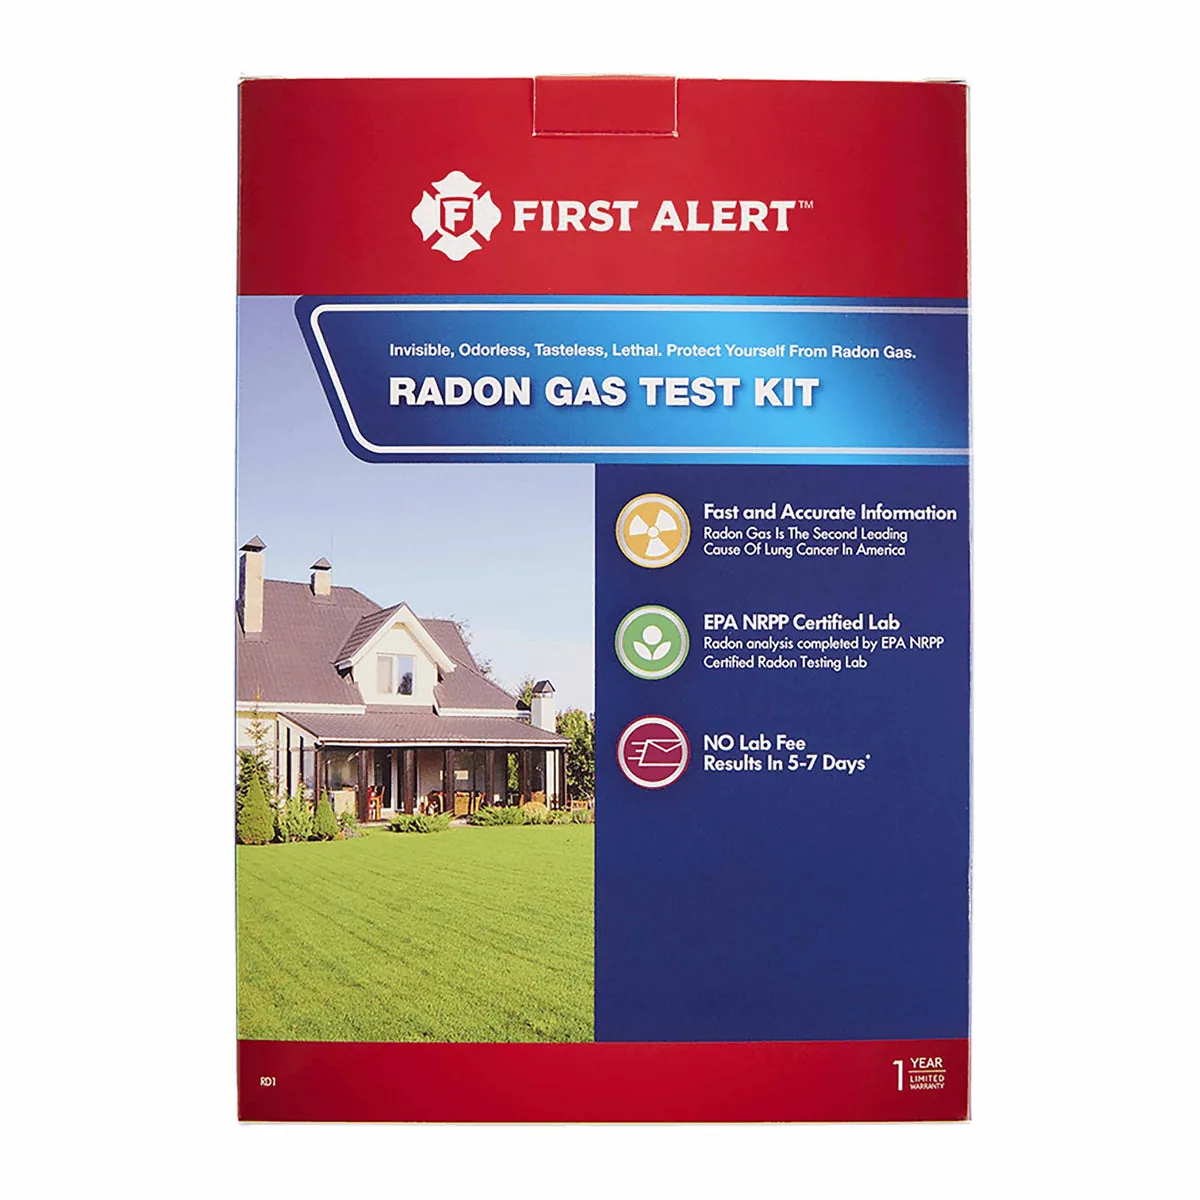
Short-term kitFirst Alert
Method: Charcoal
In home: 2 to 4 days
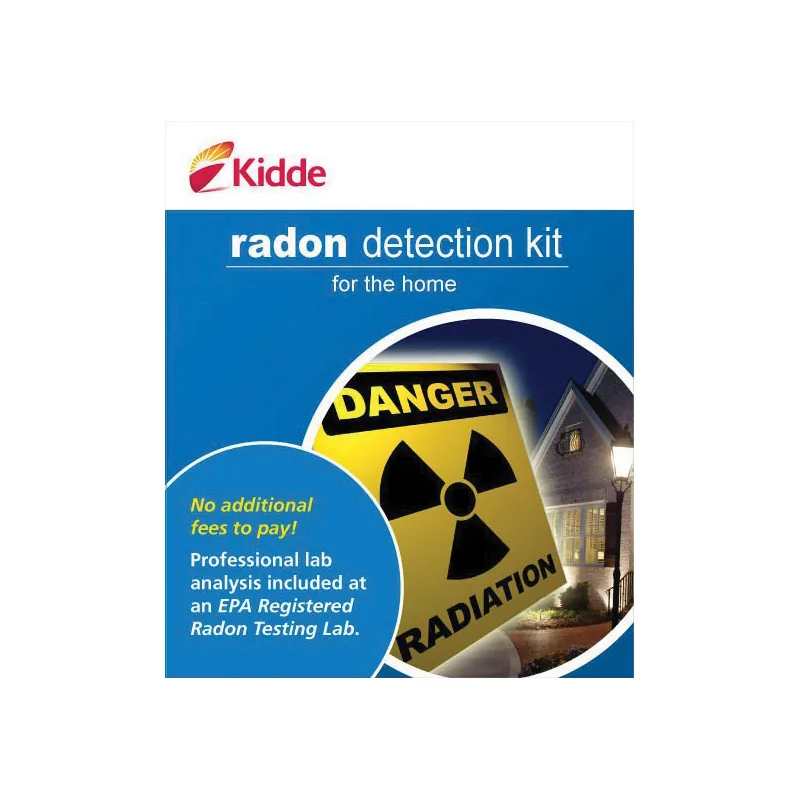
Short-term kitKidde
Method: Charcoal
In home: 3 days

Short-term kit
Method: Liquid scintillation
In home: 48 to 96 hours

Short-term kit
Method: Liquid scintillation
In home: 48 to 96 hours
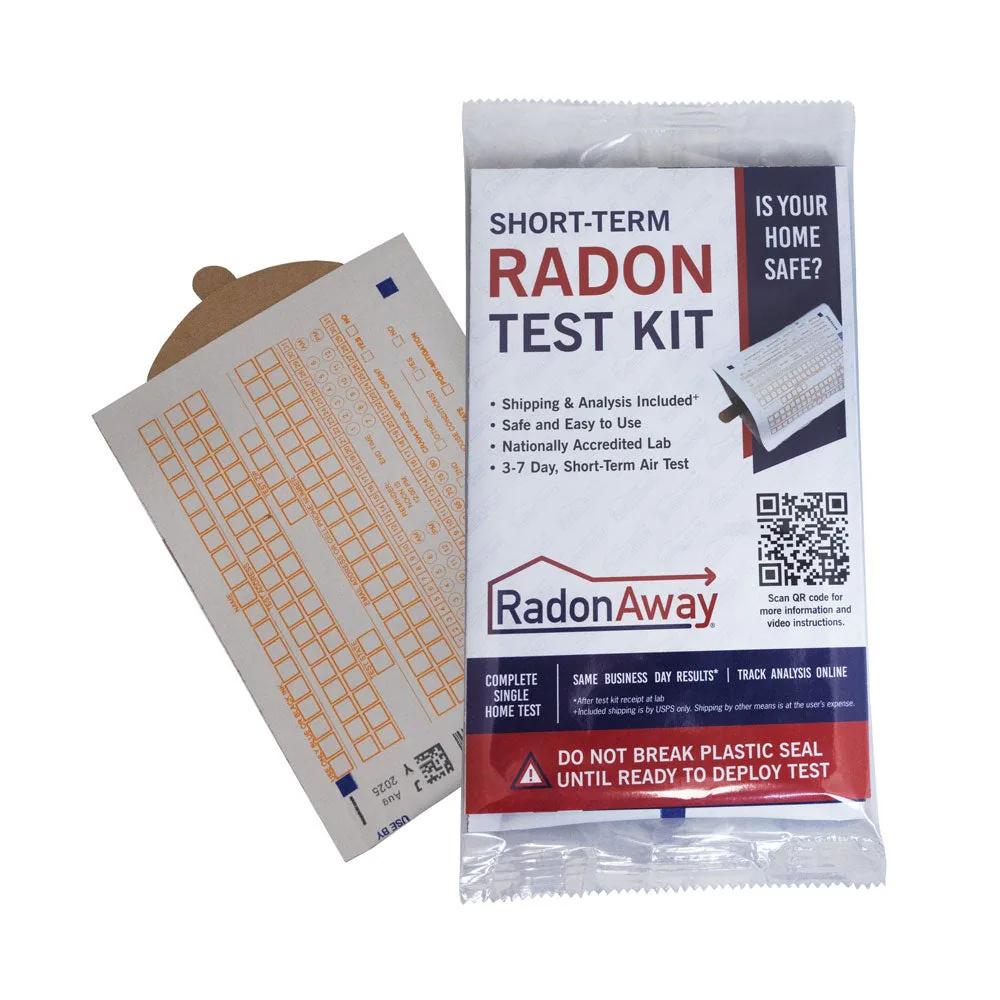
Short-term kit
In home: 72 to 168 hours

Long-term kit
Method: Alpha track
In home: 90 days to 12 months

Long-term kit
Method: Alpha track
In home: 90 days to 12 months
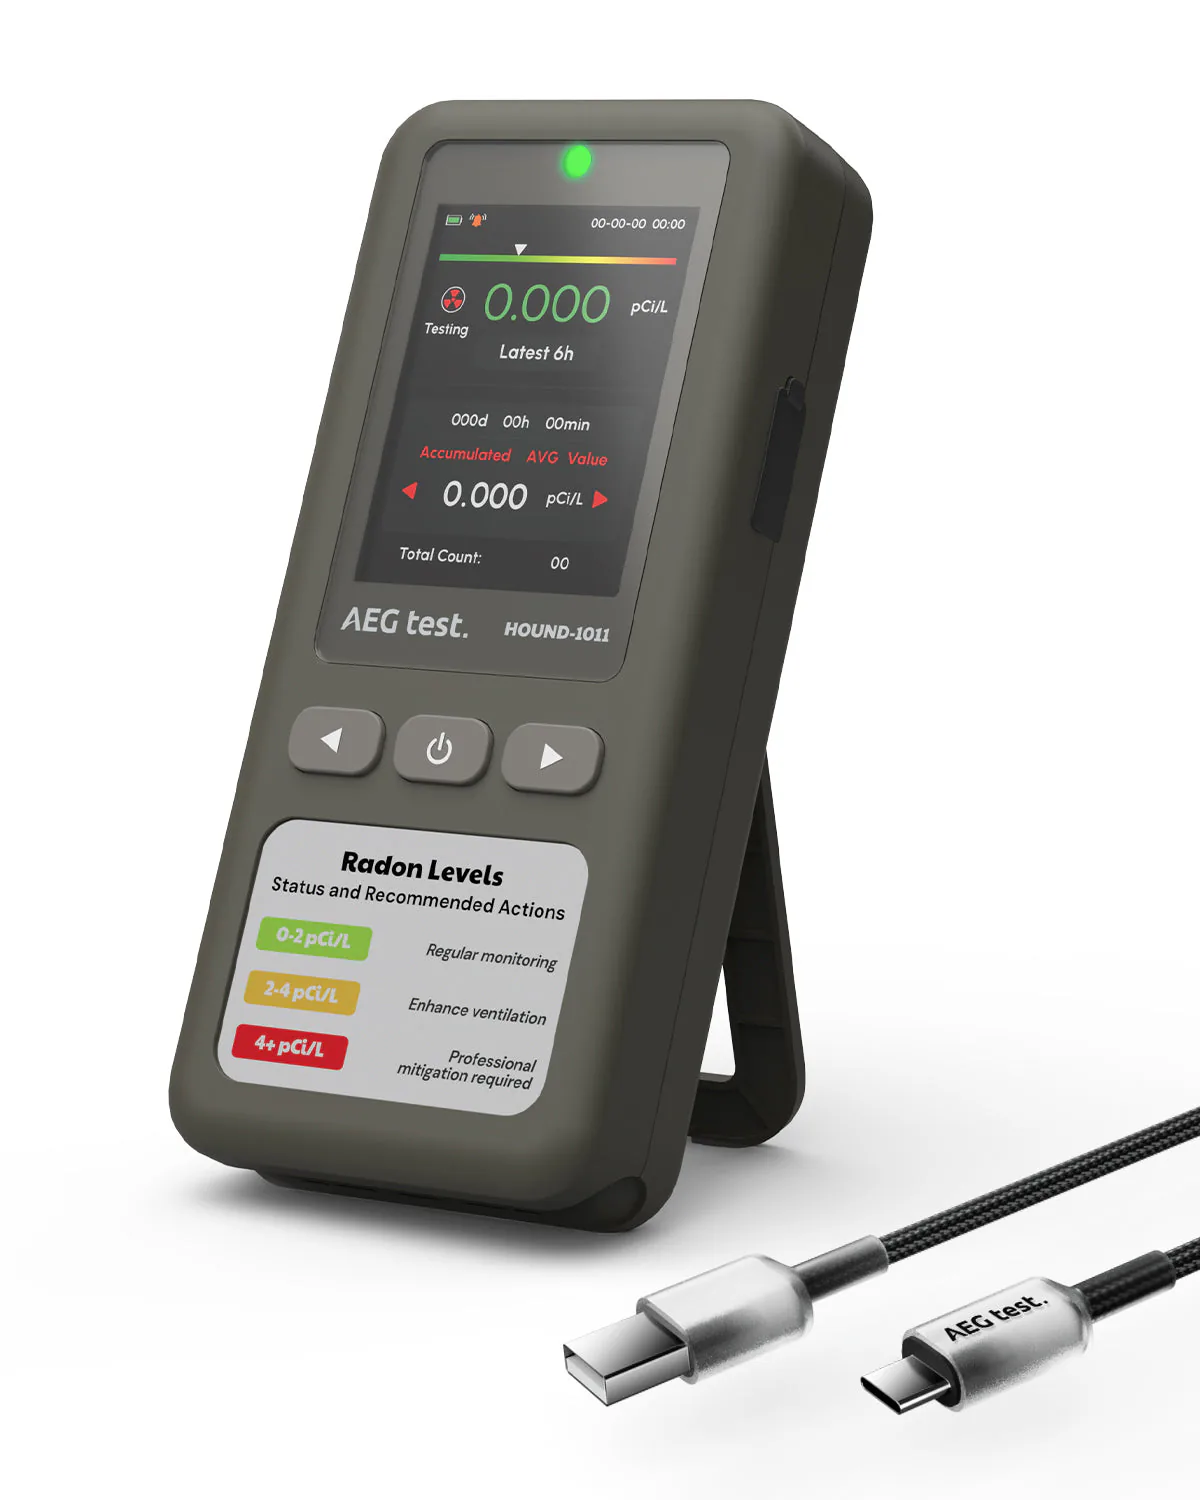
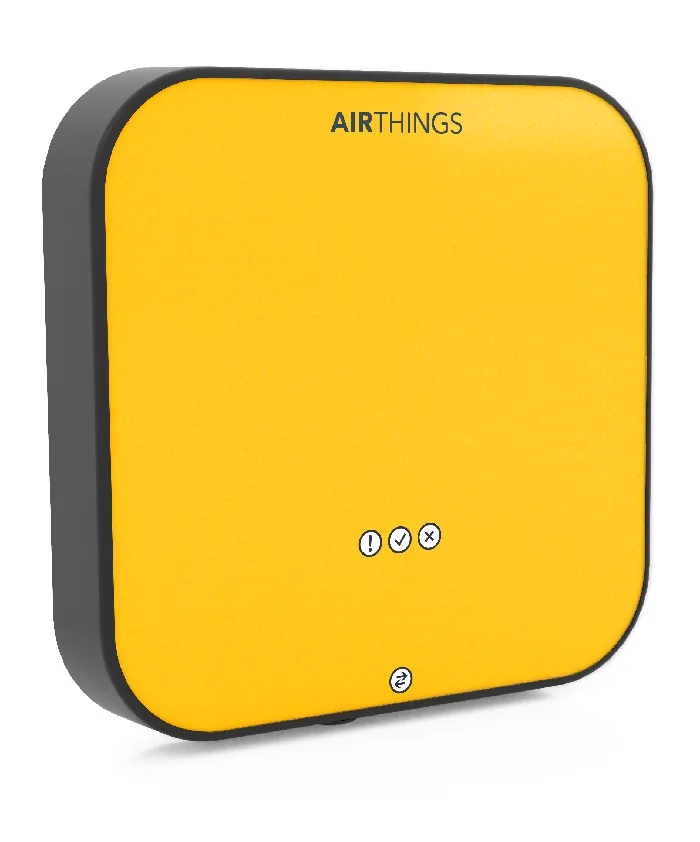
MonitorAEGTEST
Method: Semiconductor sensor
First reading: Within 6 hours
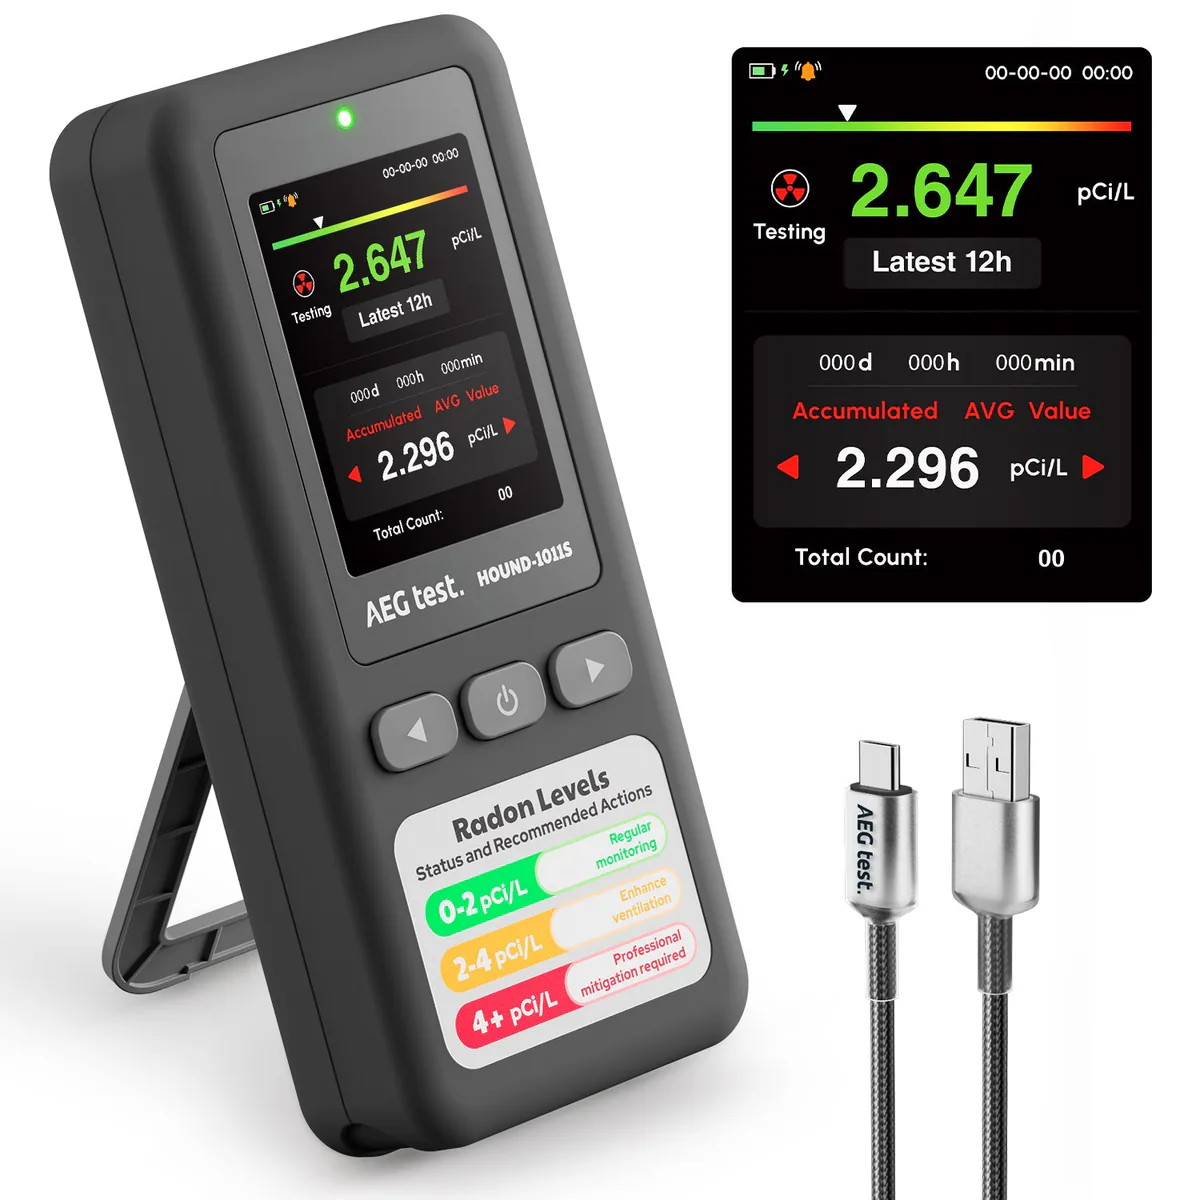
MonitorAEGTEST
Method: Semiconductor sensor
First reading: Within 12 hours
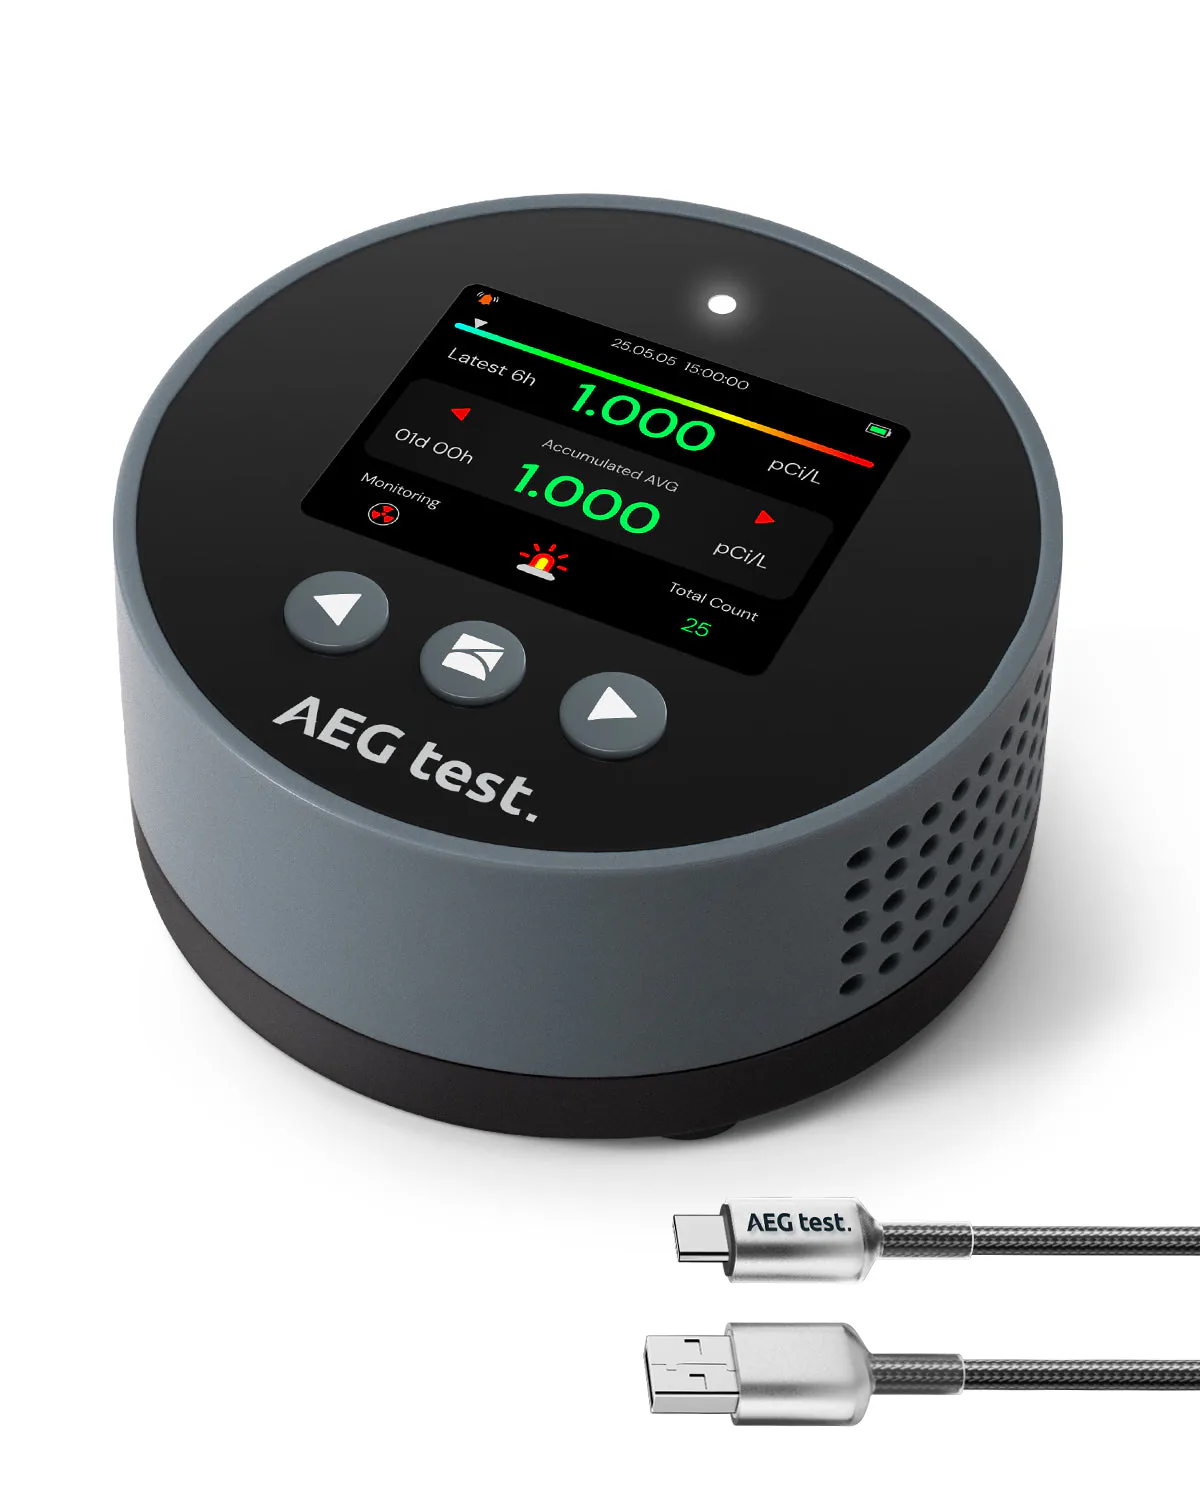
MonitorAEGTEST
Method: Semiconductor sensor
First reading: Within 6 hours
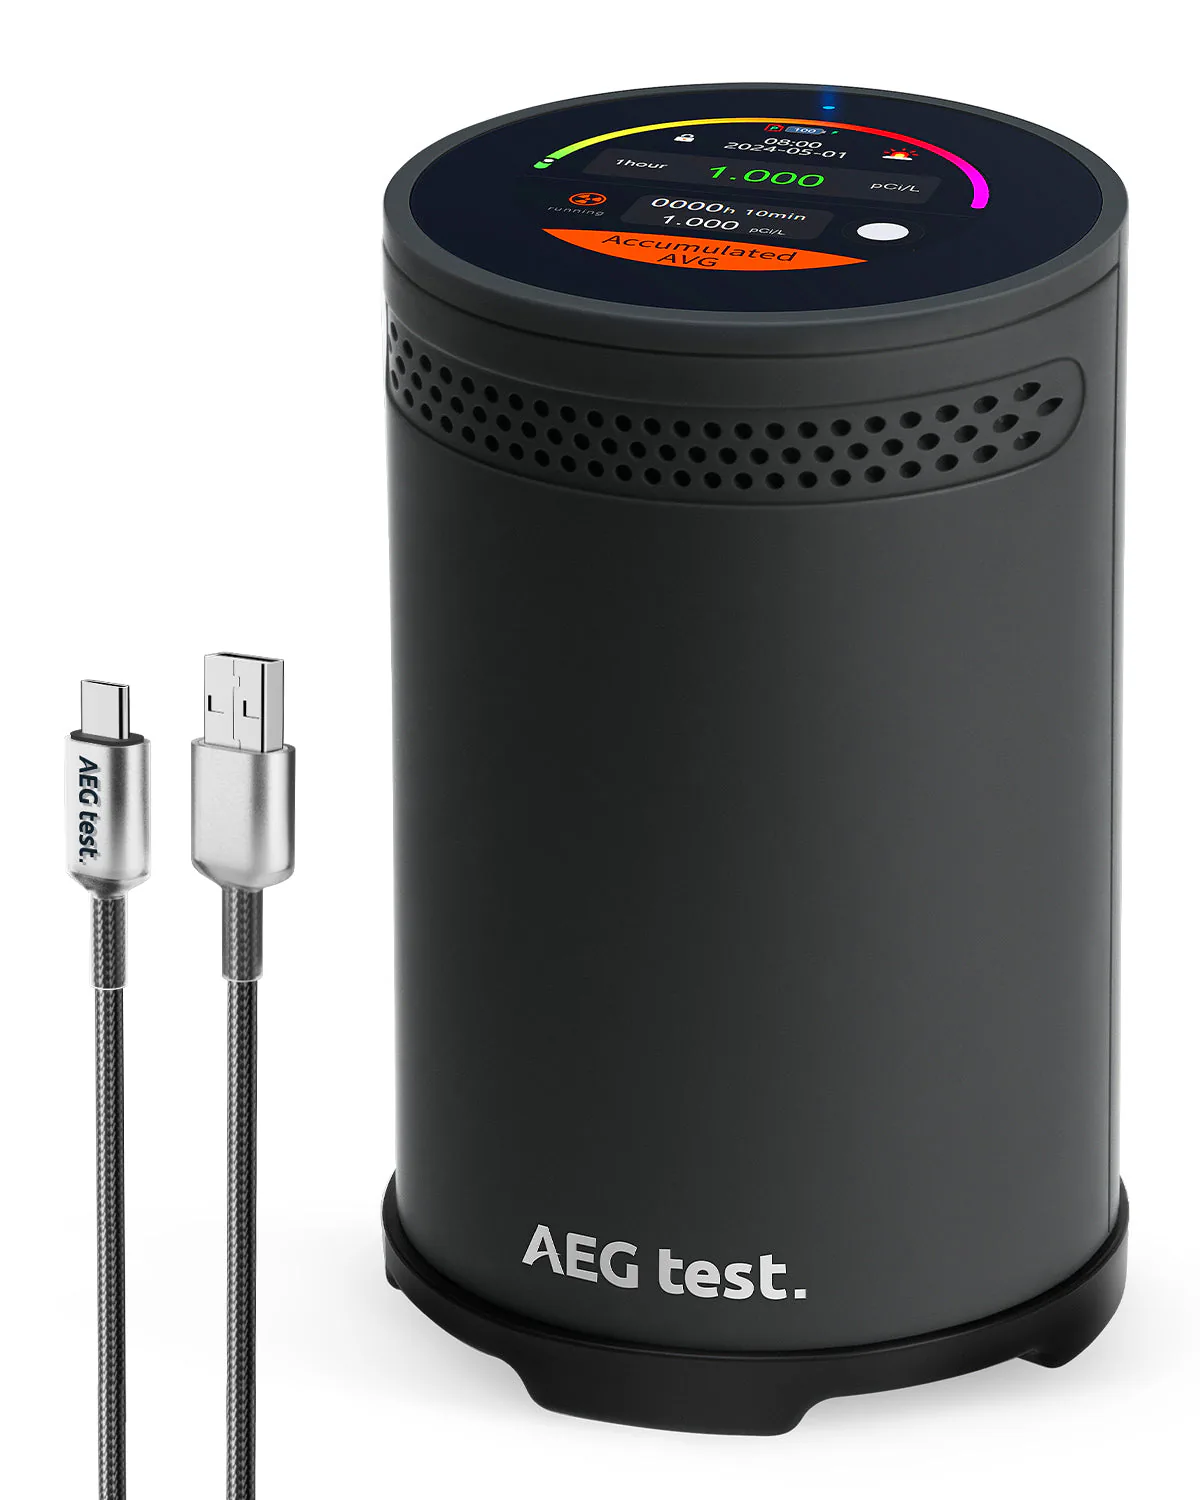
MonitorAEGTEST
First reading: Within 1 hour
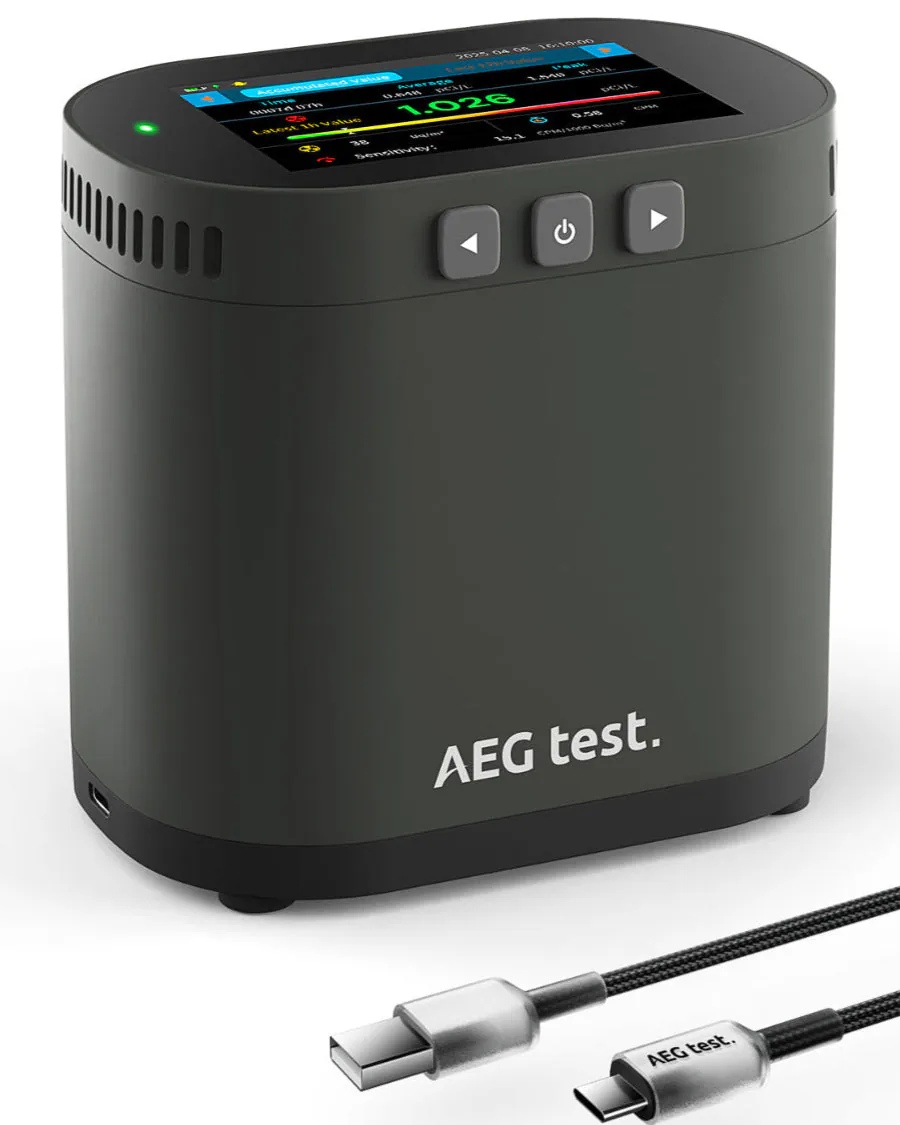
MonitorAEGTEST
Method: Ion chamber
First reading: Within 10 minutes
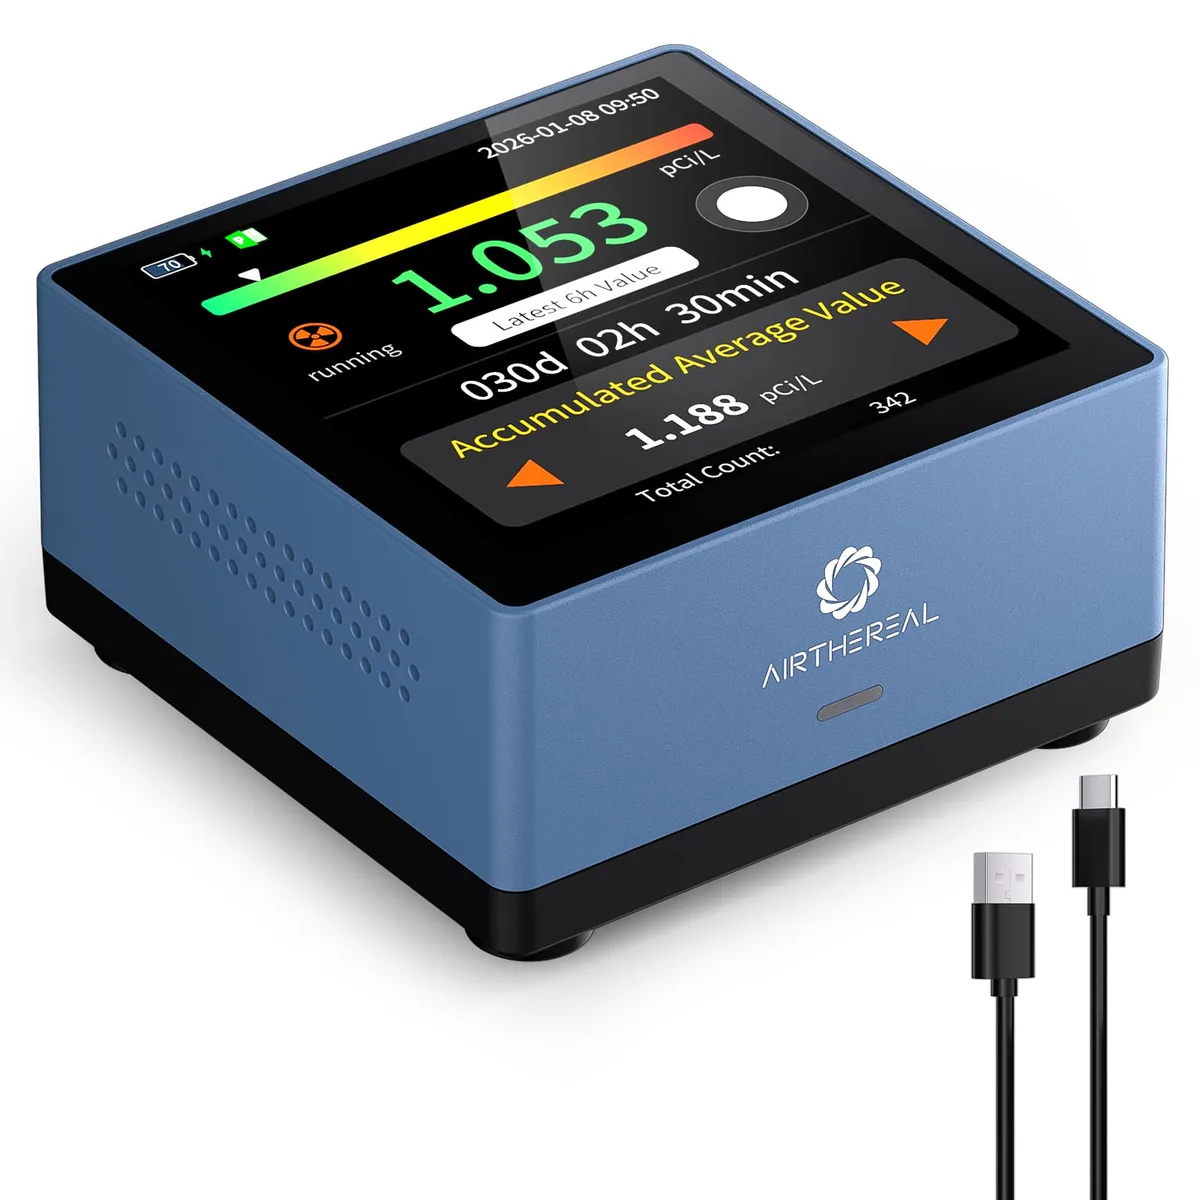
Monitor
Method: Semiconductor sensor
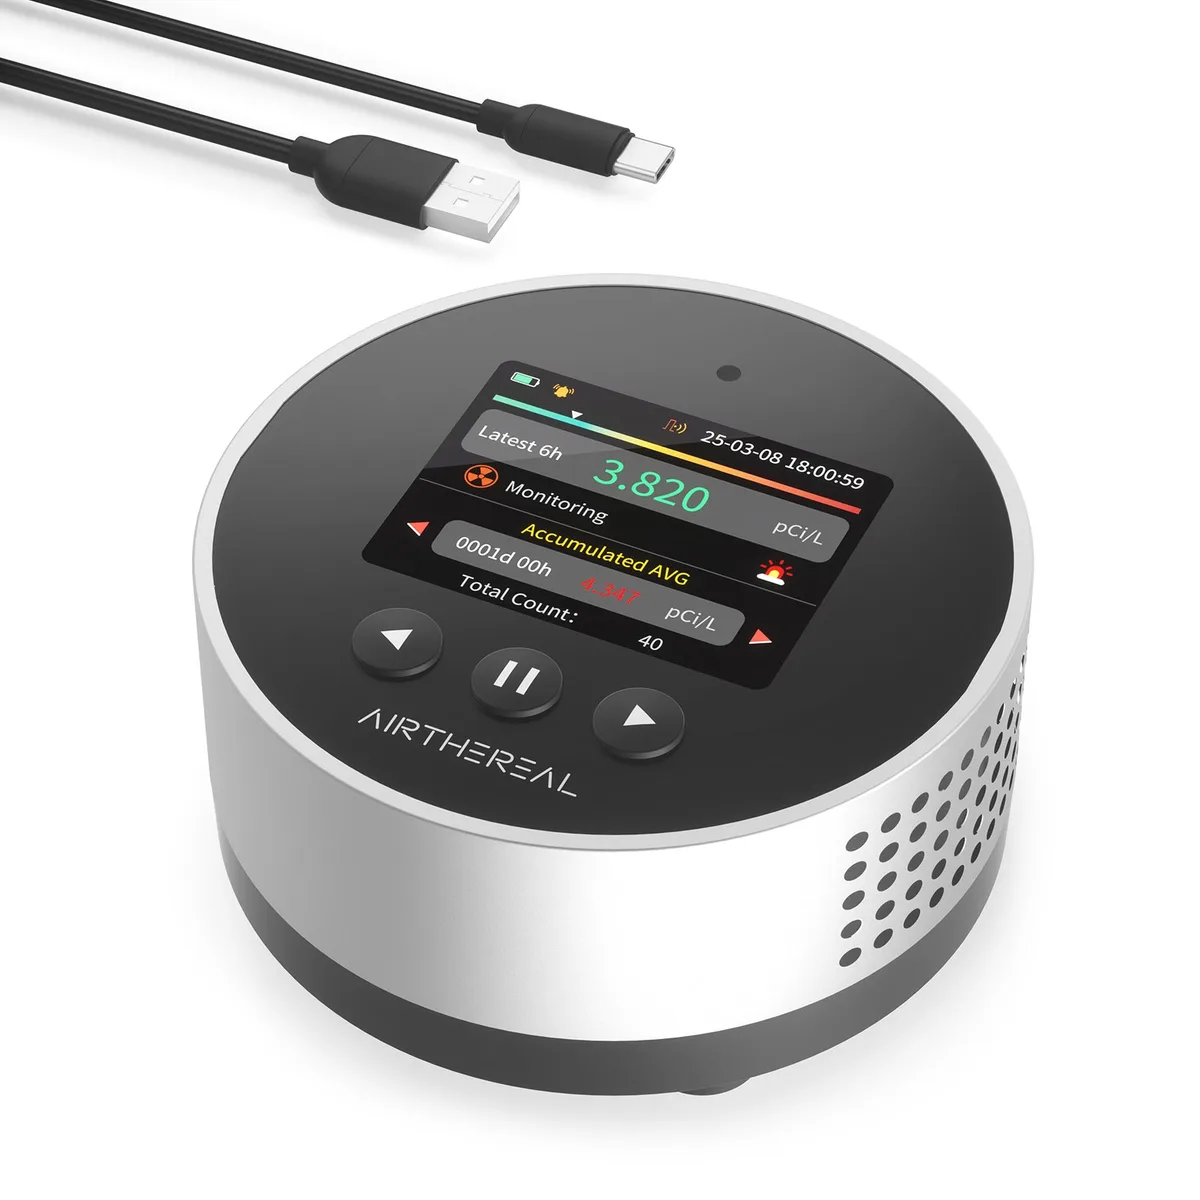
Monitor
Method: Semiconductor sensor
First reading: Within 6 hours
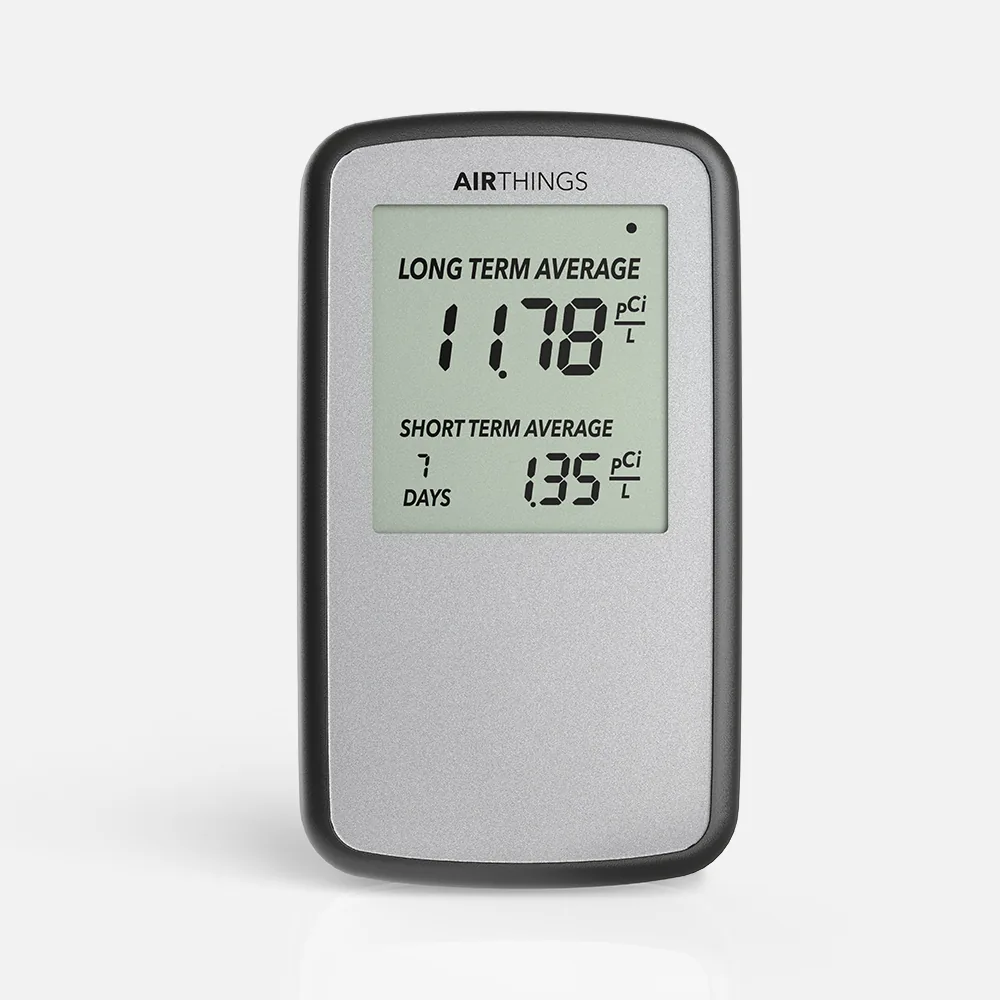
Monitor
Method: Alpha spectrometry
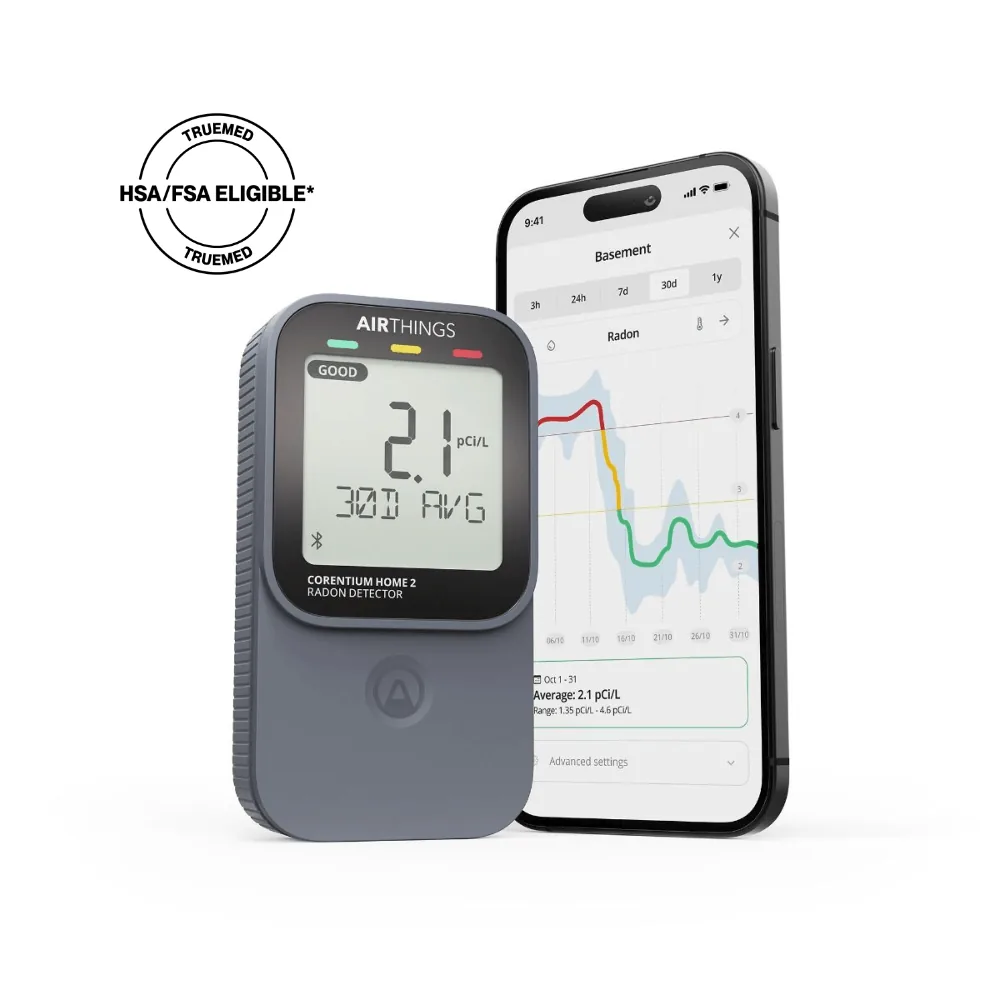
Monitor
Method: Alpha spectrometry
Readings: Every 60 minutes
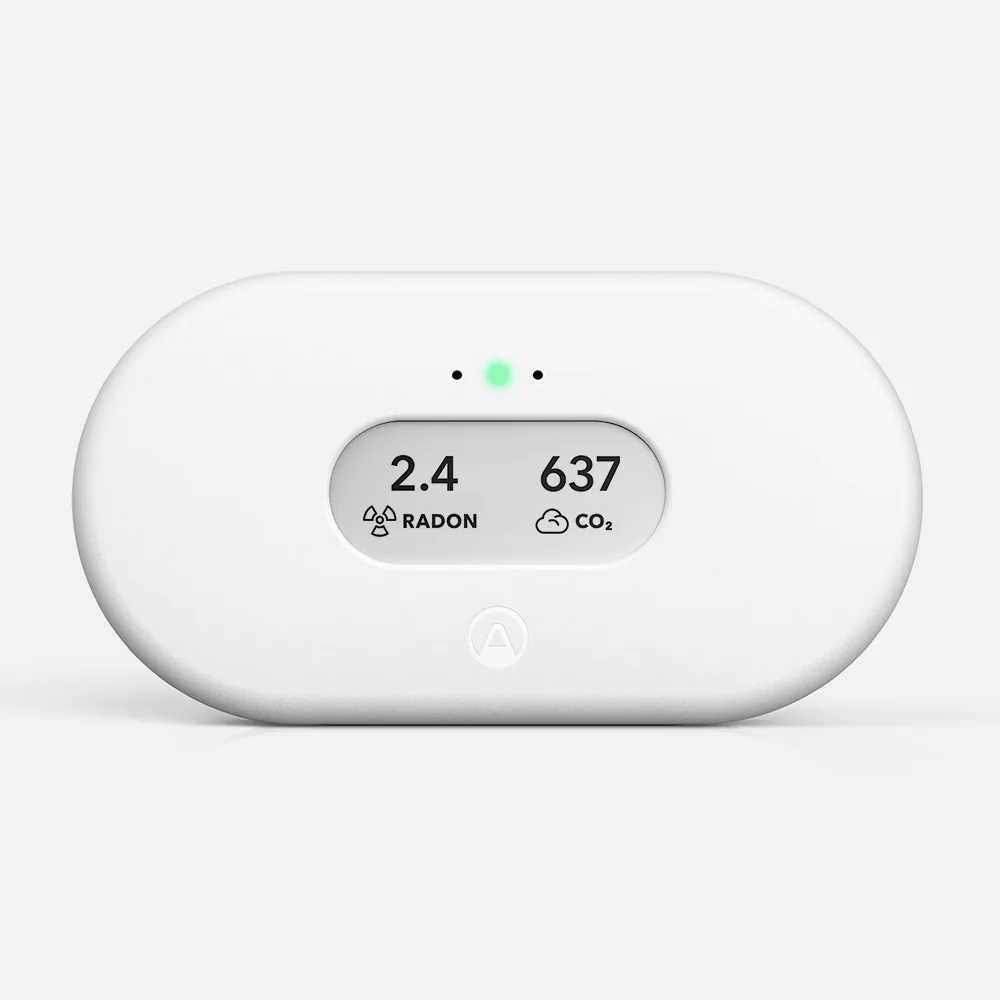
Monitor
Method: Alpha spectrometry
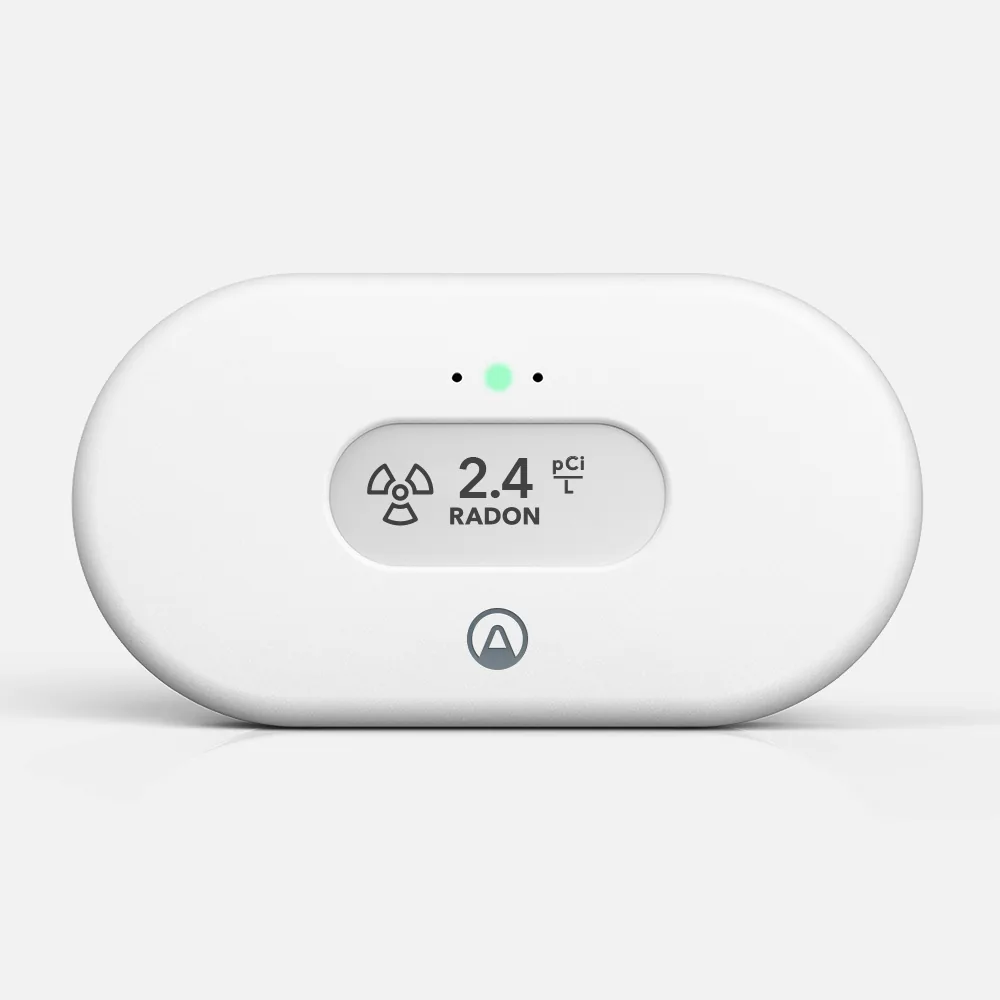
Monitor
Method: Alpha spectrometry
Readings: Every 60 minutes
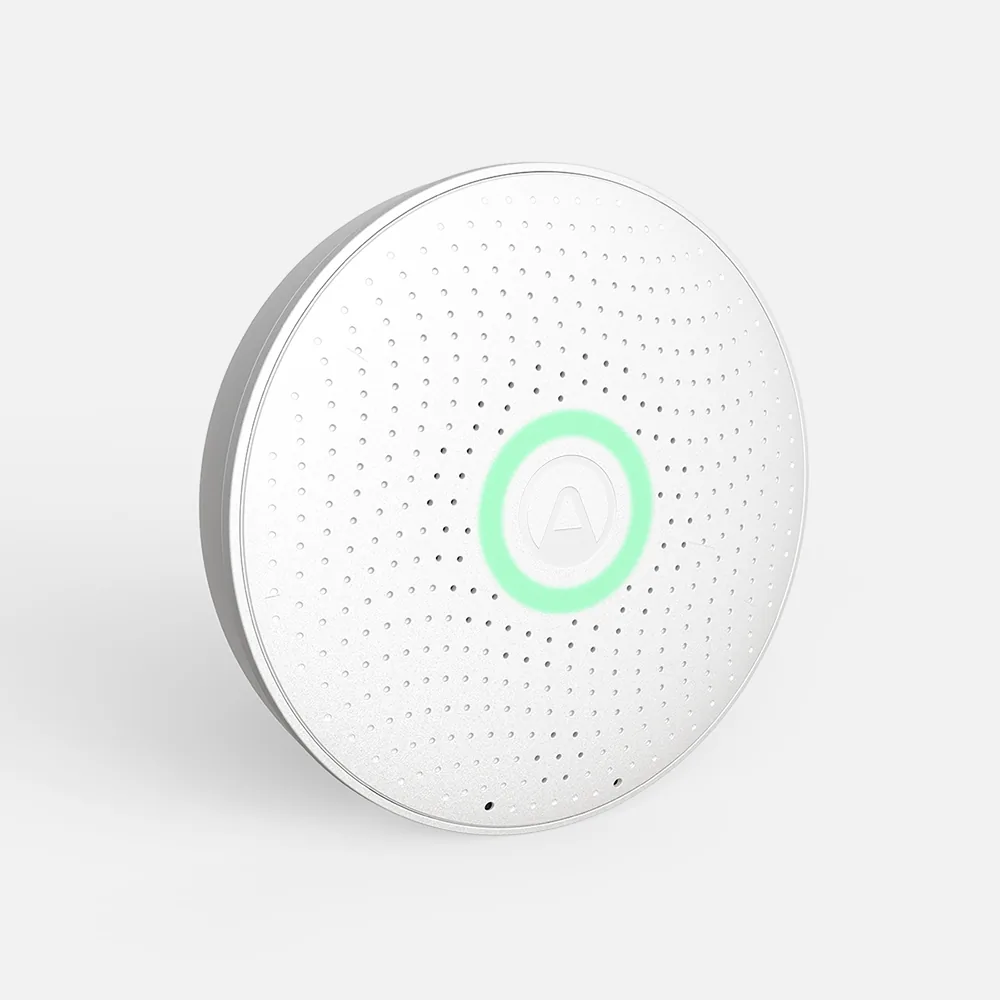
Monitor
Method: Alpha spectrometry
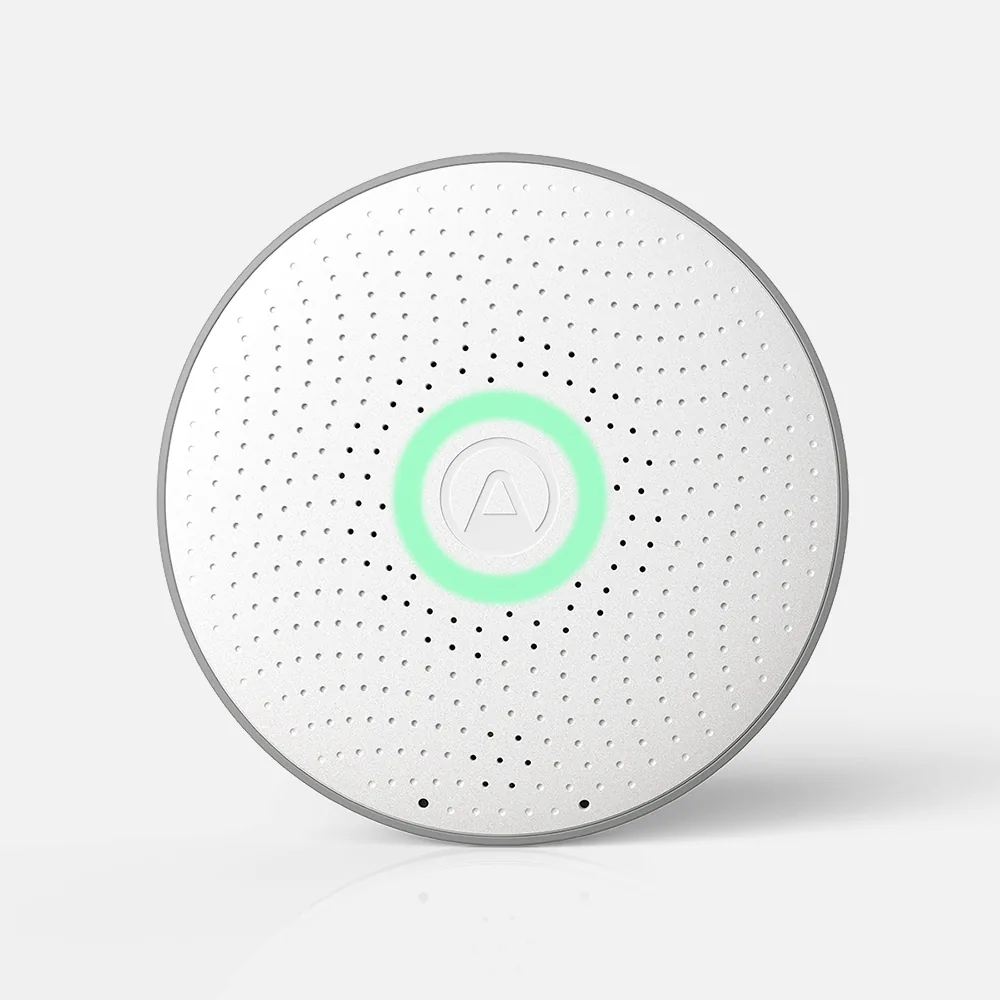
Monitor
Method: Alpha spectrometry
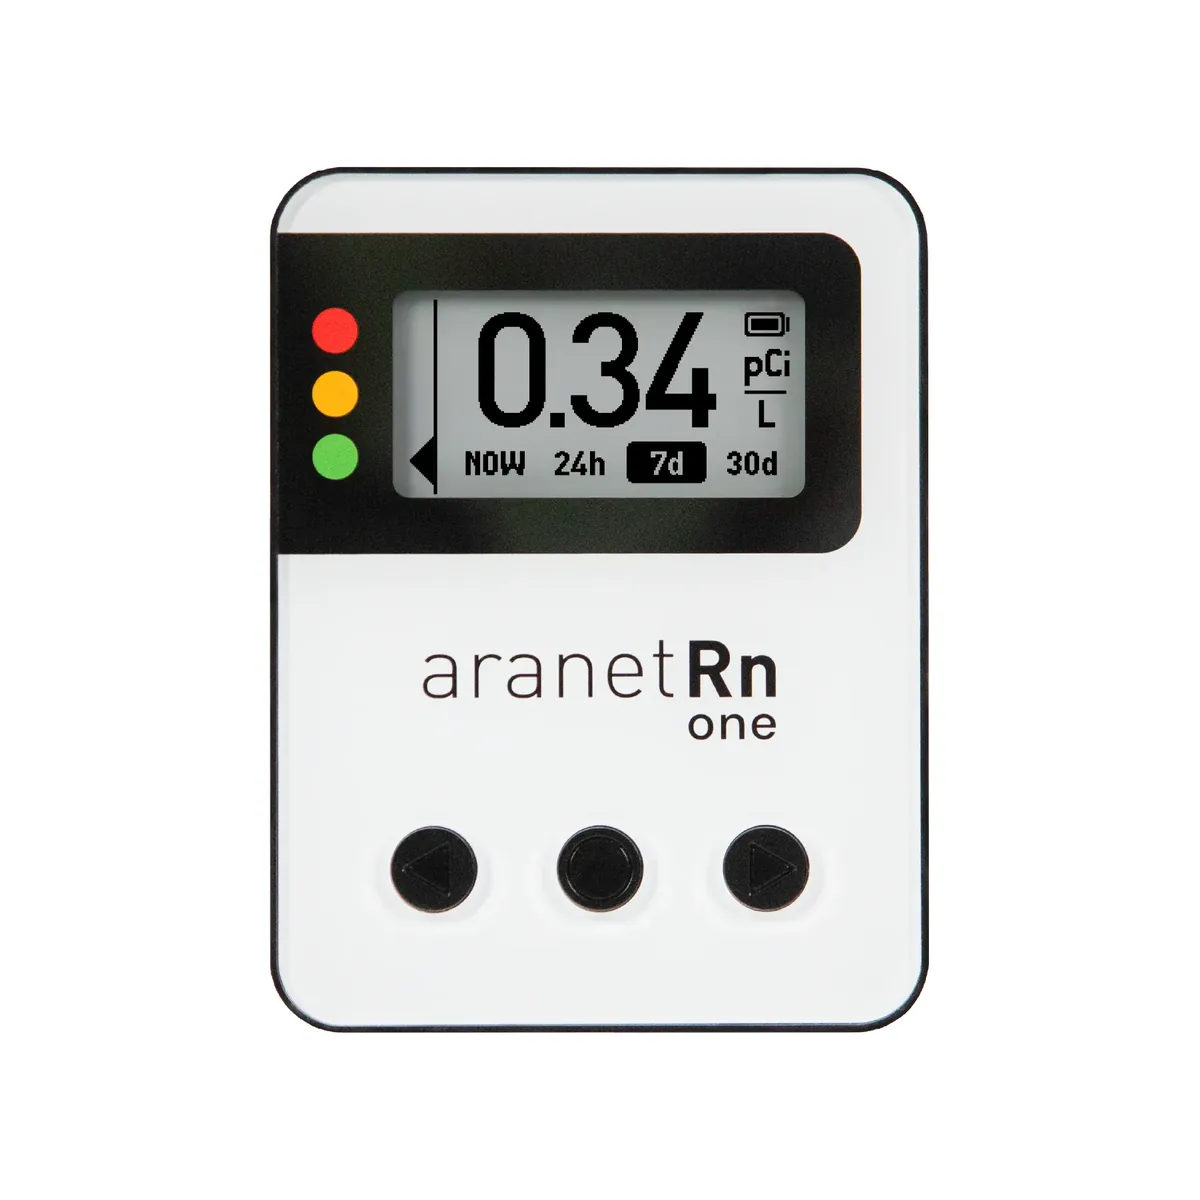
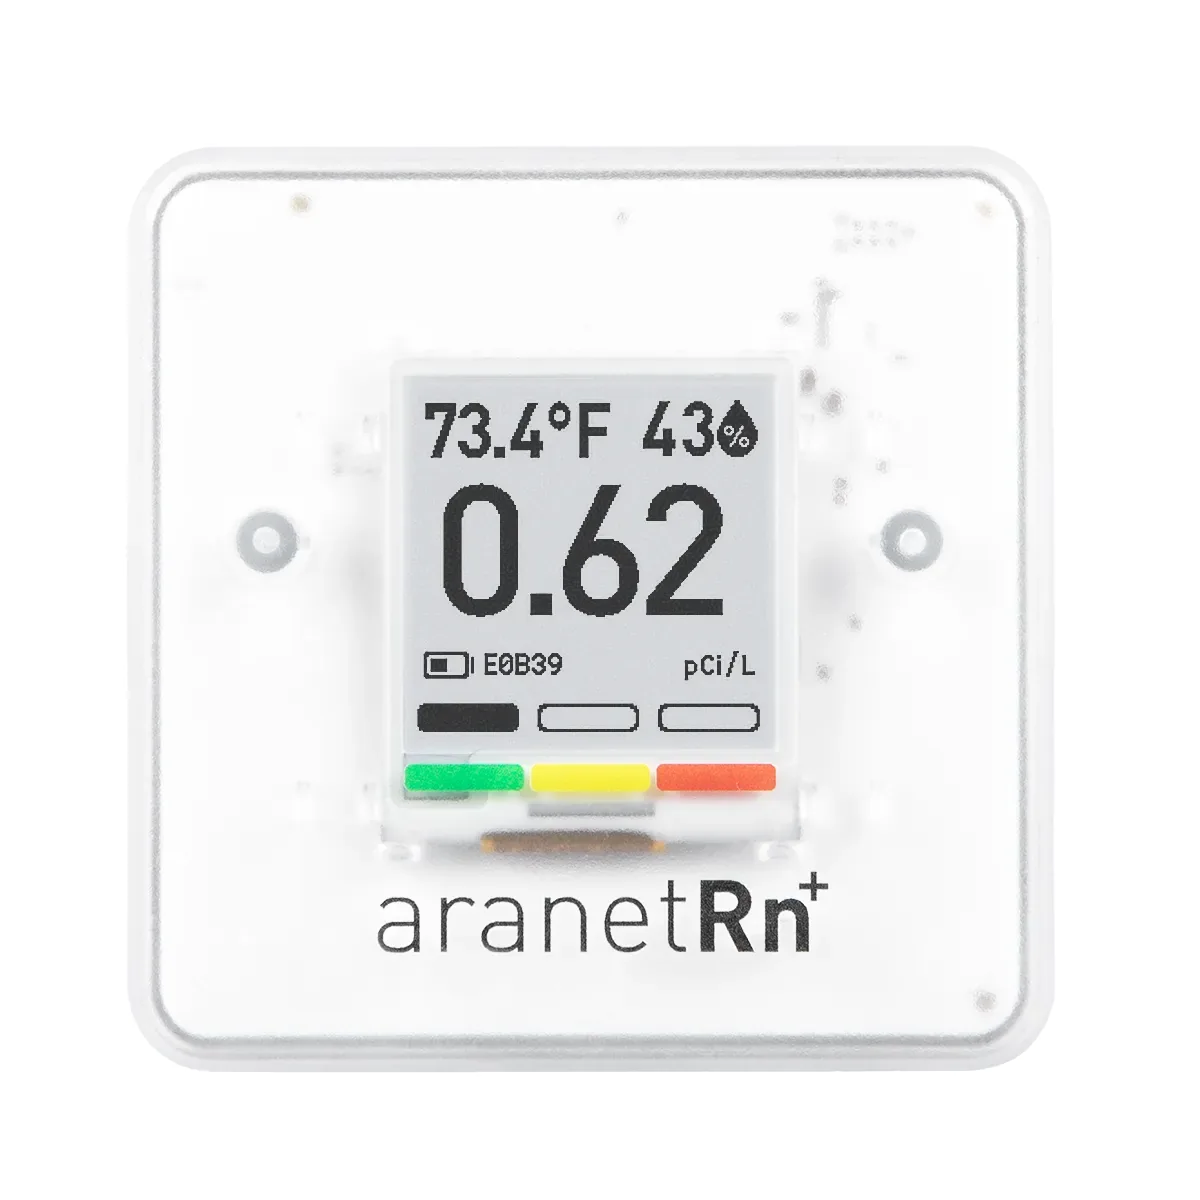
MonitorAranet
Method: Ion chamber
First reading: Within 10 minutes
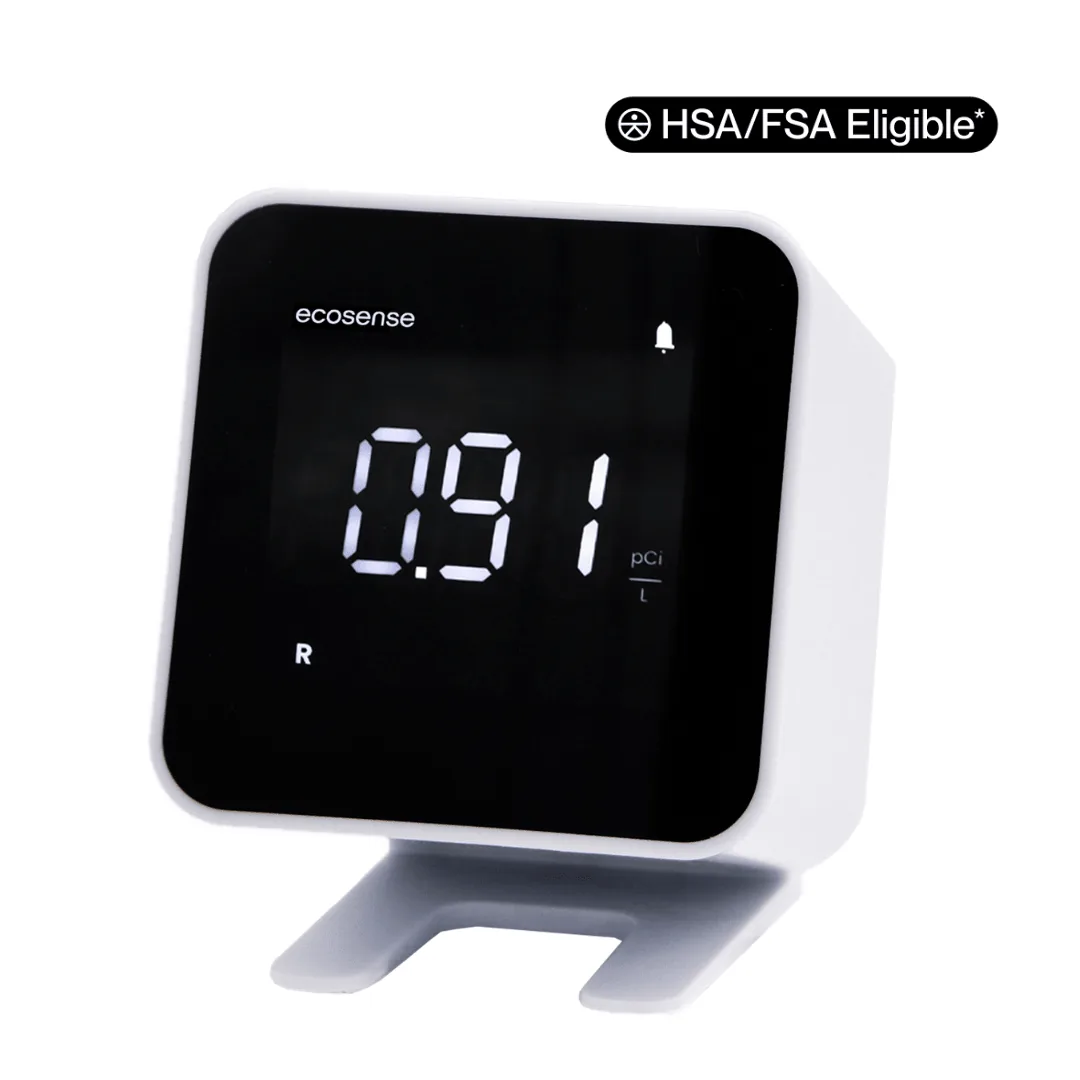
MonitorAranet
Method: Ion chamber
First reading: Within 10 minutes
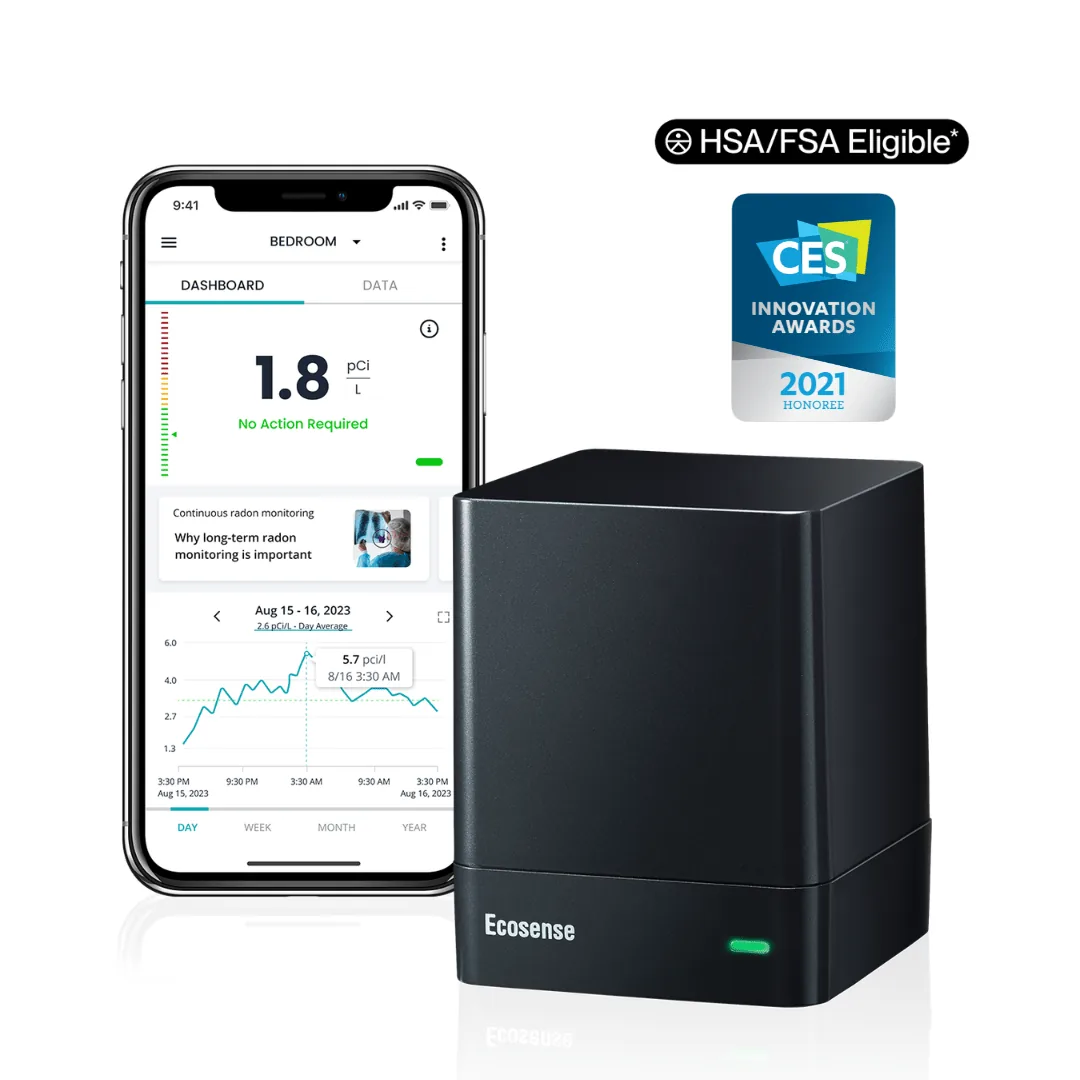
Monitor
Method: Ion chamber
First reading: Within 10 minutes
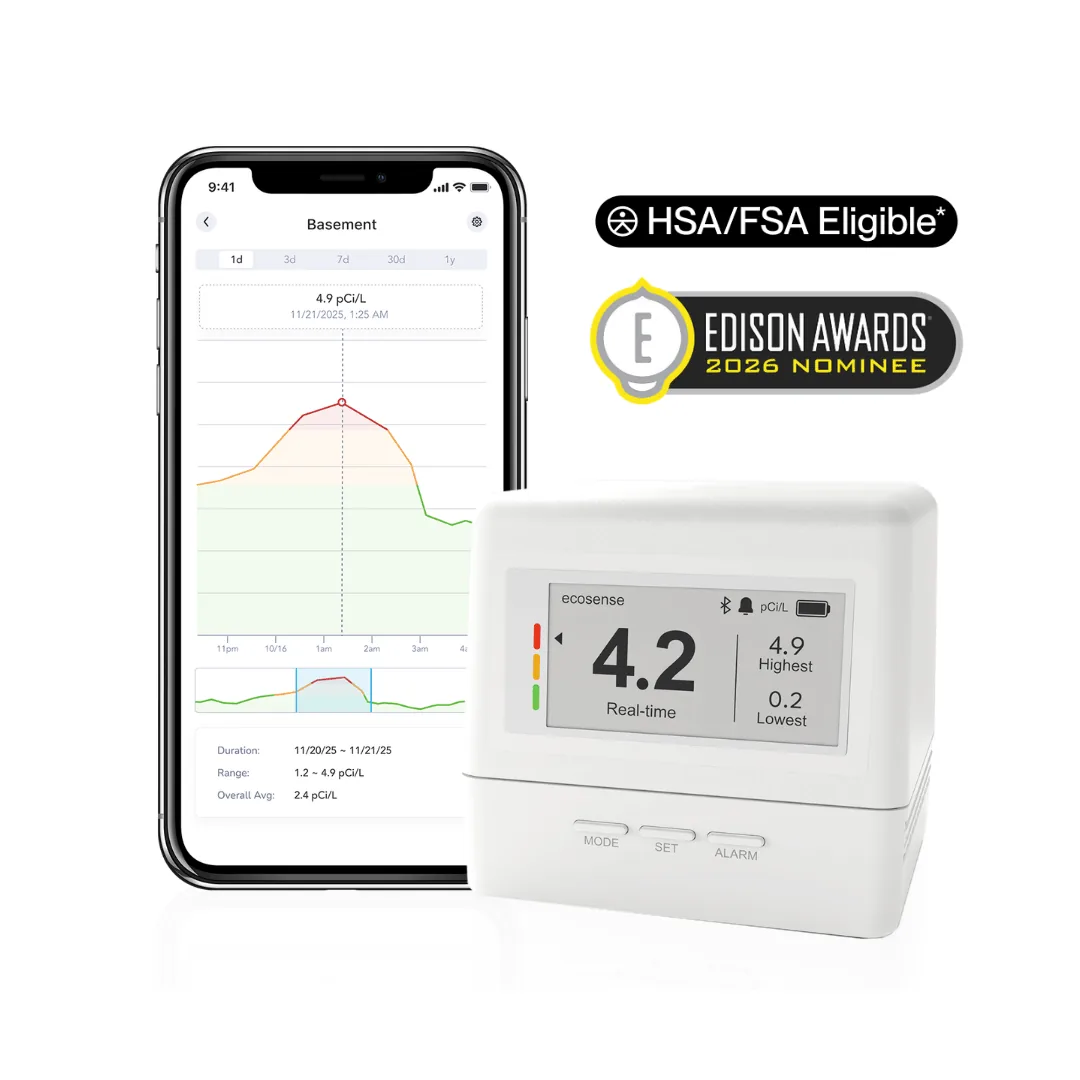
Monitor
Method: Ion chamber
First reading: Within 10 minutes
Monitor
Method: Ion chamber
First reading: Within 15 minutes
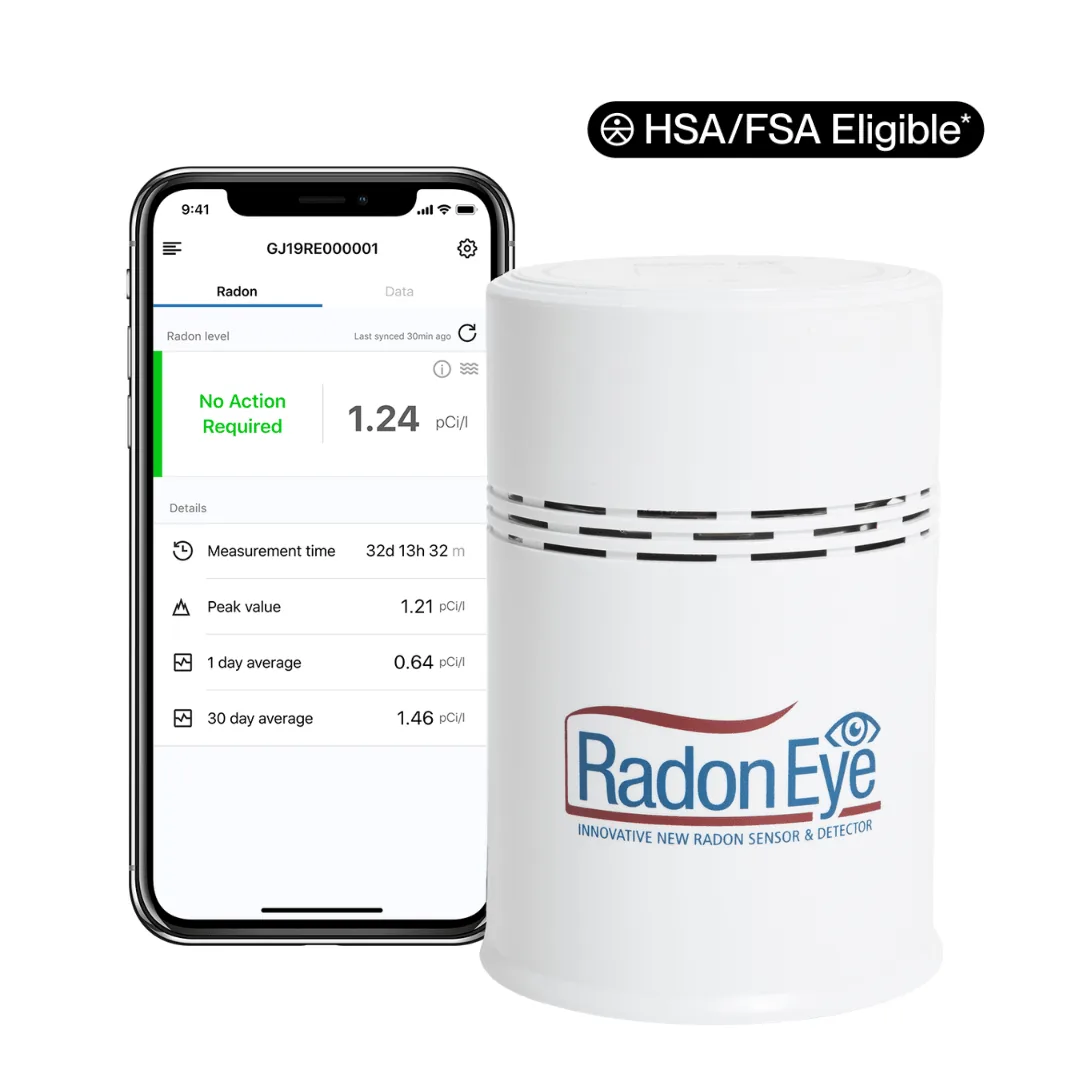
Monitor
Method: Ion chamber
First reading: Within 10 minutes
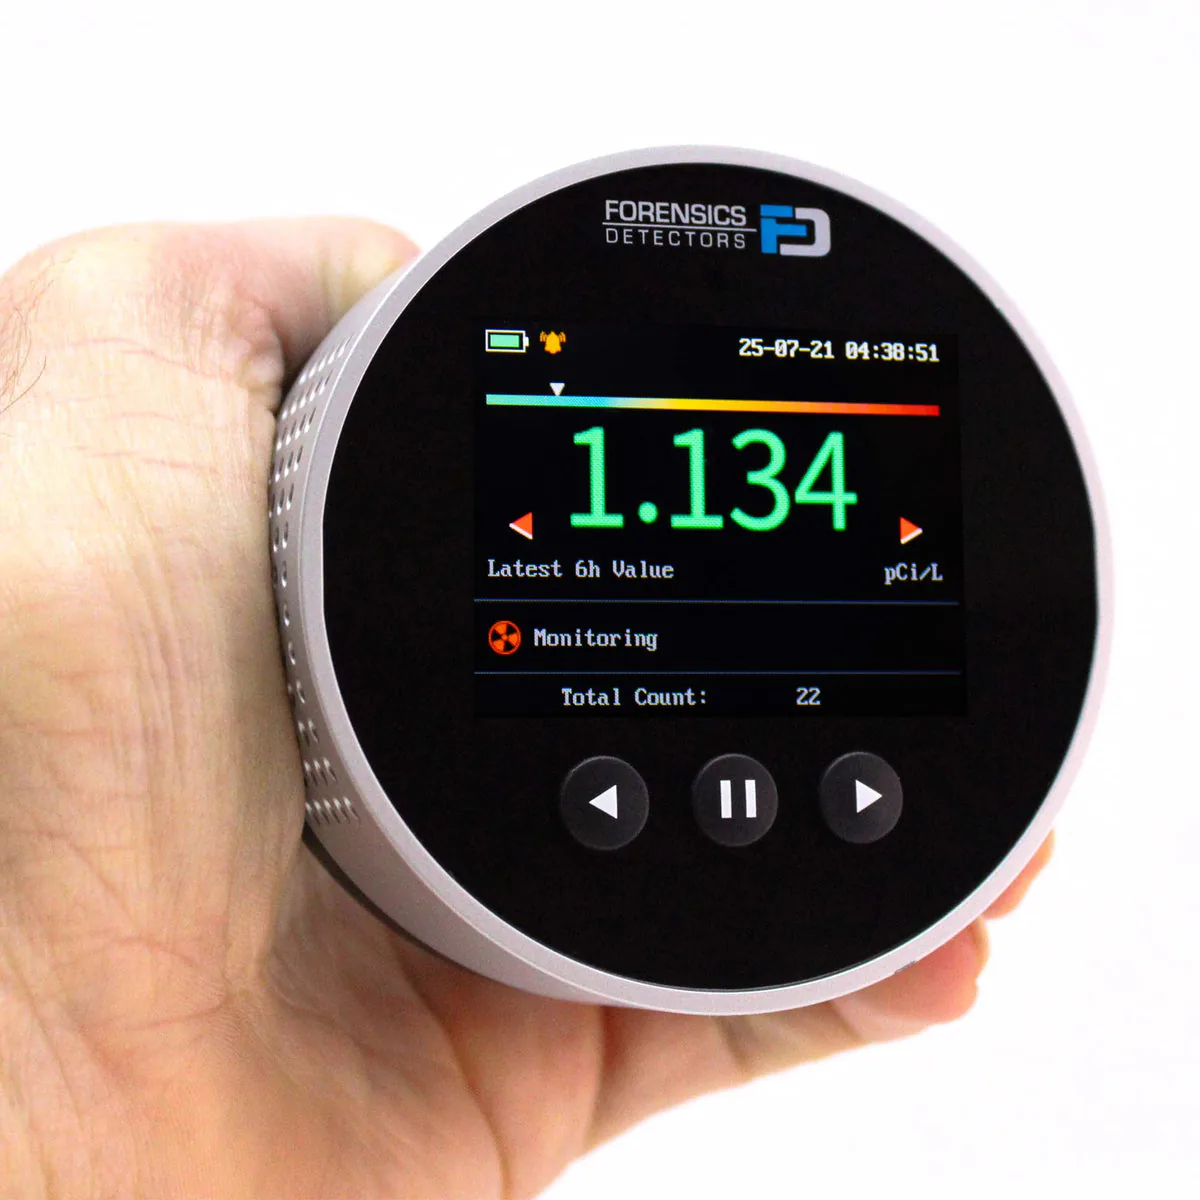
MonitorForensics Detectors
Method: Semiconductor sensor
First reading: Within 6 hours
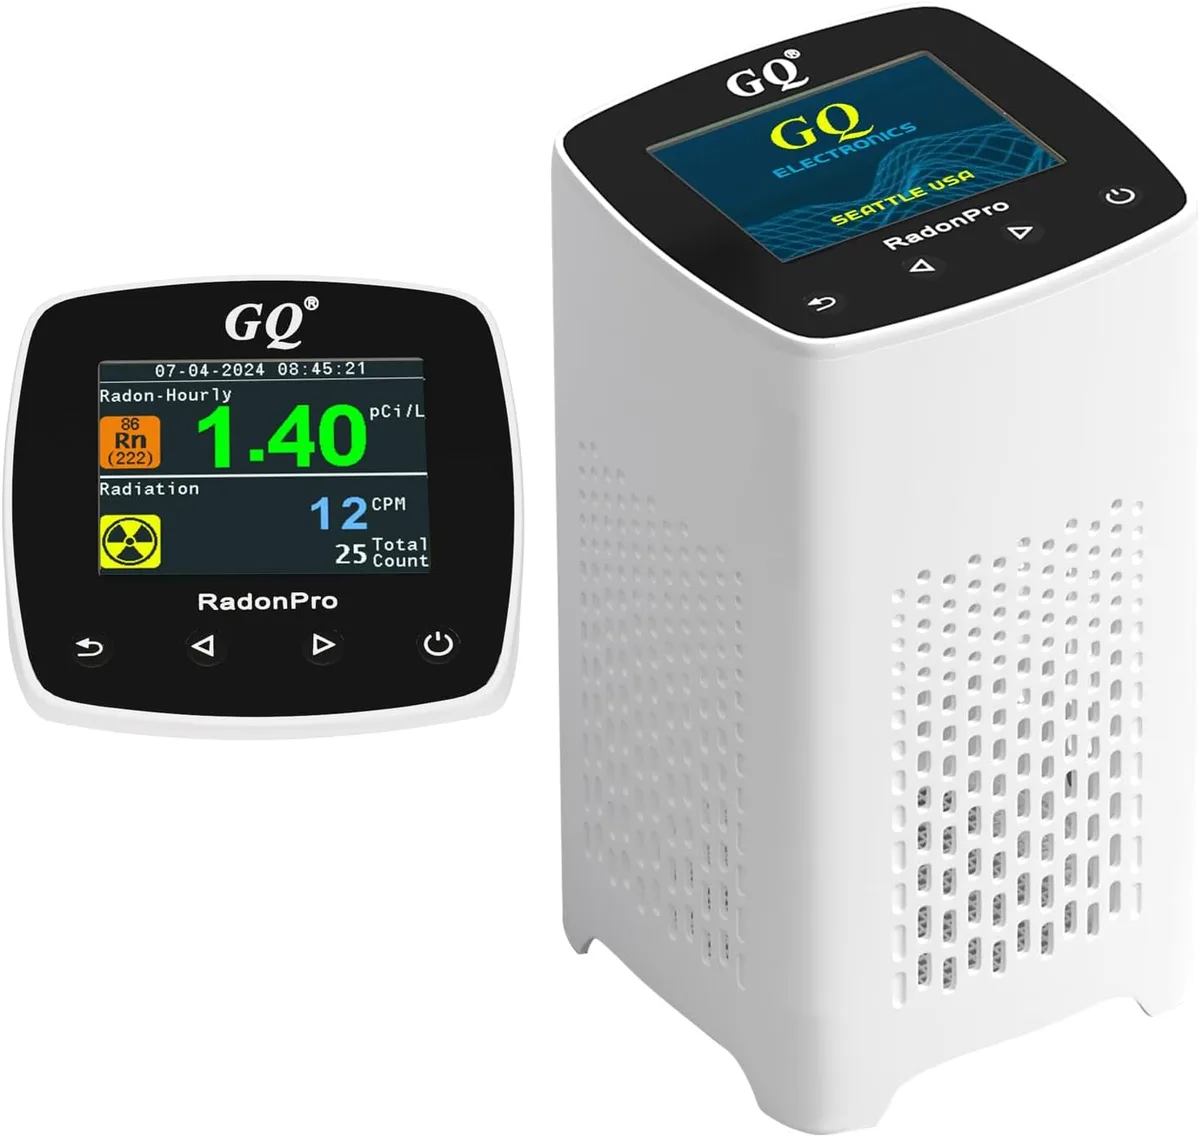
Monitor
First reading: Within 5 minutes
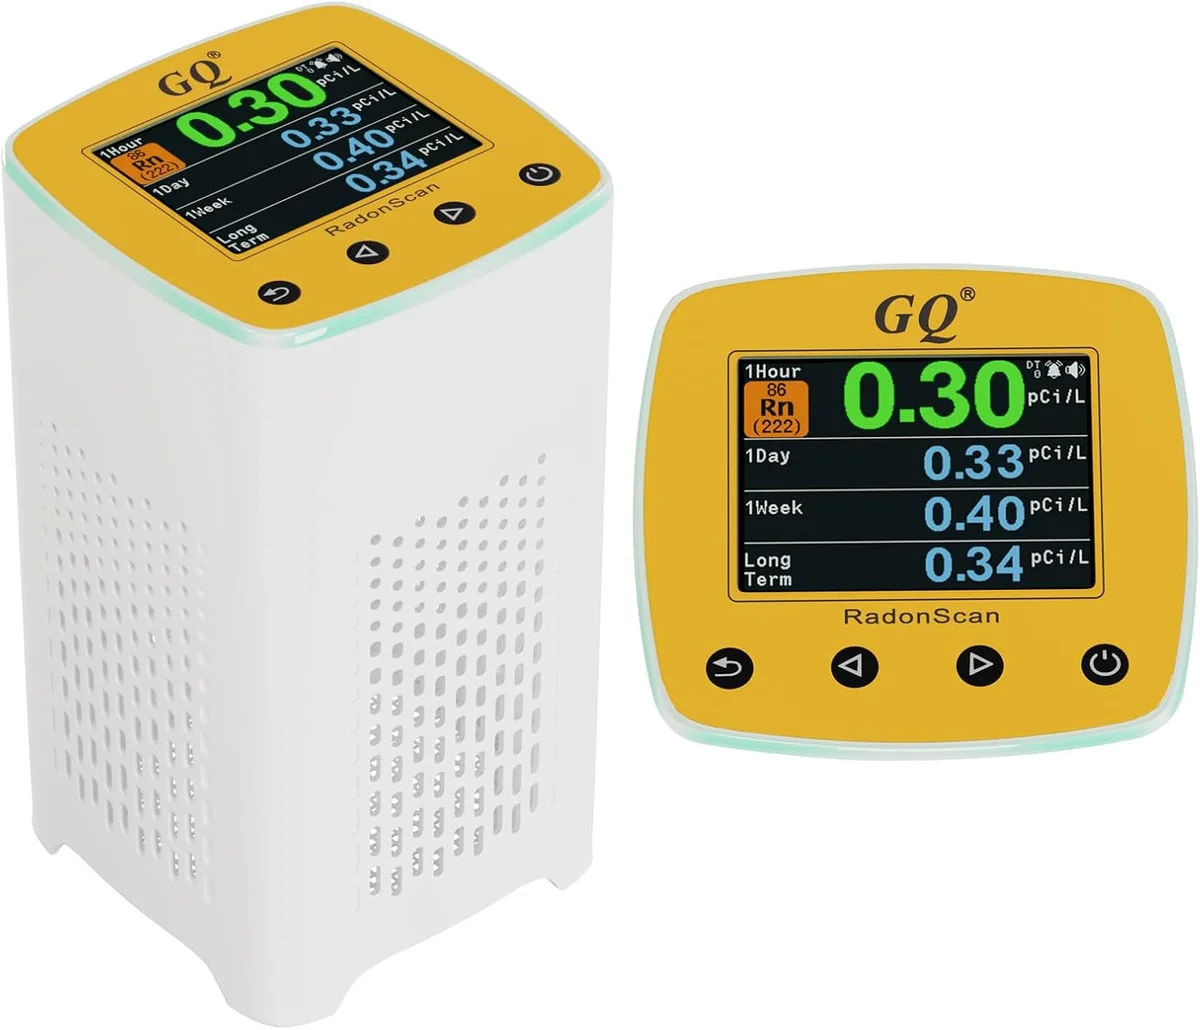
Monitor
First reading: Within 5 minutes
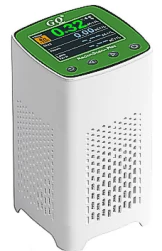
Monitor
First reading: Within 5 minutes
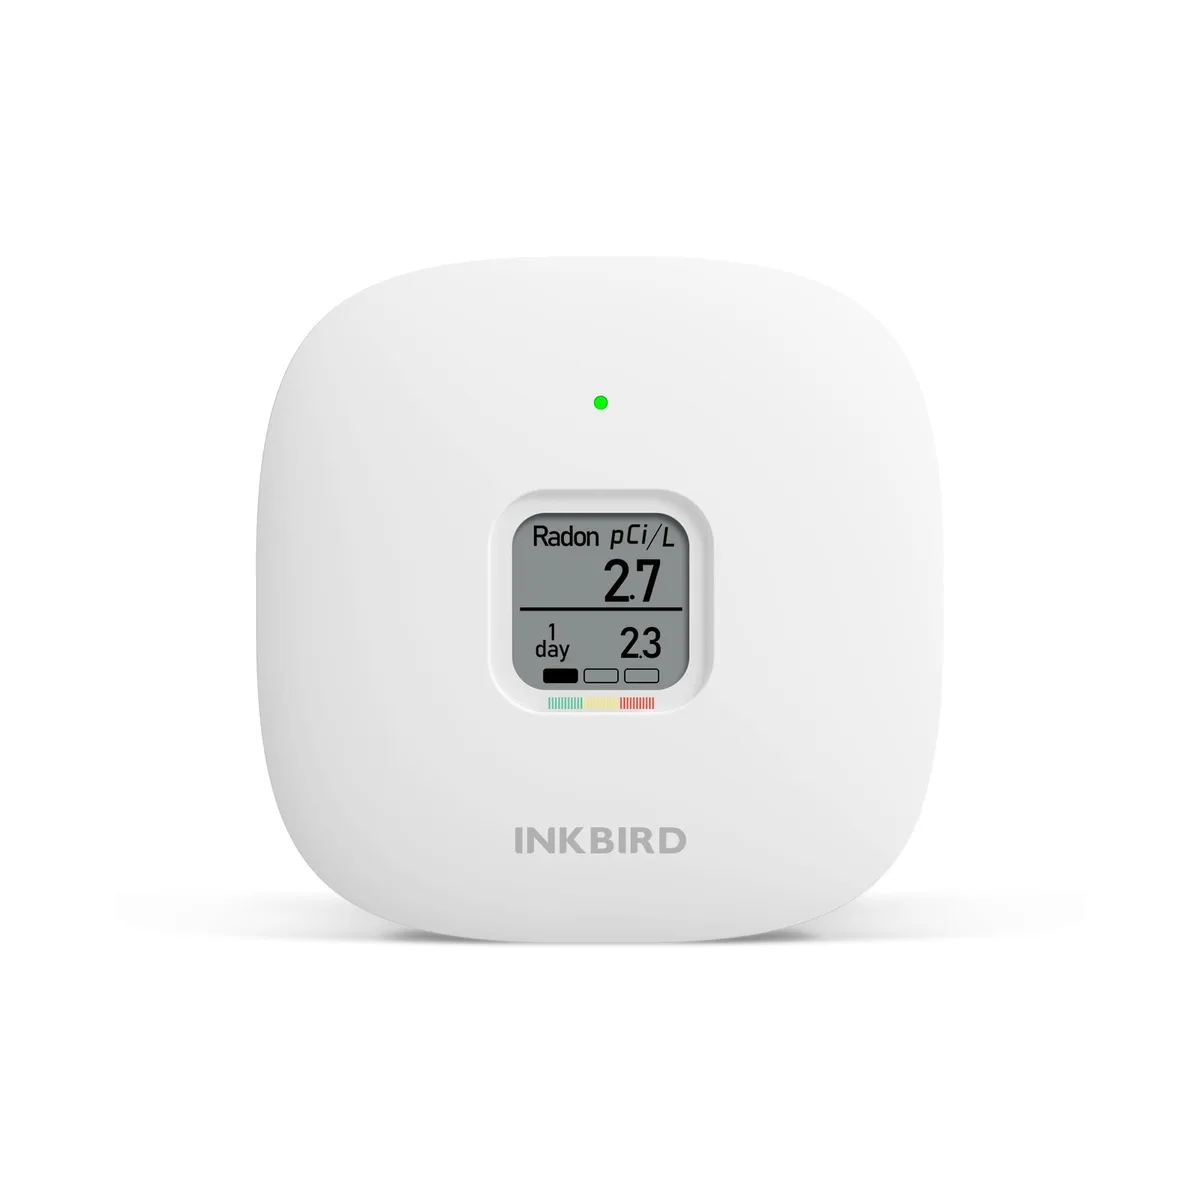
MonitorINKBIRD
First reading: Within 24 hours
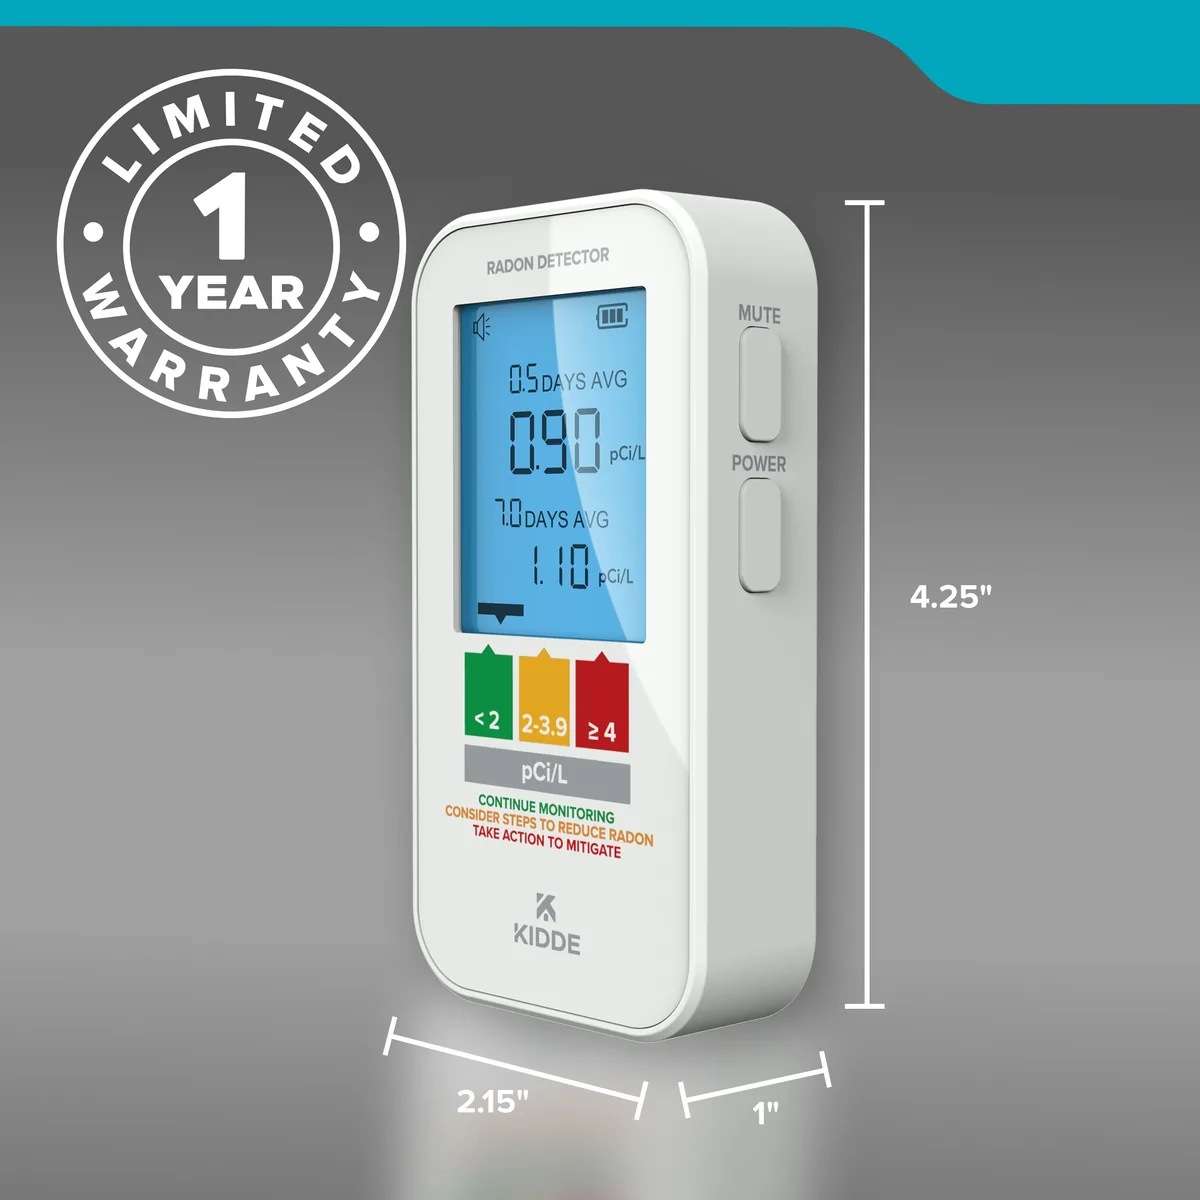
MonitorKidde
Method: Semiconductor sensor
First reading: Within 12 hours
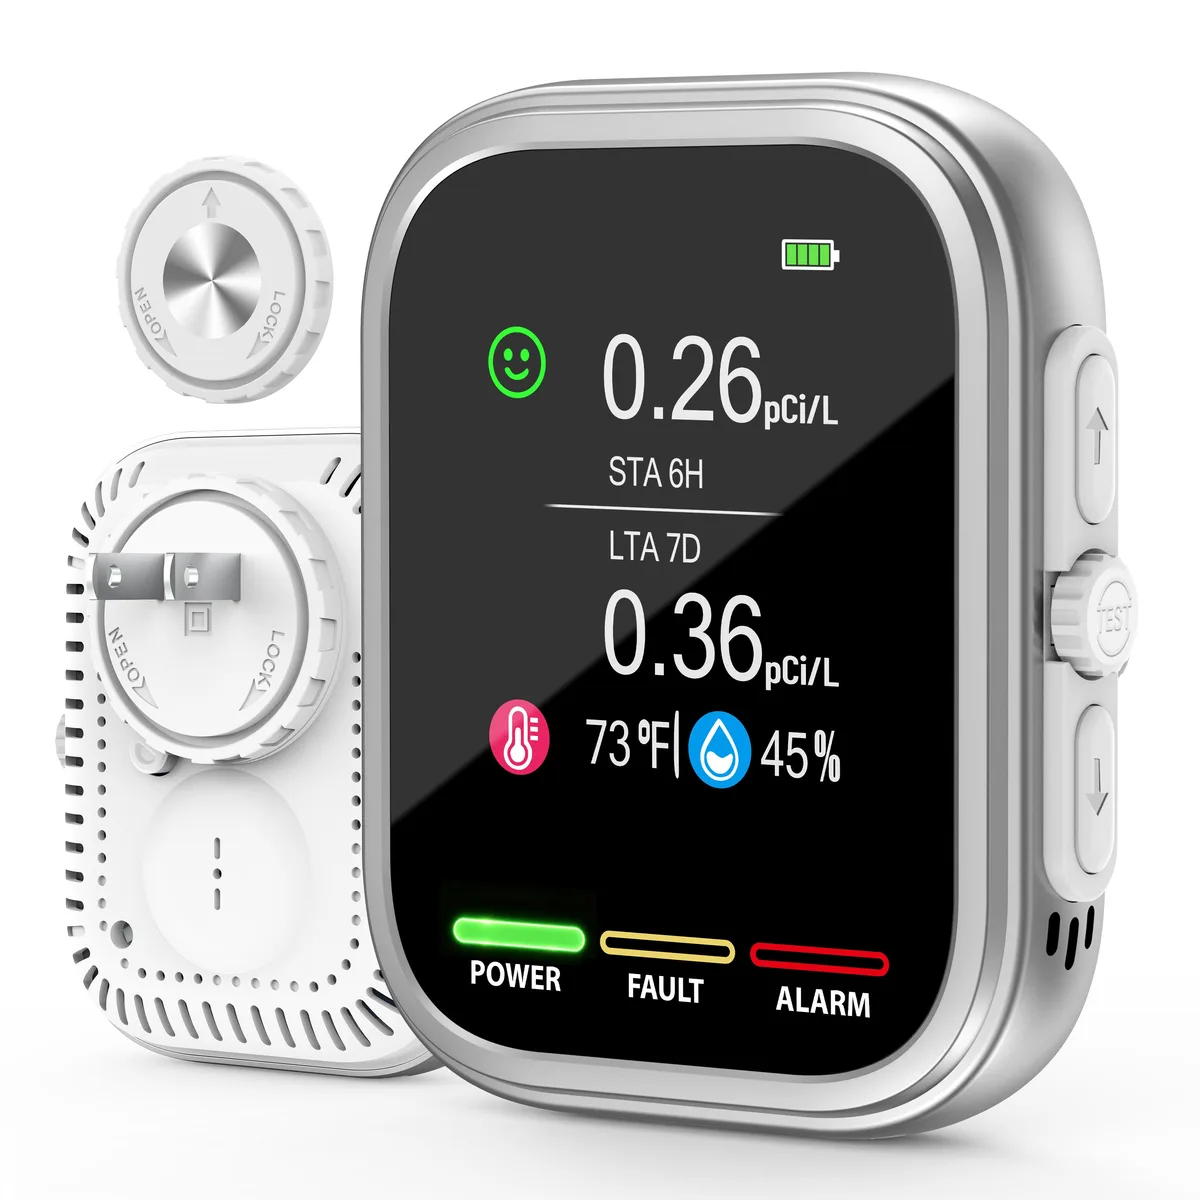
MonitorPYZYCKYH
Method: Semiconductor sensor
First reading: Within 6 hours
MonitorSafetySiren
First reading: Within 48 hours
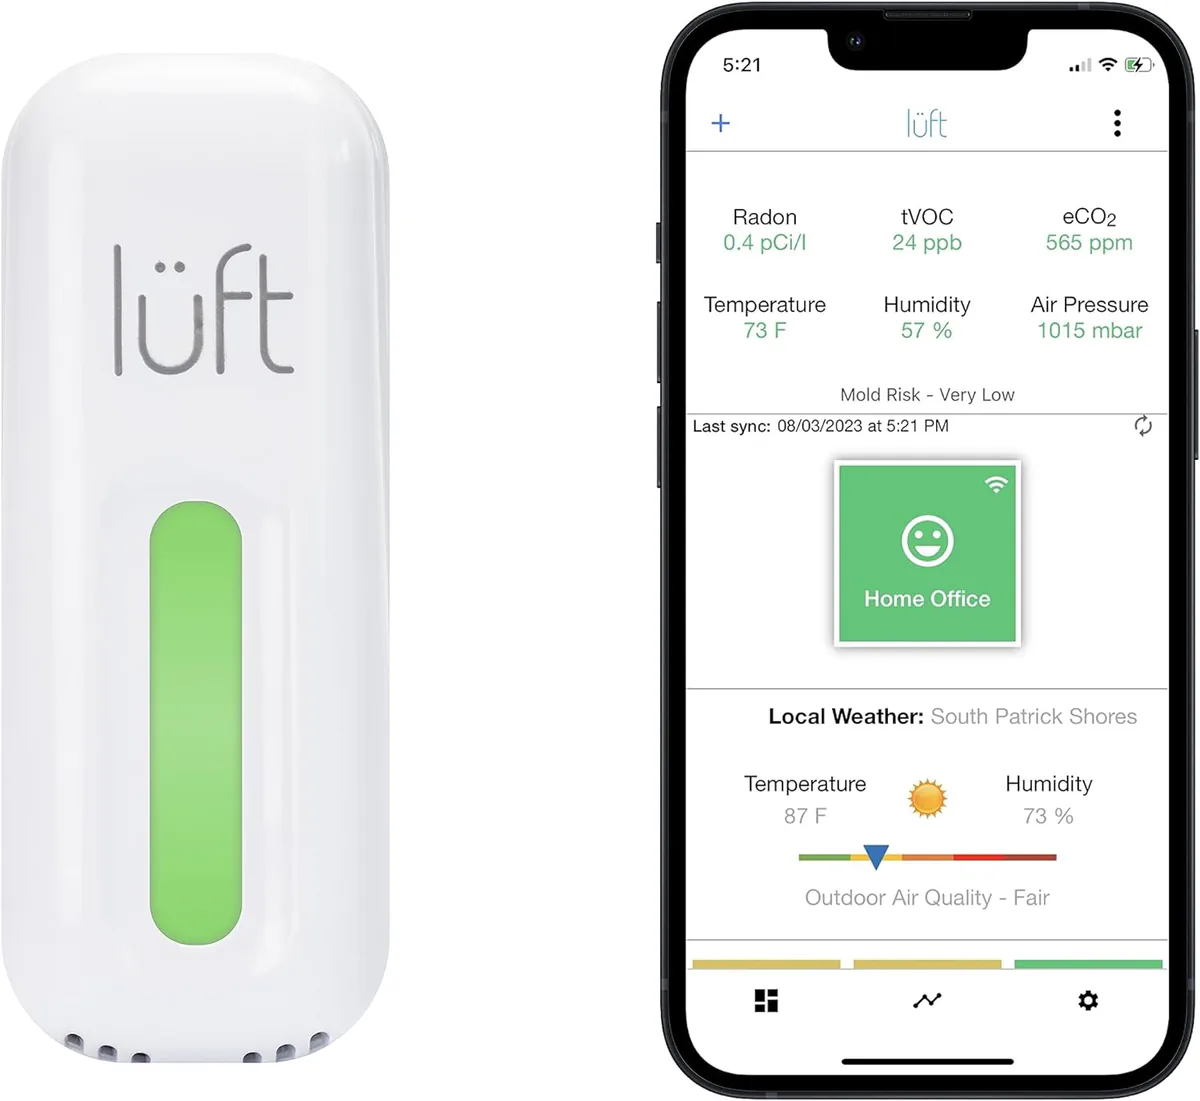
Monitor
First reading: Within 90 minutes
Monitor
Method: Alpha spectrometry
First reading: Within 24 hours
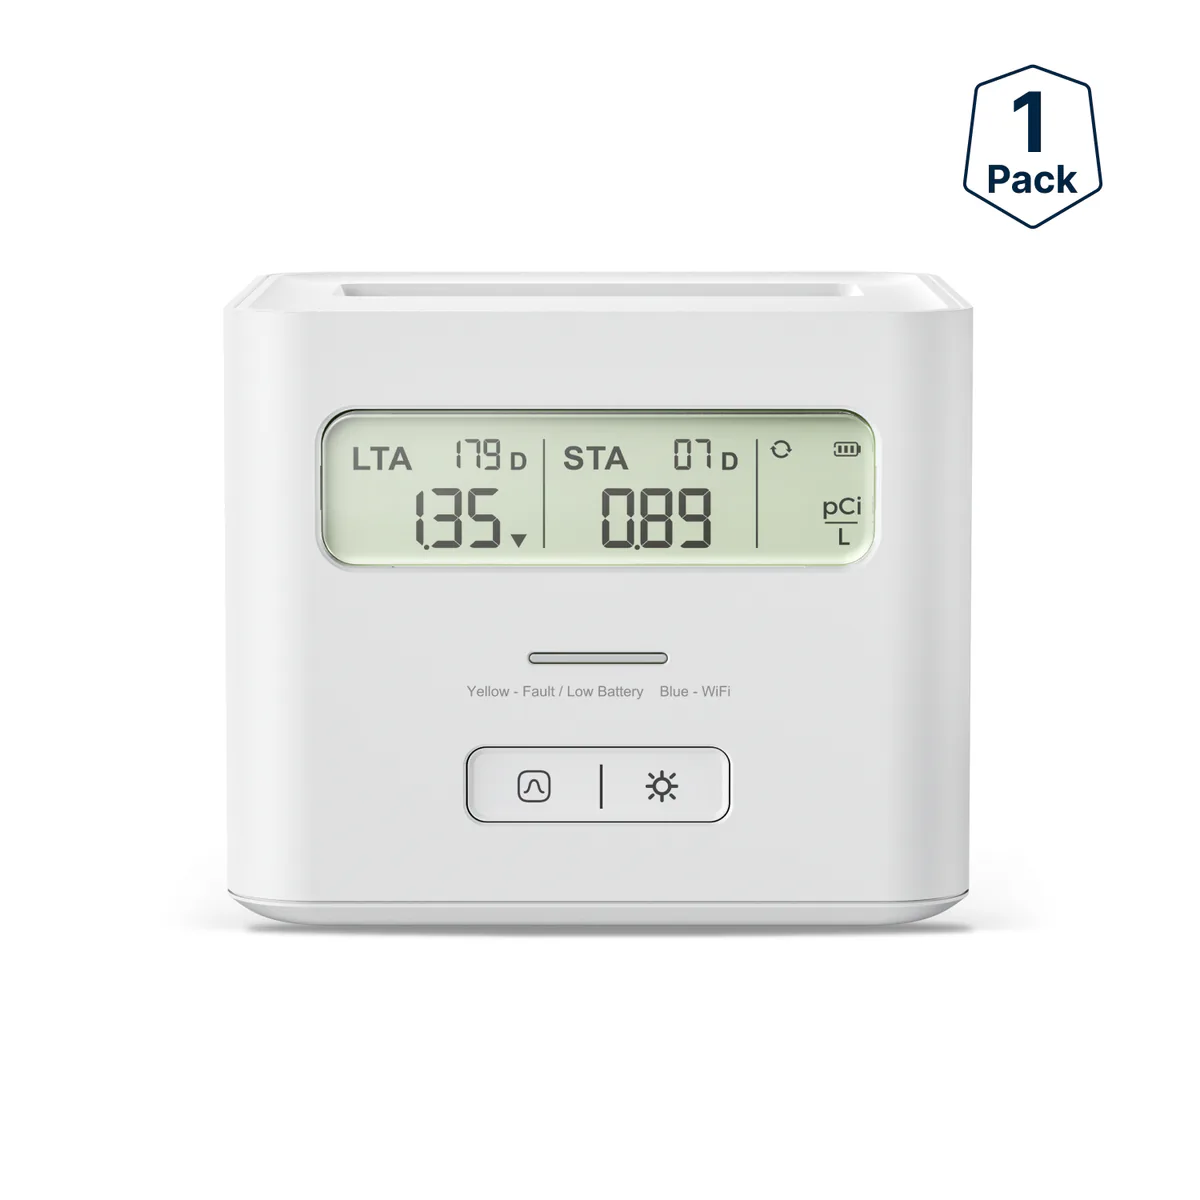
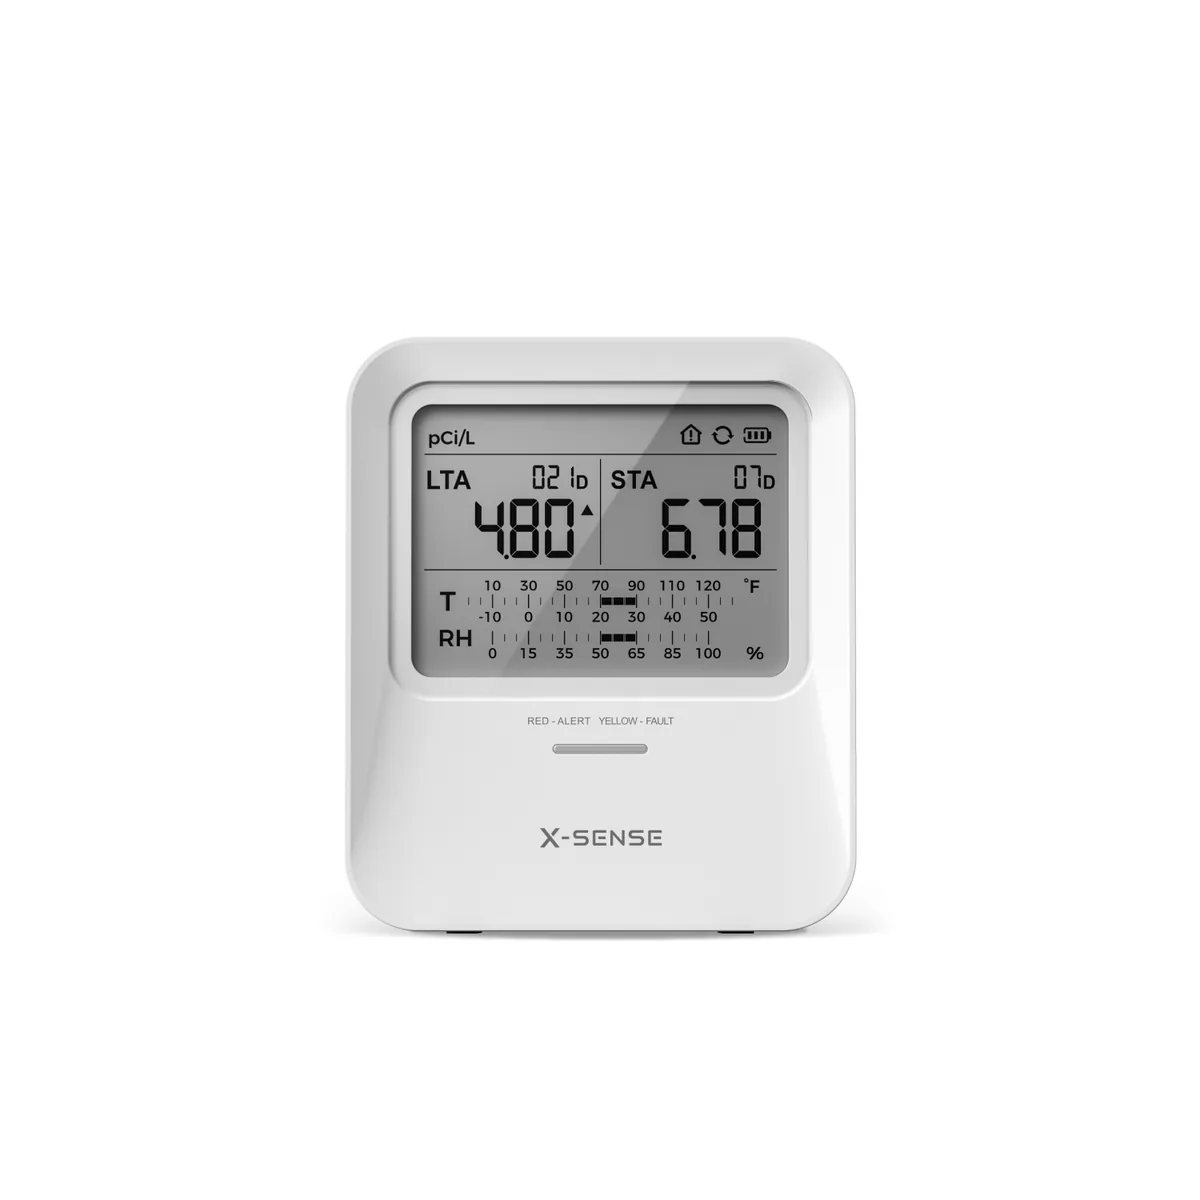
MonitorX-Sense
Method: Alpha spectrometry
First reading: Within 24 hours
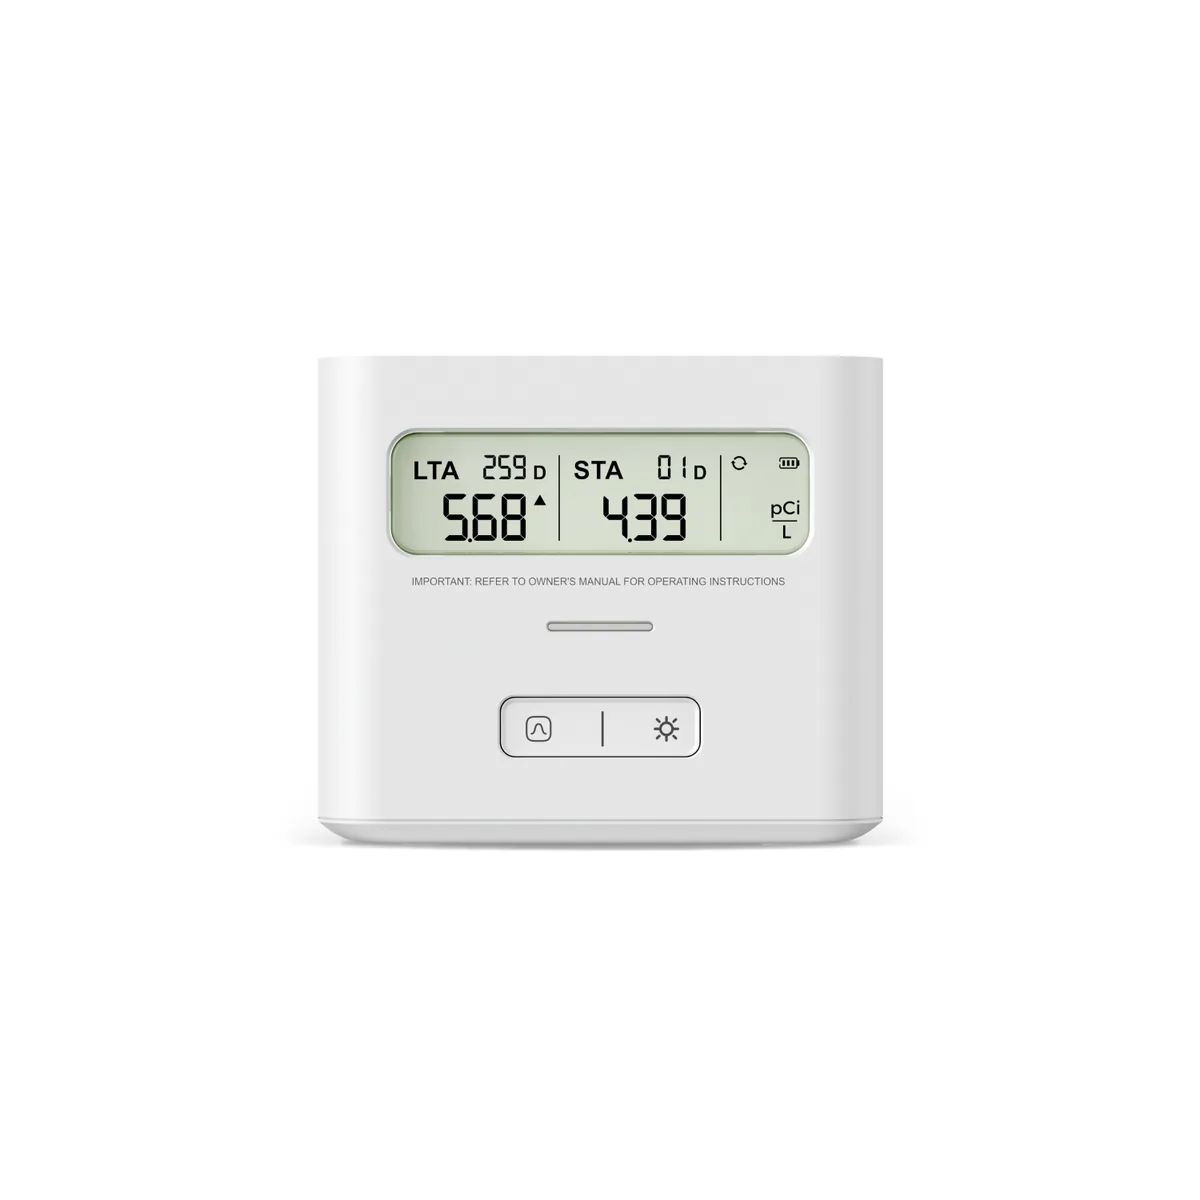
MonitorX-Sense
Method: Alpha spectrometry
First reading: Within 24 hours
MonitorX-Sense
Method: Alpha spectrometry
First reading: Within 24 hours
Pro monitor
First reading: Within 5 minutes

Pro monitor
Method: Ion chamber
First reading: Within 1 hour
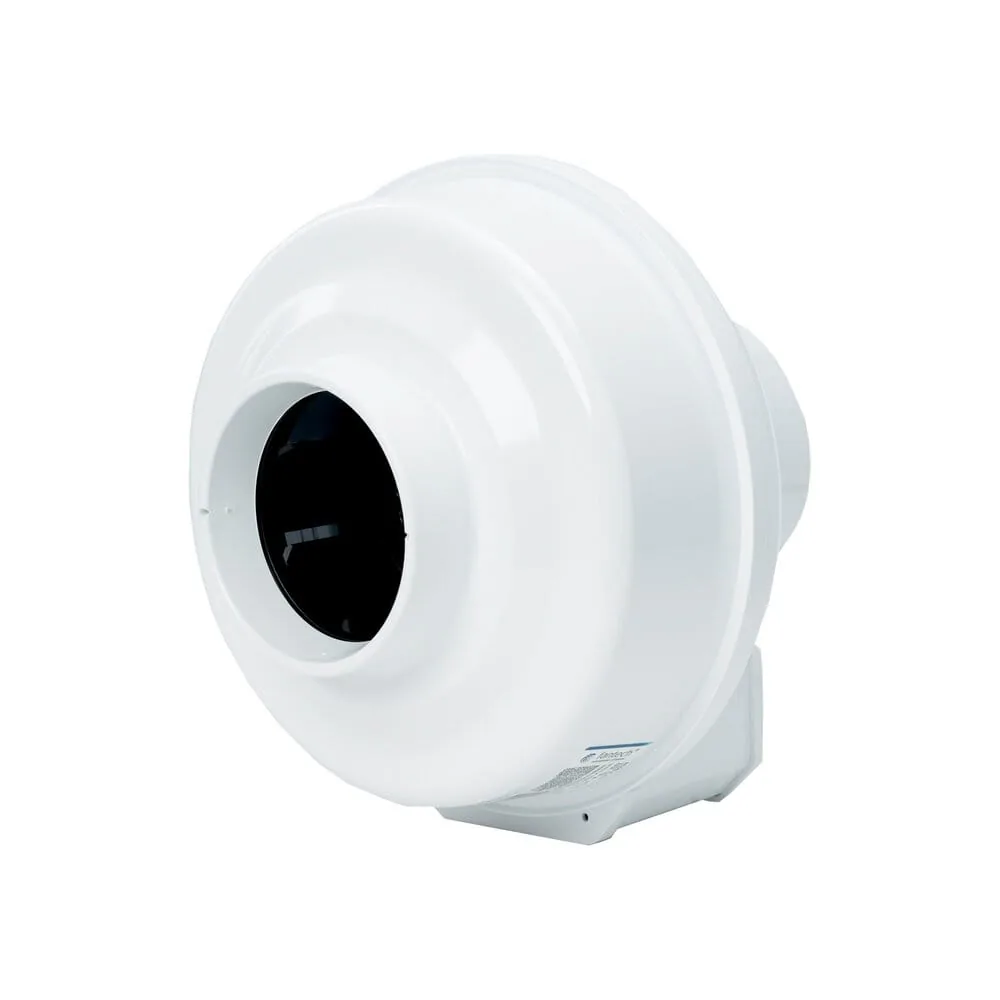
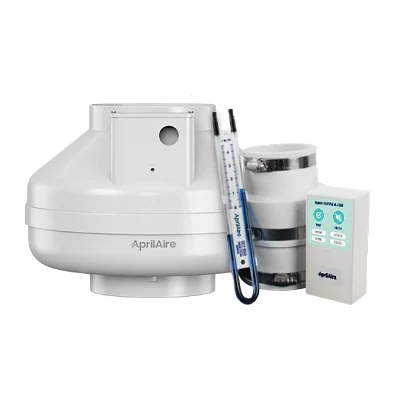
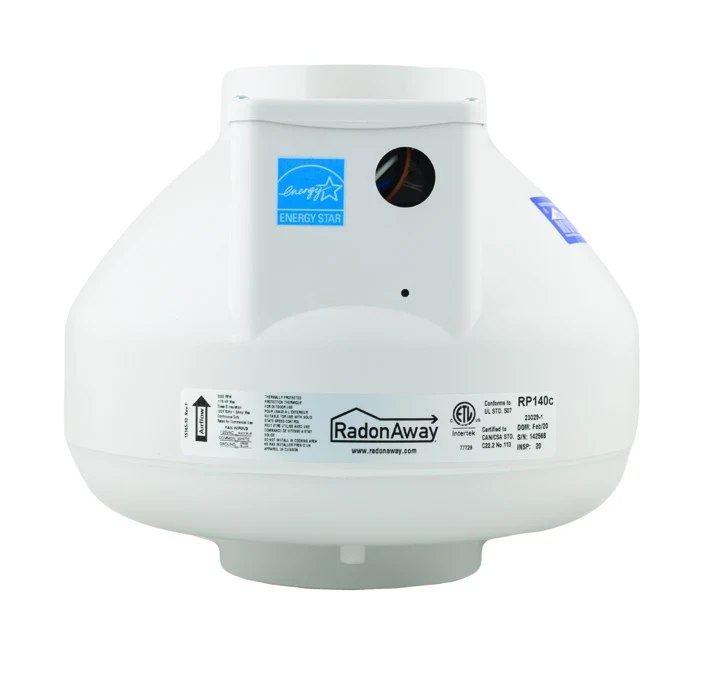
Radon fan
Max airflow: 174 CFM
Max pressure: 2.0 in w.c.
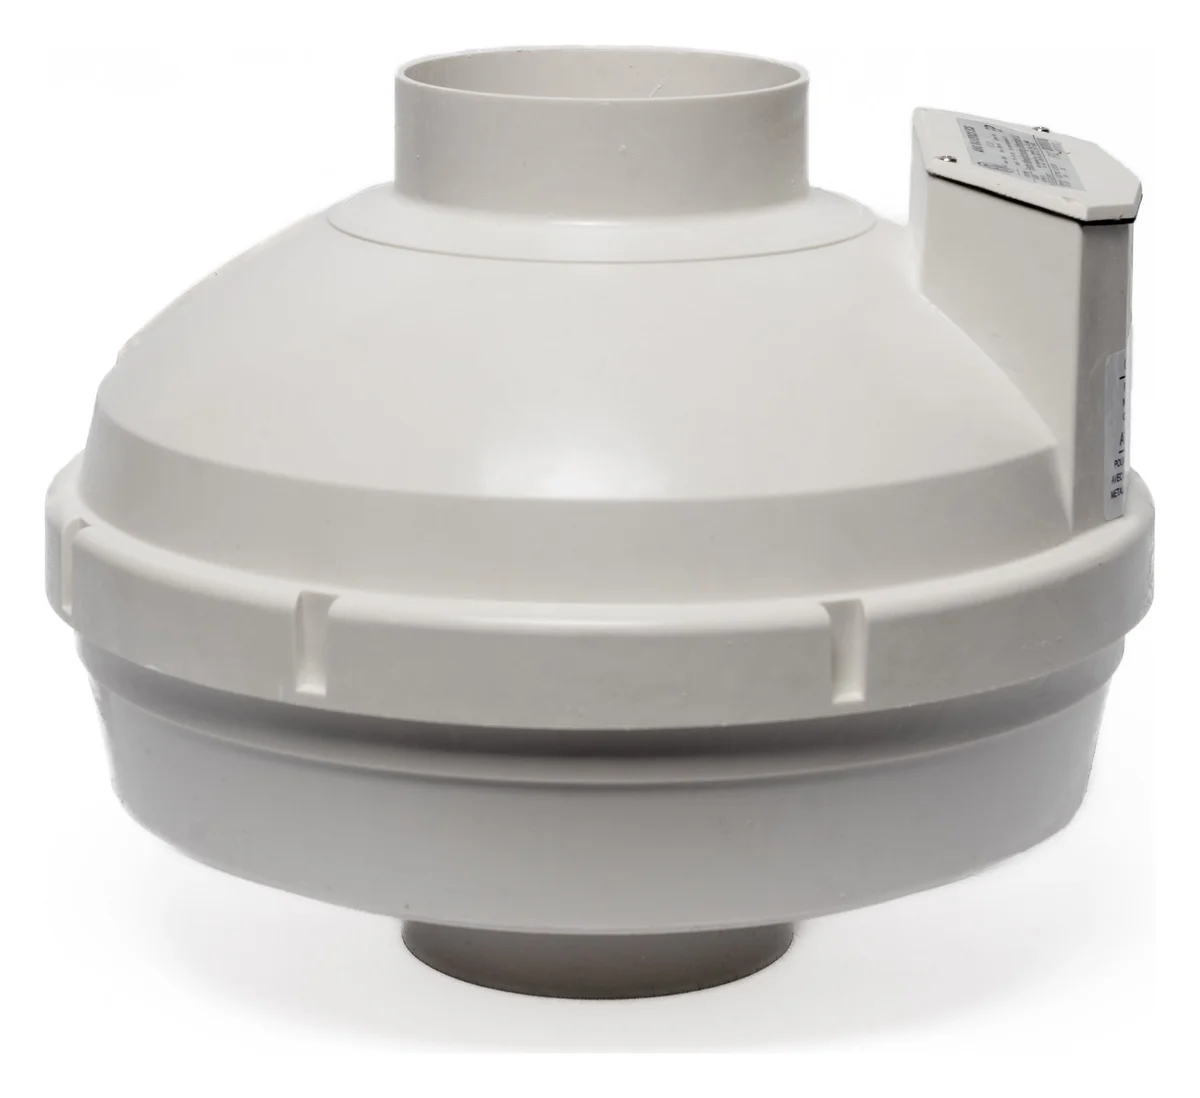
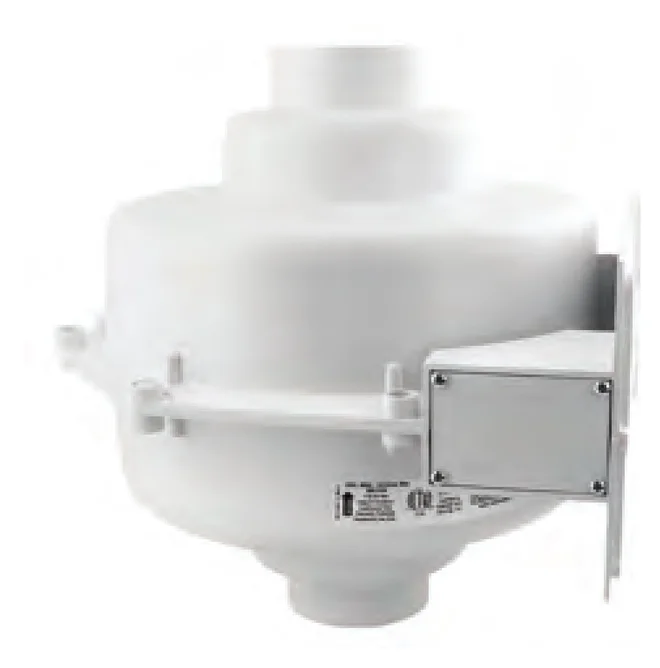
Radon fan
Max airflow: 260 CFM
Max pressure: 2.21 in w.c.
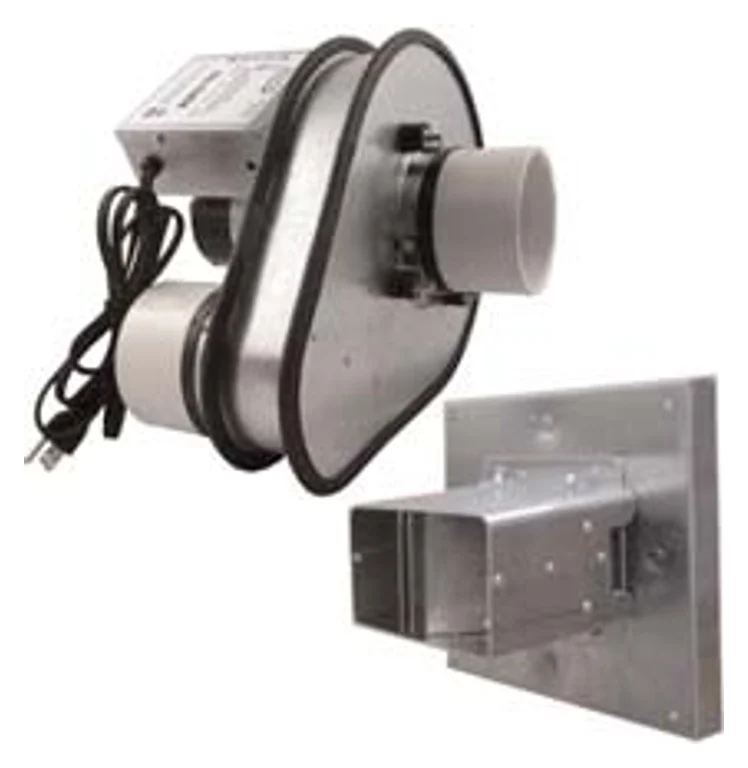
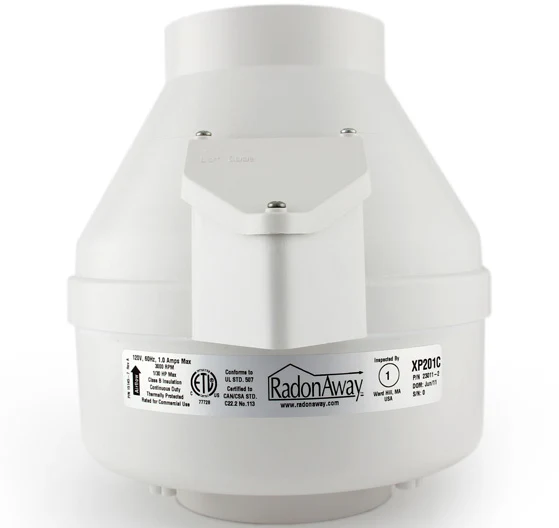
Radon fan
Max airflow: 160 CFM
Max pressure: 2.3 in w.c.
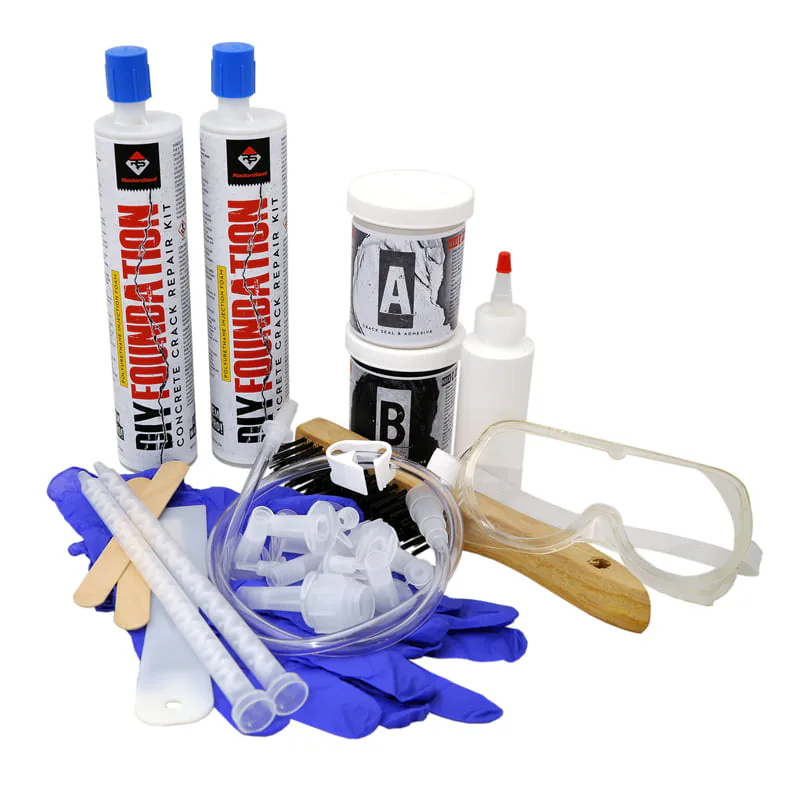
Sealing materialRadonSeal
Made of: Polyurethane injection foam

Sealing materialRadonSeal
Made of: Penetrating concrete sealer
Sealing material
Made of: Elastomeric acrylic
Radon in numbers
A colorless, odorless gas from the soil, and the second leading cause of lung cancer. Testing is the only way to know.
EPA's radon figures: 1 of 3
Try it
Move the reading to see what EPA says about it, or pick a state to see its share of high tests, its rank and its tests beside the country's.
Read a result for any U.S. home
EPA’s own thresholds; the figures are the area’s, never this home’s.
EPA’s reading of 4.0 pCi/L
At or above 4 pCi/L
This result is at or above 4 pCi/L. EPA recommends fixing a home when the radon level is 4 pCi/L or higher. 36.3% of the country's reported tests reached 4 pCi/L, 2006 to 2015.
Share at 4+ pCi/L
23.4%
12.9 pts below U.S.
Pooled from its counties' tests, 2006 to 2015
Rank among states
34 of 47
Middle of the states
By share, every state pooled the same way
Tests reported
240,291
Most tested state
Reported to CDC before any fix, 2006 to 2015
Counties with figures
14
Counties pooled
Each county's own page has its full record
Start here
Choose the one closest to yours. Each opens the guide written for it.

How to test your home, and what your result means.

When to test during a purchase, and what to ask the seller.

Testing before you list, and what you must disclose.

Radon in rental homes: who tests, and what to ask.

Radon disclosure rules, state by state.

Radon testing during a home inspection.

The radon record for any state or county.

What radon is, in plain words.
Your area
EPA puts every county in one of three zones by its predicted average indoor radon level. A zone is a prediction for the whole county, not a reading of any home. Every state and county has a free page: choose yours on the map, type it, or find it in the list.
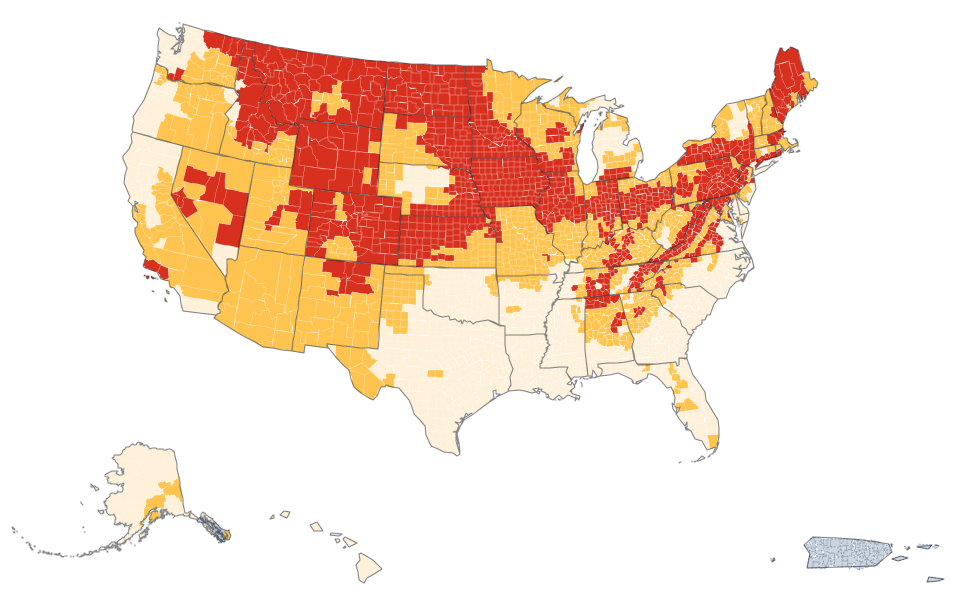
Measured: tests of other buildings are on file for 2,863 counties, never a reading of your home.
An EPA radon zone predicts a whole county. It is not intended to determine whether any individual home should be tested: homes with elevated levels occur in all three zones, and EPA recommends testing every home regardless of zone.
Open the radon mapMeasured: each state’s counties’ reported tests added up, 2006 to 2015. Choose the figure, then open a state.
Four steps
The whole path, from a county report to a confirmed fix in your own home.
Learn
Test
Fix
Find a pro
Guides
Plain answers on what radon is, how to test a home and how to bring a high level down.
Lead guide, learn
Radon gas is a naturally occurring radioactive gas, with no color, smell or taste, that forms as uranium breaks down in rock, soil and water. It dilutes quickly outdoors but can build up inside buildings, and a test is the only way to know the level in yours.
Lead guide, test
A radon inspection is a radon test run by a qualified tester, who places a device on the lowest level of the home that could be used regularly and runs it for a minimum of 48 hours under closed-house conditions. EPA recommends fixing a home when the radon level is 4 pCi/L or higher.
Lead guide, fix
A radon remediation system lowers a home's radon level, and the method EPA says is primarily used is soil suction: a vent pipe and fan that pull radon from beneath the house and vent it outside. EPA recommends a qualified contractor and a test after installation, and says some systems reduce radon levels by up to 99 percent.
Lead guide, buying and selling
EPA recommends knowing the indoor radon level of any home you consider buying, so ask the seller for results and have the house tested if there are none. A high level has a known fix: even very high levels can be reduced to acceptable levels.
Lead guide, owning and renting
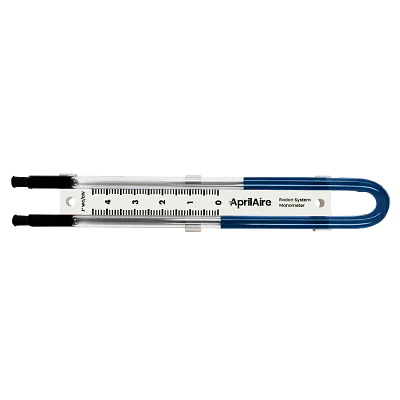
A radon system is a radon mitigation system, most often a sealed suction point, vent pipe and fan that pull radon from under the house and vent it above the roof. It needs little upkeep: the fan runs all the time, the manometer shows it is pulling, and a retest at least every two years shows radon stays low.
Get help
Radon411 does not certify anyone or perform tests. It lists what is published, so you can compare and choose.
Professionals
2,035 measurement and mitigation businesses are listed, each with its certification shown the way the certifying body published it.
Products
62 radon products are compared on their published specifications, each on its own page with how it works and, for a monitor, its independent test status. Affiliate links are labeled where they appear.
Our standard
How Radon411 works: 1 of 3
Your next step
Every state and county has a free report: its predicted zone, the tests on file and what to do next.