MonitorAEGTEST
HOUND-1011 rechargeable radon detector with a screen
- C-NRPP 2024/25: Not included
- Battery
- Alarm
- Screen
Method: Semiconductor sensor
First reading: Within 6 hours
Locations and reports
EPA puts Providence County in Zone 2, its middle radon zone. Homes with elevated levels occur in all three zones, so only a test measures yours.
Data checked By Radon411Methodology
The data
Providence County, At a glance
Predicted: EPA radon zone
This is a county-level geologic prediction. It is not a measurement of any address, and houses with elevated radon are found in all three zones.
EPA predicts an average indoor
USGS geologic potential: Moderate across 60% of the county's area
Predicted: EPA Map of Radon Zones
Measured: tests reported to CDC
Of 108 pre-mitigation tests reported to CDC, not homes in this area.
| Result band | Tests Measured | Share Measured |
|---|---|---|
| Under 2 pCi/L | 97 | 89.8% |
| 2 to 4 pCi/L | 9 | 8.3% |
| 4 pCi/L and above | 2 | 1.9% |
CDC publishes this figure only for counties here, so there is no state or national number to compare Providence County, Rhode Island with.
Distribution of radon tests reported to CDC, not this house. People testing before a sale, or because they suspect a problem, are over-represented in any reported testing data.
The figures at the top are for 2018: a percentage there is a share of radon tests reported to CDC for Providence County in 2018, and a percentage in a view below is a share of the tests reported for the year or period it names. It is not a share of homes in Providence County, and it is not a random sample: it counts only the tests people chose to run and that were reported.
CDC works out the shares and the median over pre-mitigation tests, counting a test not marked as before or after mitigation as one of them (108 for 2018). The median is the middle result of those tests, not of buildings. CDC also reports the number of buildings tested (34), a different count, so the two totals are not interchangeable.
Providence County's own published CDC figures beside those of the counties that border it, for the same period.
Each figure is that county’s own published CDC figure for 2018, counting radon tests reported to CDC, not homes. Providence County is this page. Nothing is averaged or combined across counties. The test count beside each county is CDC’s published number of pre-mitigation tests behind its figures. Figures from few tests can swing widely from year to year. No published CDC figure for 2018: Bristol County, MA; Norfolk County, MA; Worcester County, MA. Every Rhode Island county’s own figure is in the Rhode Island county table.
Measured: CDC tracking data. Figure above: 2018. Measured data period: 2005 to 2018 (every CDC figure on file).
Radon Action Brief
National Radon Action MonthPre-sale
Save 64%Sale price: $8.99Price after the sale: $25Ends Jan 31Then $25Sale ends January 31, then $25
Local help
Providence County, Local resources
Who tests and fixes radon in Providence County: listed businesses, Rhode Island's radon program and test kits.
This page lists Radon Testing businesses that are licensed by the Rhode Island Department of Health.
What it means
Providence County, Questions
In 2018, 1.9% of the radon tests reported to CDC for Providence County, Rhode Island were at or above 4 pCi/L, and the median reported pre-mitigation result was 0.6 pCi/L. That is a share of reported tests, not of homes. EPA places Providence County in Zone 2, moderate predicted potential, a predicted average indoor screening level 2 to 4 pCi/L. Homes with elevated levels occur in all three zones, so the figures describe the area, not your house. Testing is the only way to know the radon level in a specific building.
Radon levels: what a result meansWhat is radon?Radon levels in Rhode Island
EPA says you can test your home yourself or hire a qualified radon test company, and that either approach takes only a small amount of time and effort. No radon testing business listed on Radon411 has an address in Providence County or names it as a service area yet. The Rhode Island radon program is the place to ask about certified testers and any test kit offer it runs.
Radon testing: how to test a homeRadon test kits comparedFree and low-cost kits by stateRadon Action Month checklistRhode Island radon program
No listed mitigator names Providence County as a service area yet; the Rhode Island directory lists 35 companies. EPA recommends having a qualified contractor fix a home with a radon problem, because lowering high radon levels takes technical knowledge and special skills, and some states require the work to be done by a licensed or certified professional. Your state radon program is the place to check whether Rhode Island requires one.
Radon mitigation: how it worksRadon mitigation costRadon mitigation systemsMitigators in Rhode Island
EPA places Providence County, Rhode Island in Zone 2, which EPA describes as moderate predicted potential for the area. A zone is a prediction for the whole county and never determines whether a particular home should be tested. EPA recommends testing every home regardless of zone.
Yes. Testing is the only way to know the radon level in a specific building. EPA recommends fixing a home when the radon level is 4 pCi/L or higher. EPA recommends considering a fix when the level is between 2 and 4 pCi/L. How to test a home.
EPA says short-term tests stay in the home from 2 to 90 days and that all radon tests should run a minimum of 48 hours; long-term tests stay more than 90 days. EPA's guides do not name a best season: they say radon levels tend to vary from day to day and season to season, so a long-term test is more likely than a short-term test to tell you the year-round average.
EPA's Citizen's Guide calls testing easy and inexpensive, and EPA's Home Buyer's and Seller's Guide says passive short-term and long-term devices are generally inexpensive, while active devices may cost more. No national average price is published for this, so Radon411 does not give one. What testing costs.
Providence County borders 6 counties, derived from Census county geometry. Radon potential follows geology rather than county lines, so a bordering county's report can be relevant.
The reported-test figures on this page describe Providence County, Rhode Island in 2018. They describe tests other people carried out in other buildings, and none of them measures yours.
What the published data says about Providence County, in words. A zone and a share of tests describe an area, never the level in any one home.
EPA places Providence County in Zone 2, moderate predicted potential, as it does 1 other county of Rhode Island's 5.
Of the 6 bordering counties, EPA places Kent County and Worcester County, MA in Zone 1, Bristol County, MA, Norfolk County, MA and Windham County, CT in Zone 2 and Bristol County in Zone 3.
CDC has annual figures for Providence County for 5 years, 2014 to 2018. In 2018, 1.9% of 108 reported tests were at or above 4 pCi/L.
Across those years the share ranged from 0.0% (2015) to 2.6% (2017). Few tests in a year can move it a long way.
Rhode Island's radon program is the Radon Control Program, run by Rhode Island Department of Health; its contacts are under Local resources.
The county's largest incorporated places are Providence, Cranston and Pawtucket; the figures here cover them as part of the county.
Products
Providence County, Products
Whatever the figures for Providence County show, only a test tells you about one home.
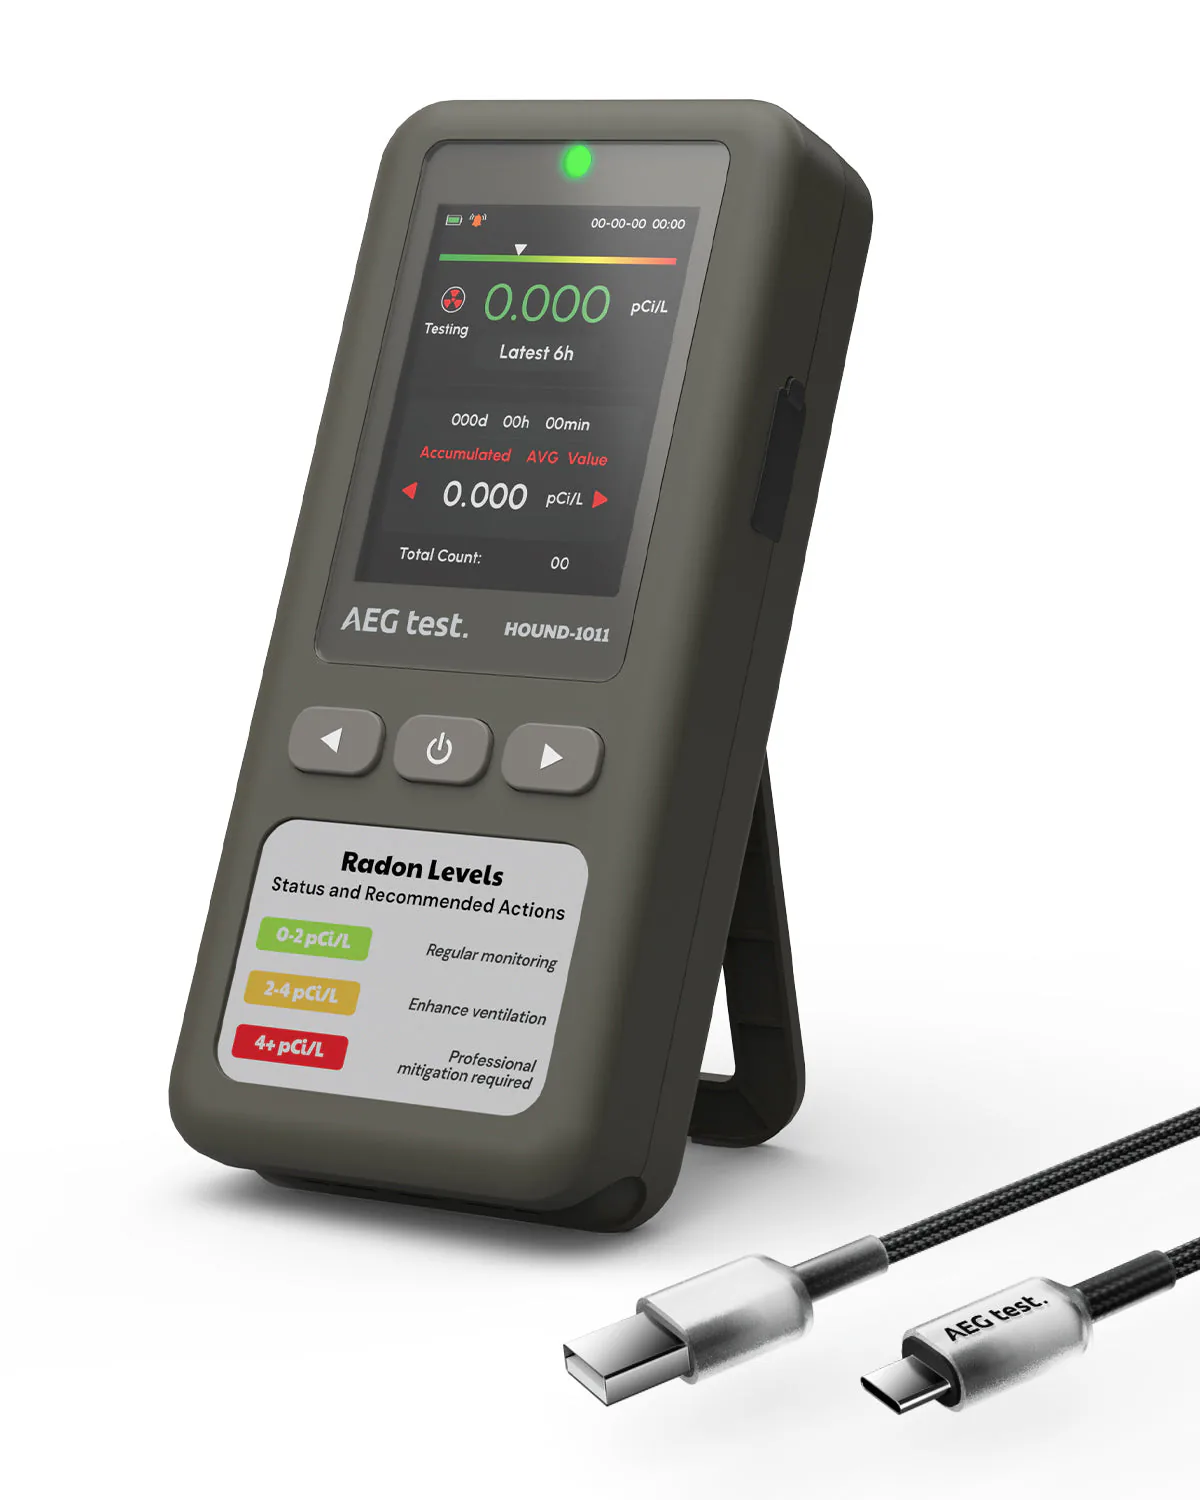
MonitorAEGTEST
Method: Semiconductor sensor
First reading: Within 6 hours
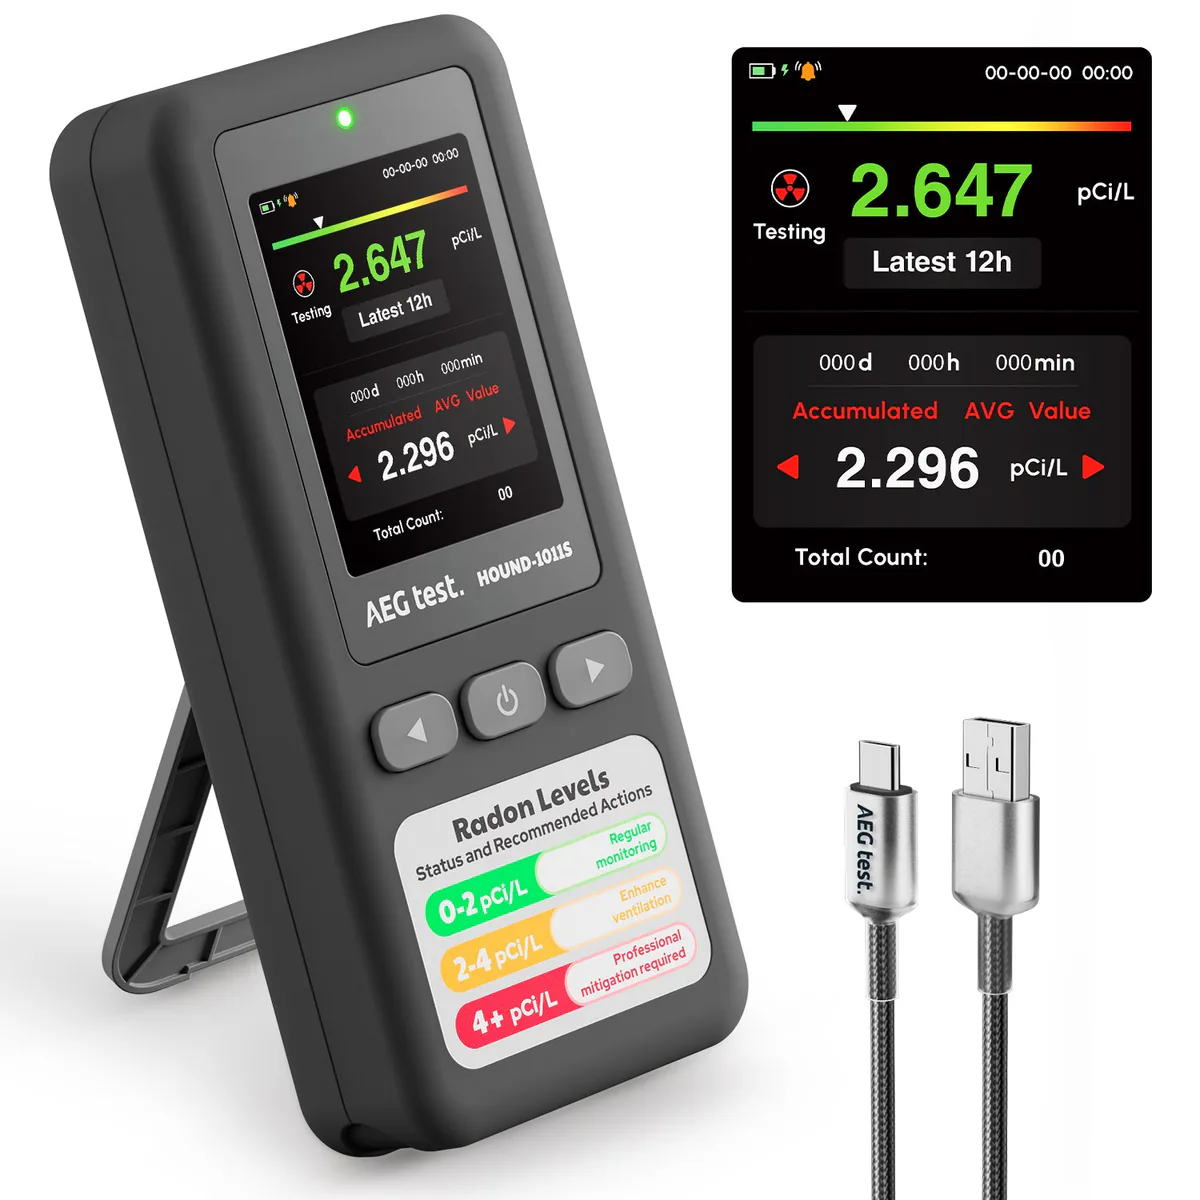
MonitorAEGTEST
Method: Semiconductor sensor
First reading: Within 12 hours
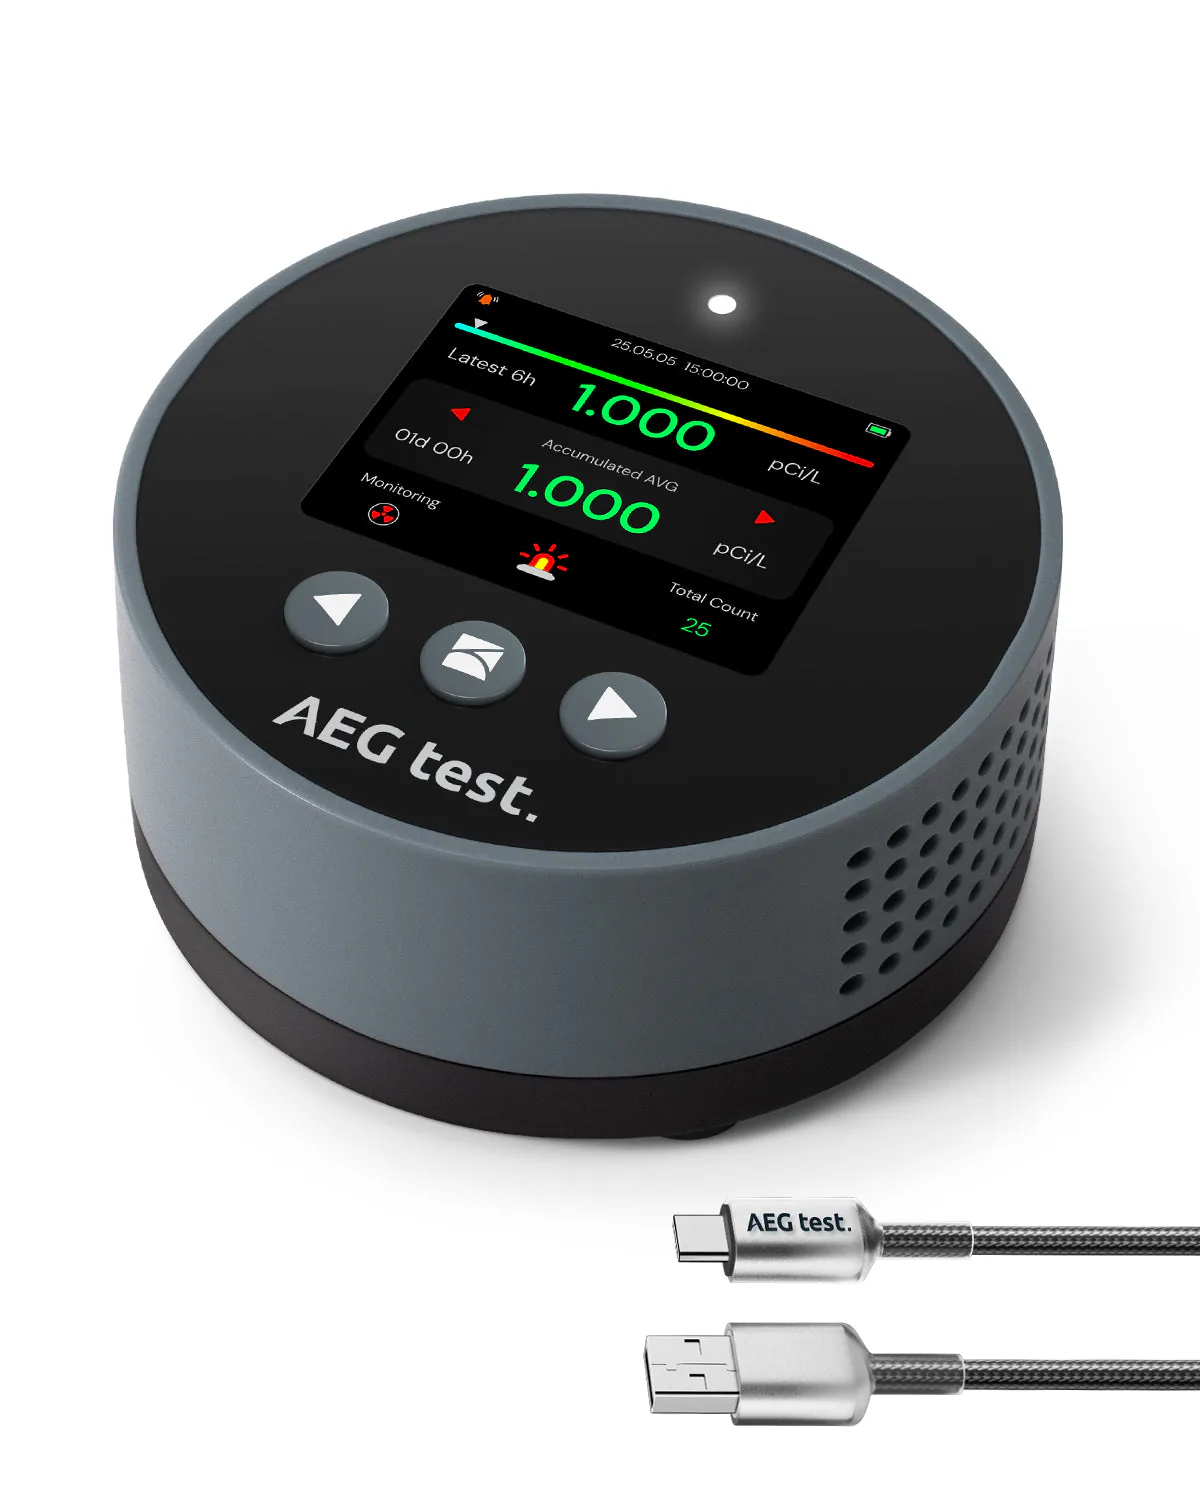
MonitorAEGTEST
Method: Semiconductor sensor
First reading: Within 6 hours
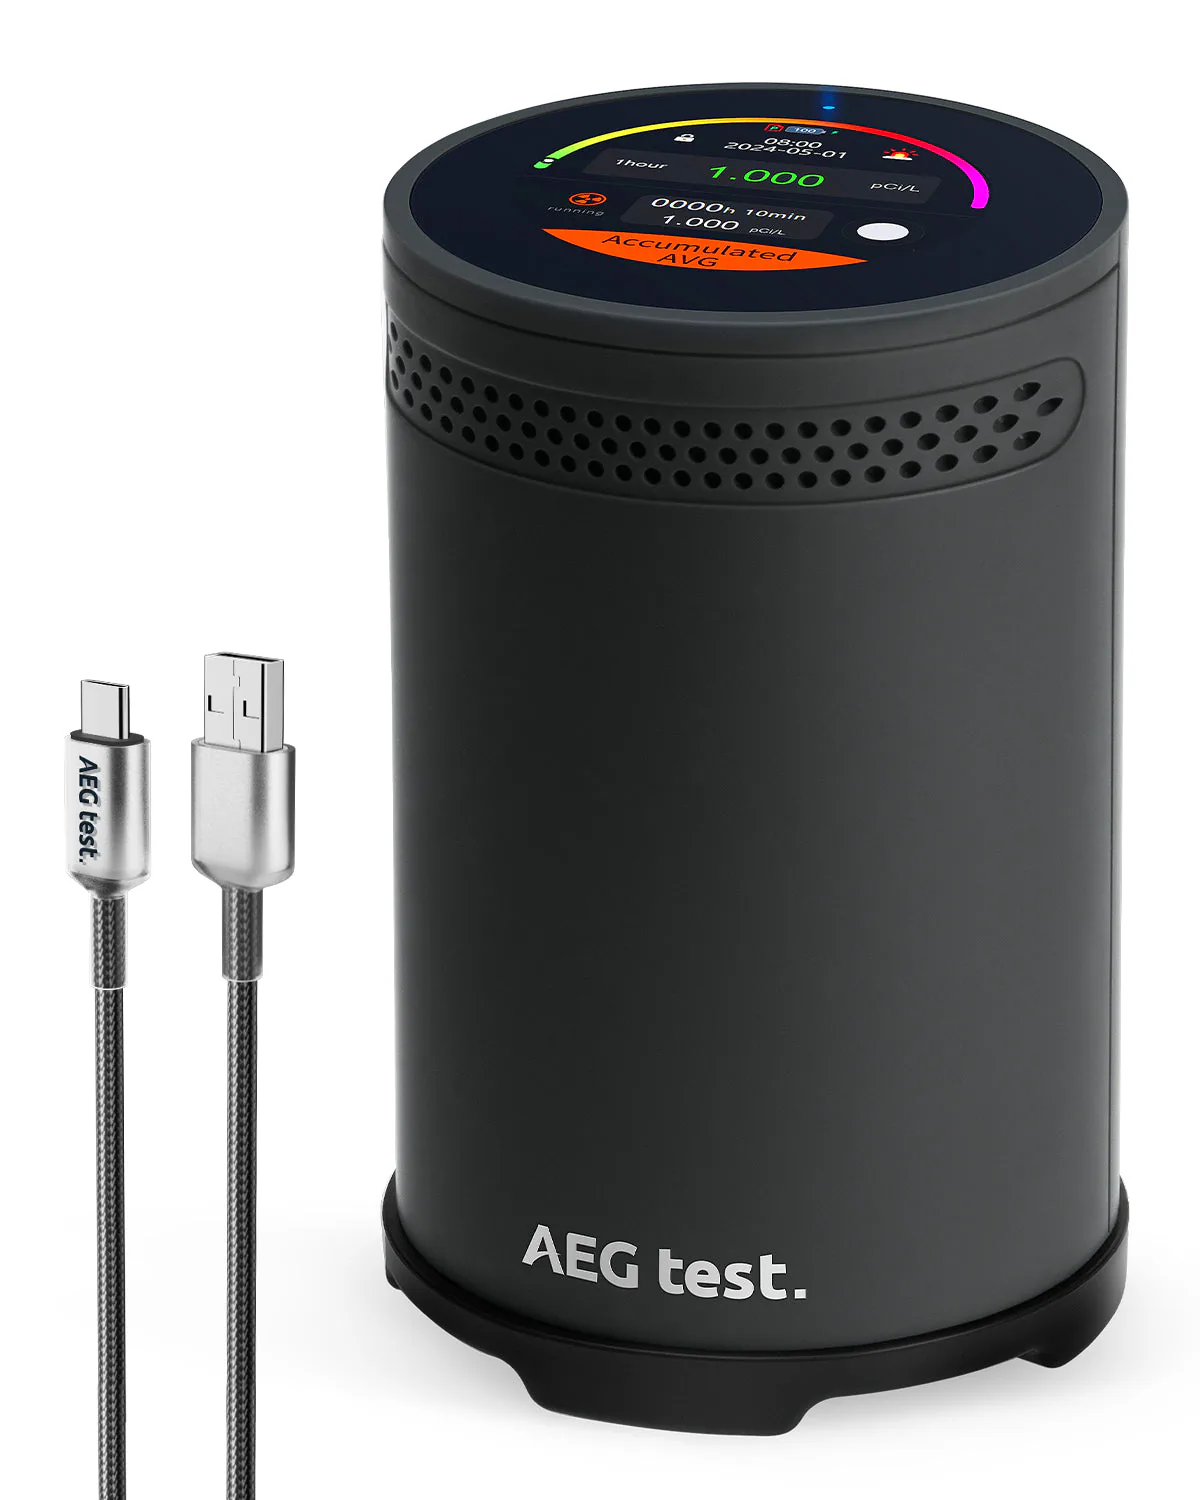
MonitorAEGTEST
First reading: Within 1 hour
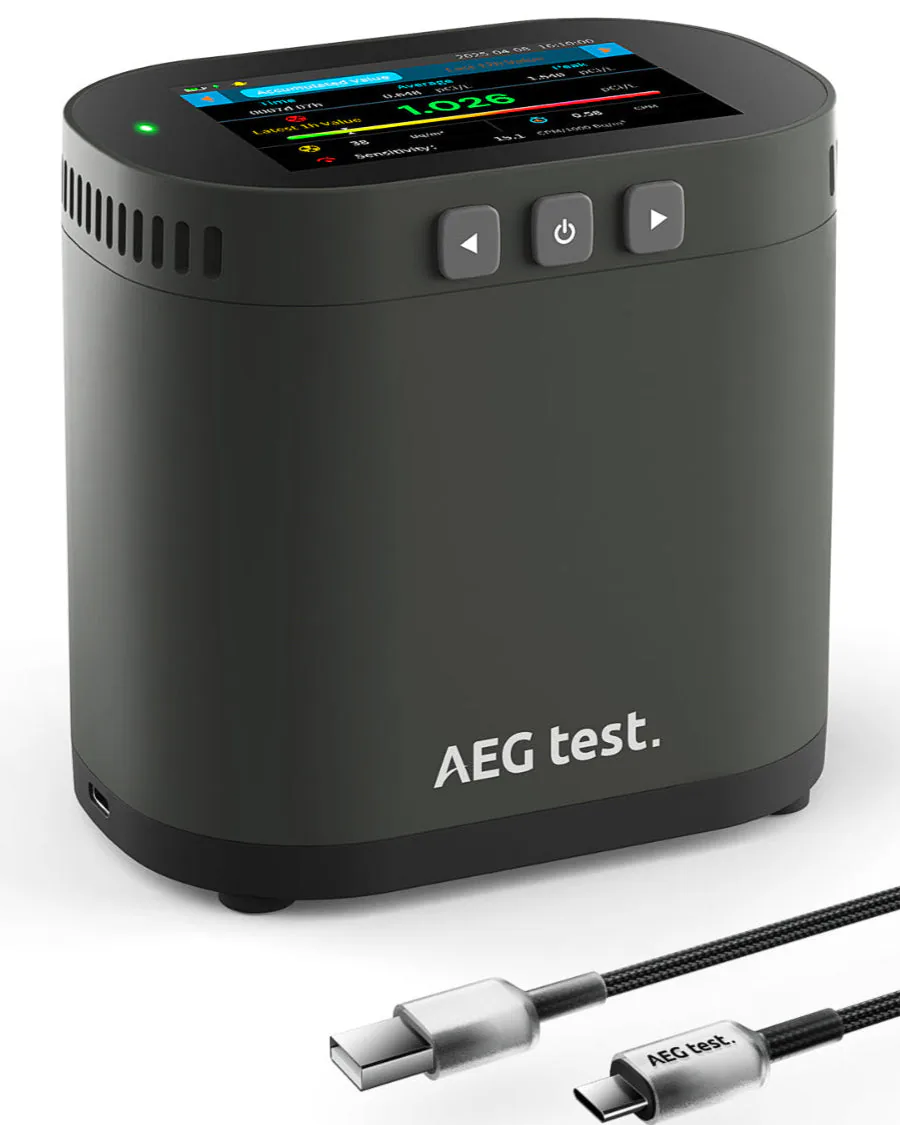
MonitorAEGTEST
Method: Ion chamber
First reading: Within 10 minutes
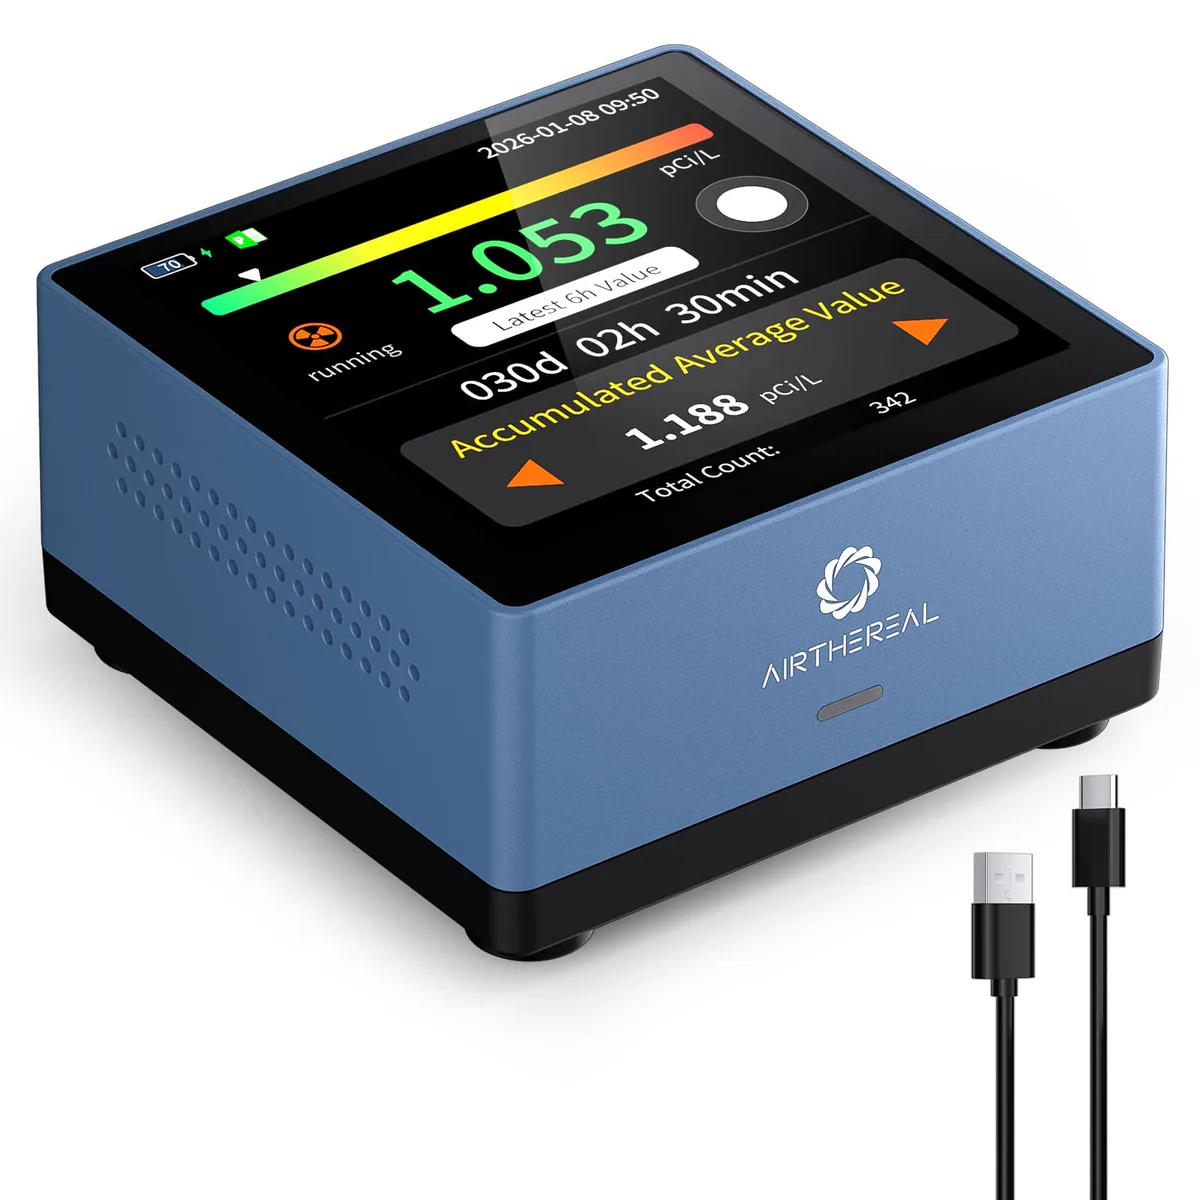
Monitor
Method: Semiconductor sensor
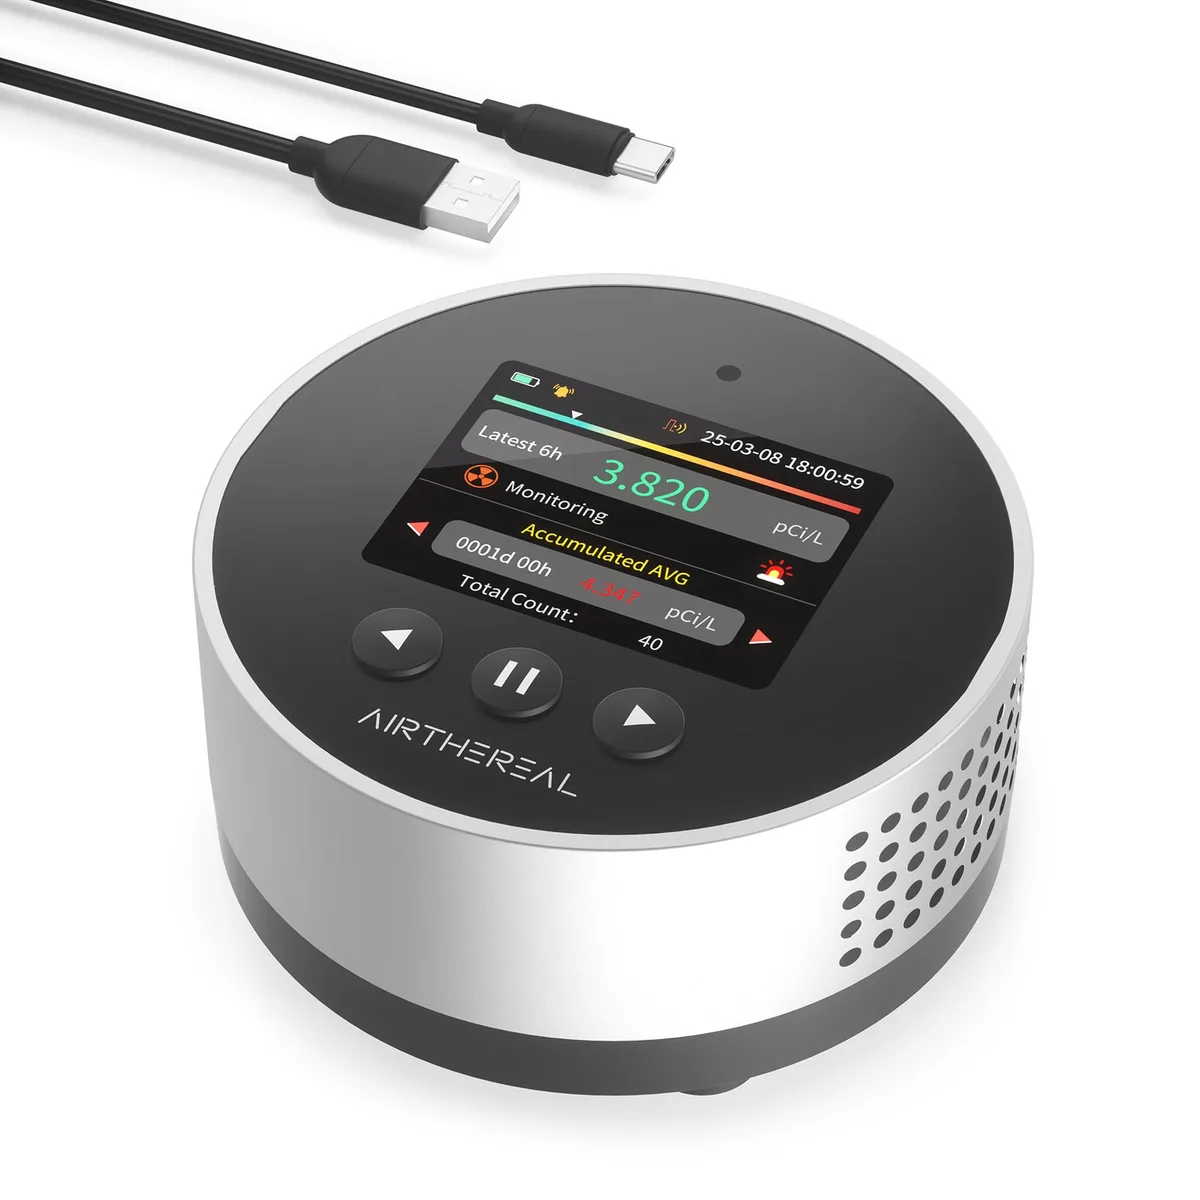
Monitor
Method: Semiconductor sensor
First reading: Within 6 hours
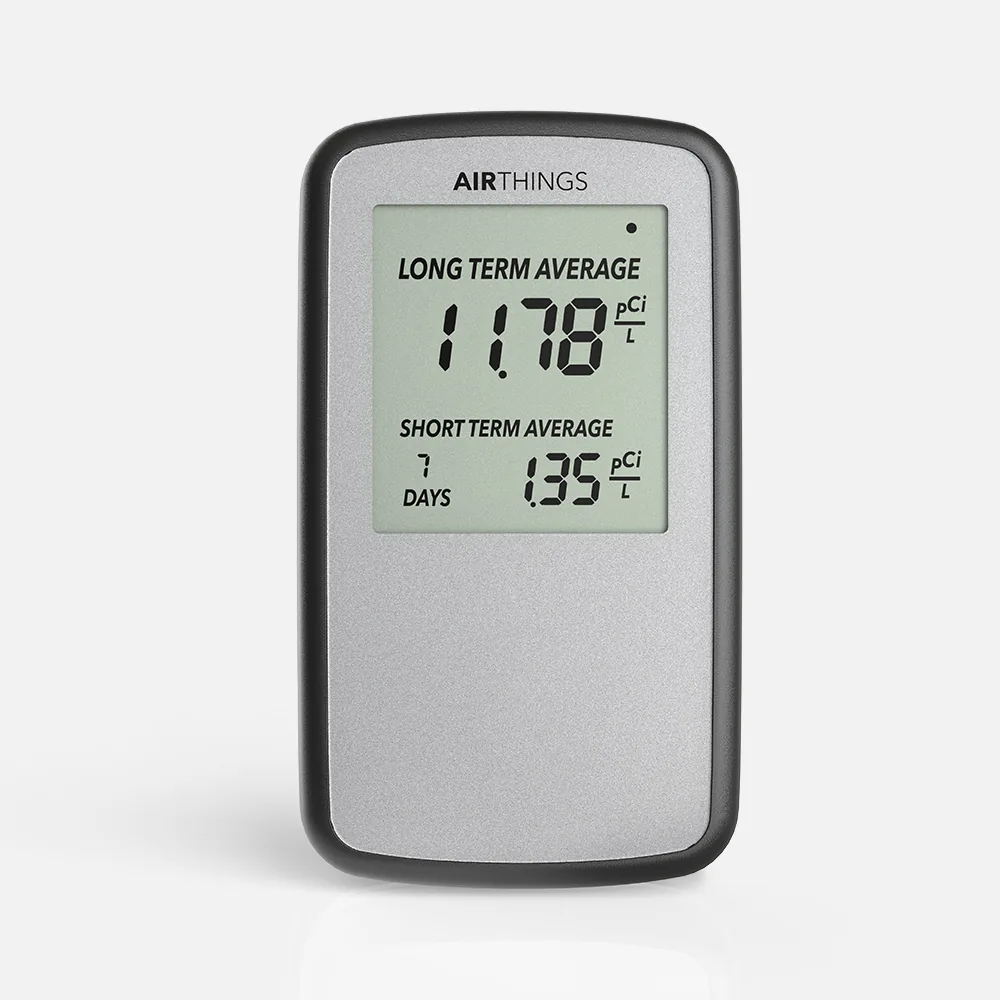
Monitor
Method: Alpha spectrometry
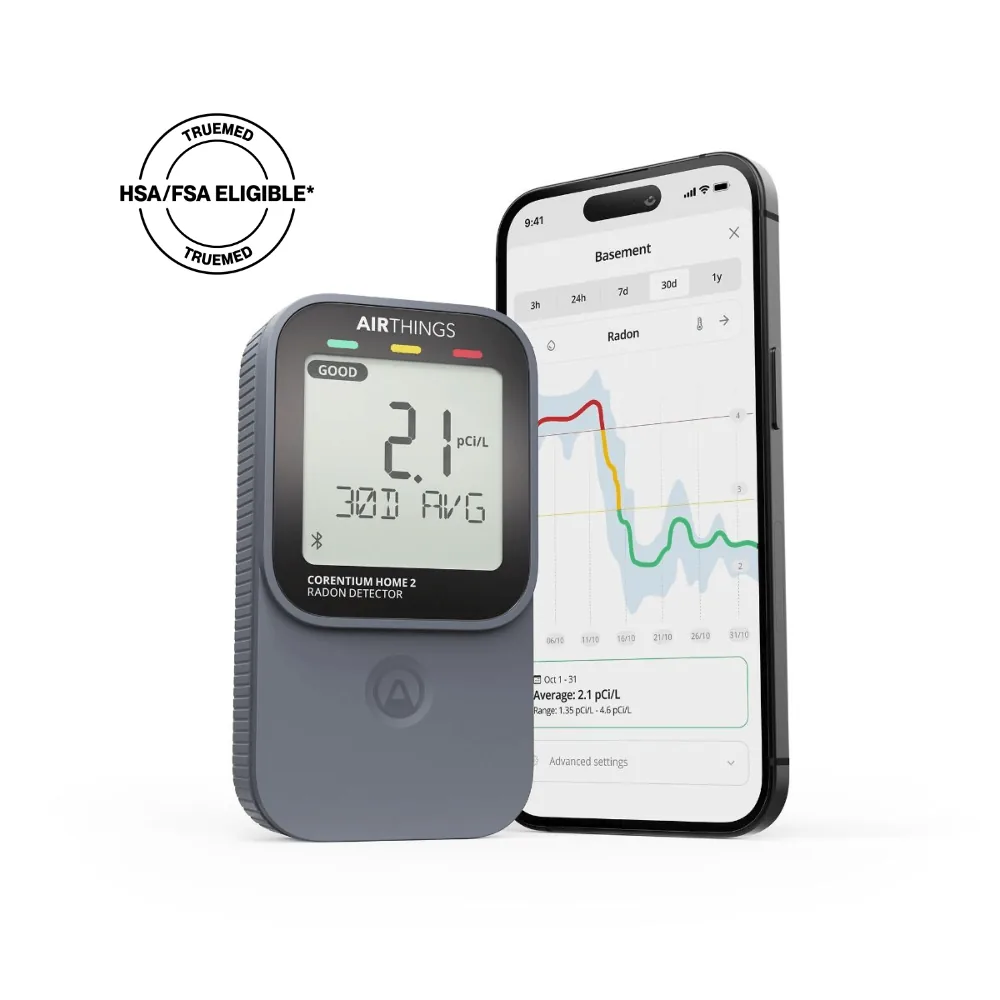
Monitor
Method: Alpha spectrometry
Readings: Every 60 minutes
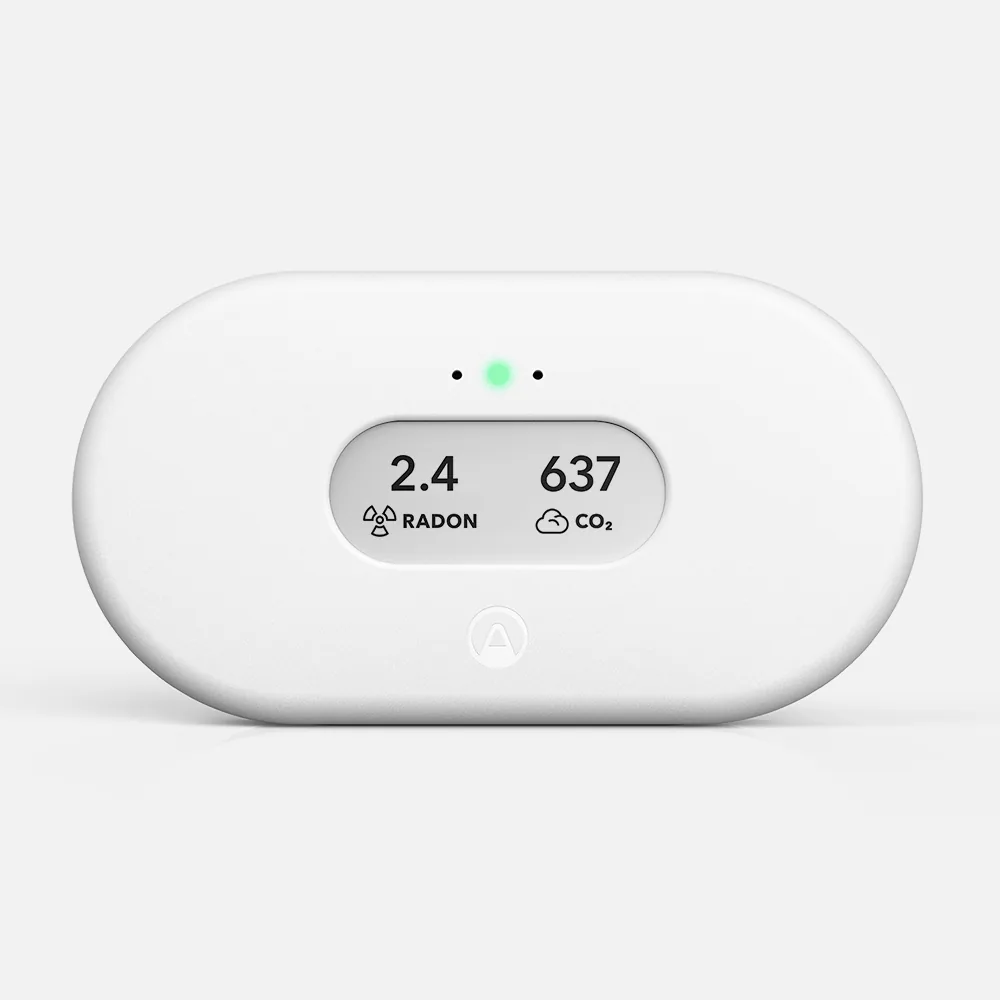
Monitor
Method: Alpha spectrometry
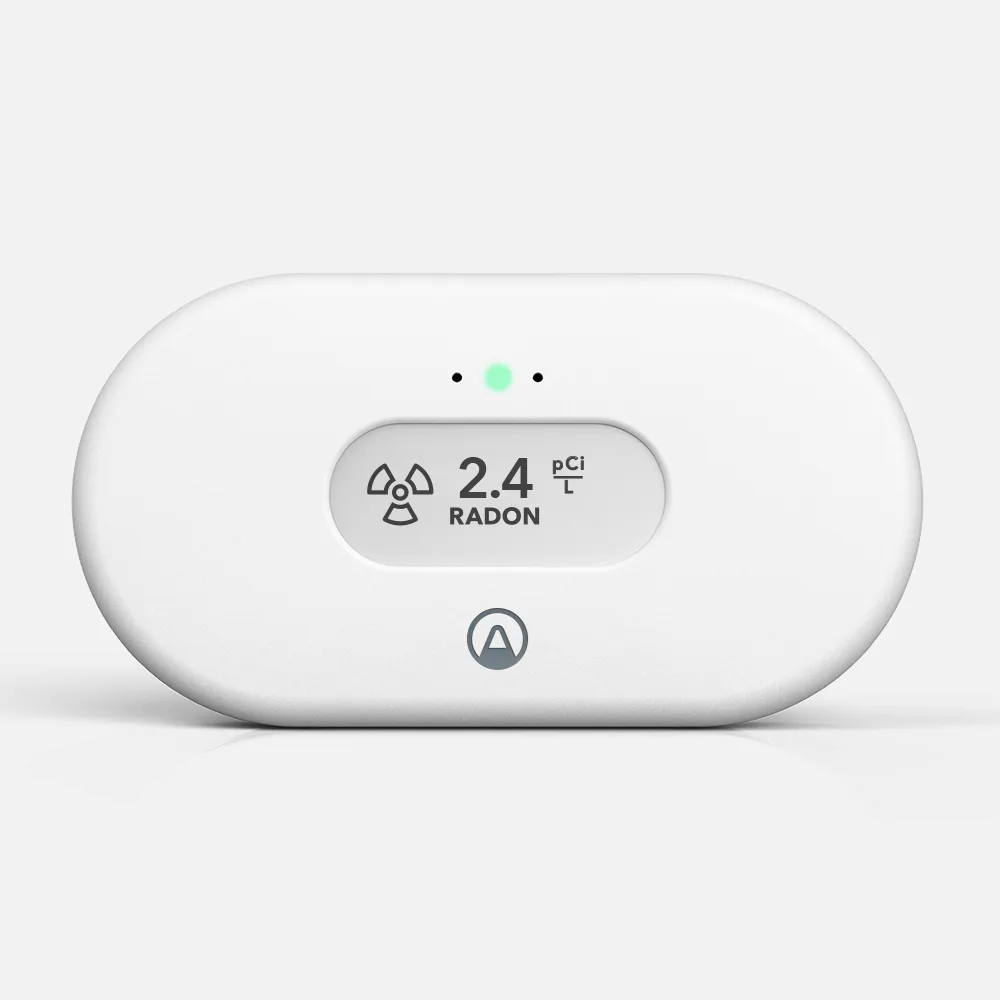
Monitor
Method: Alpha spectrometry
Readings: Every 60 minutes
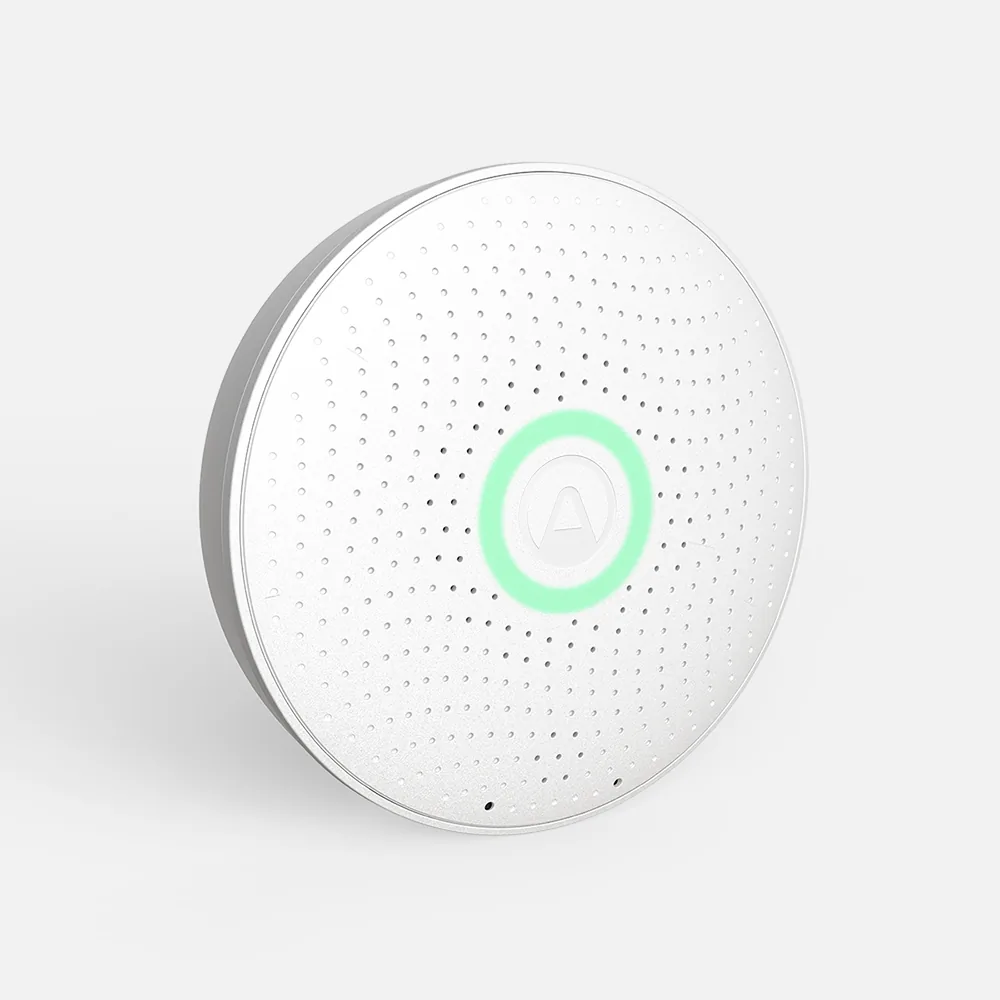
Monitor
Method: Alpha spectrometry
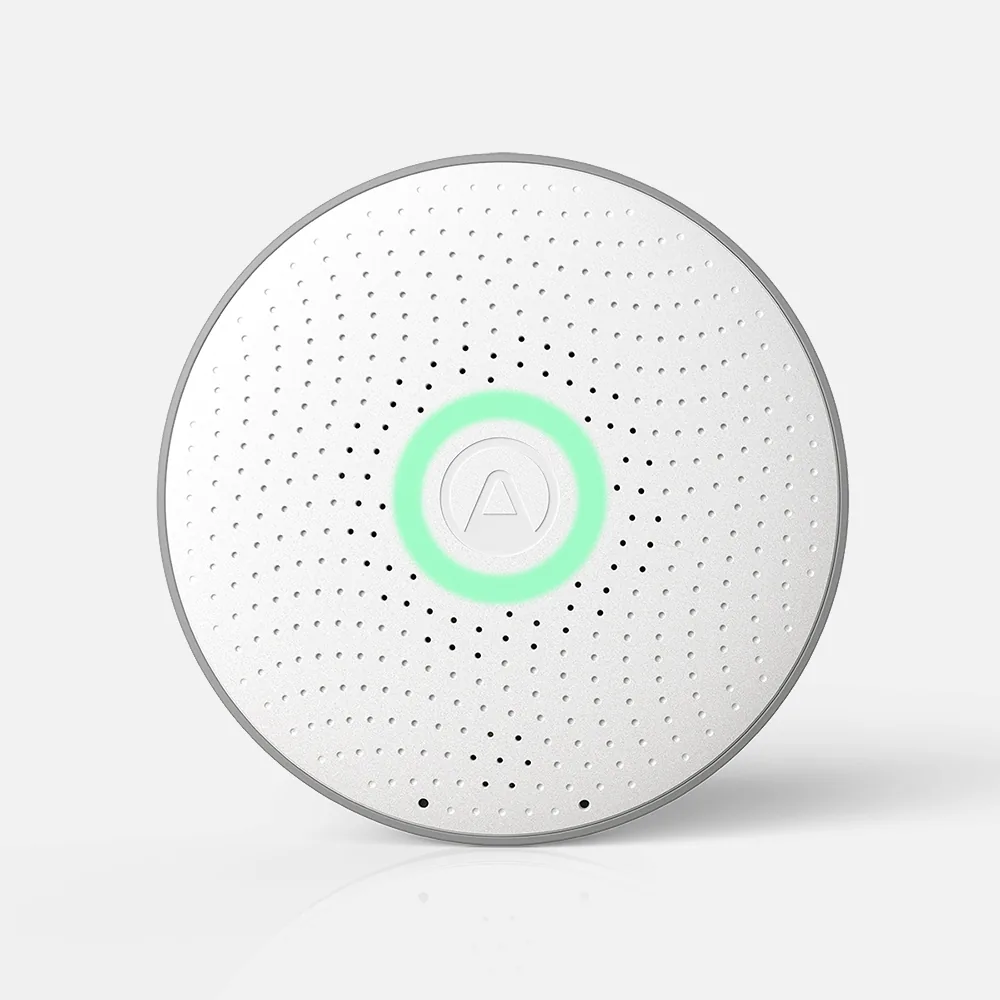
Monitor
Method: Alpha spectrometry
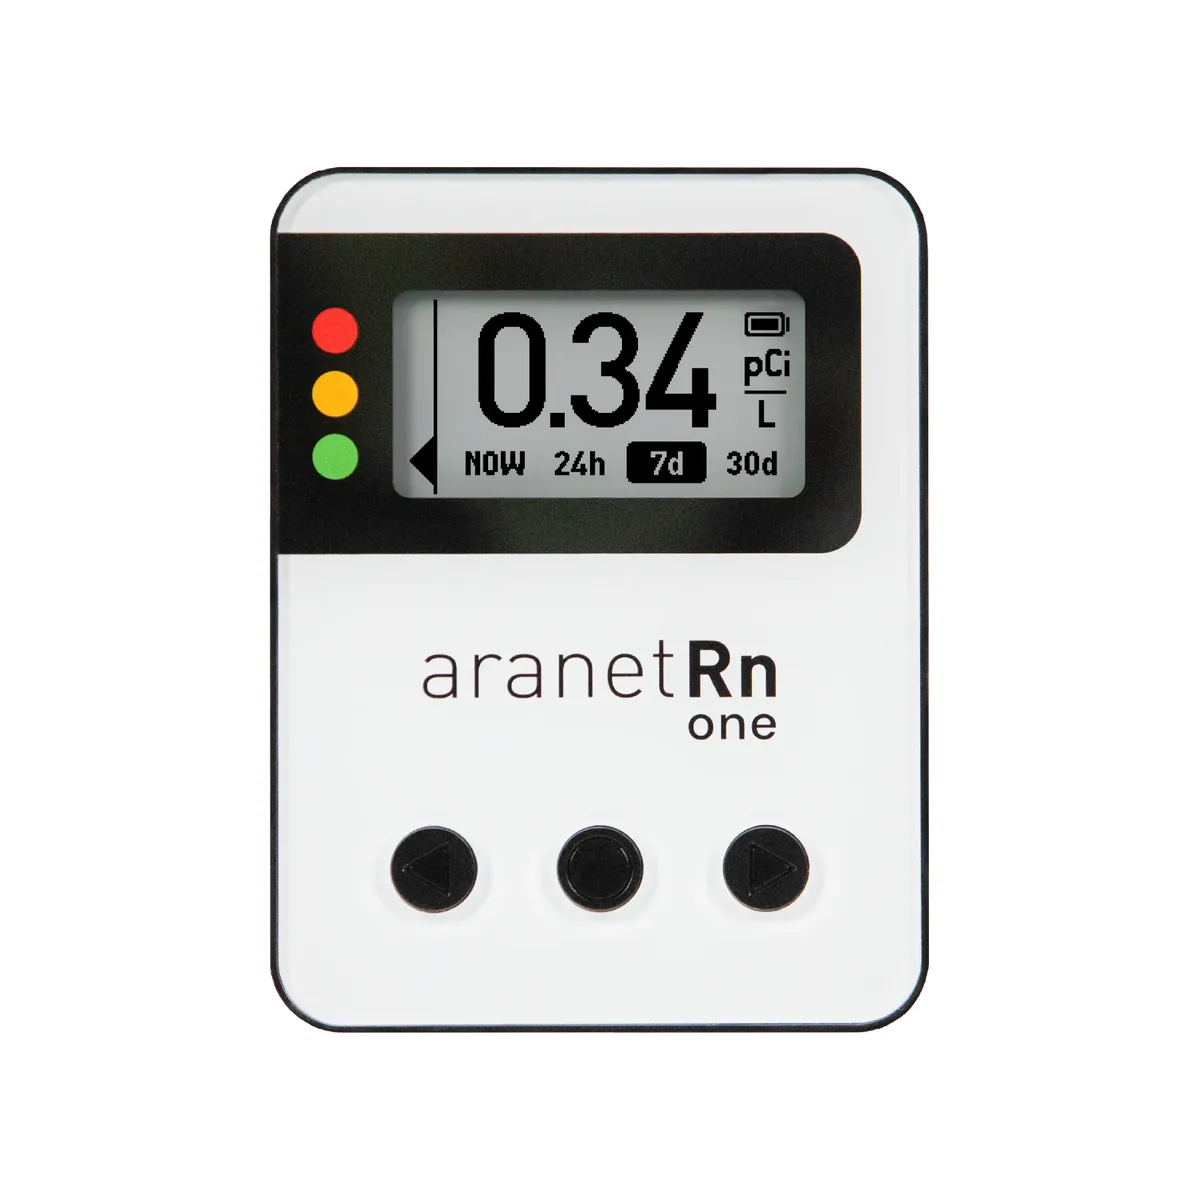
MonitorAranet
Method: Ion chamber
First reading: Within 10 minutes
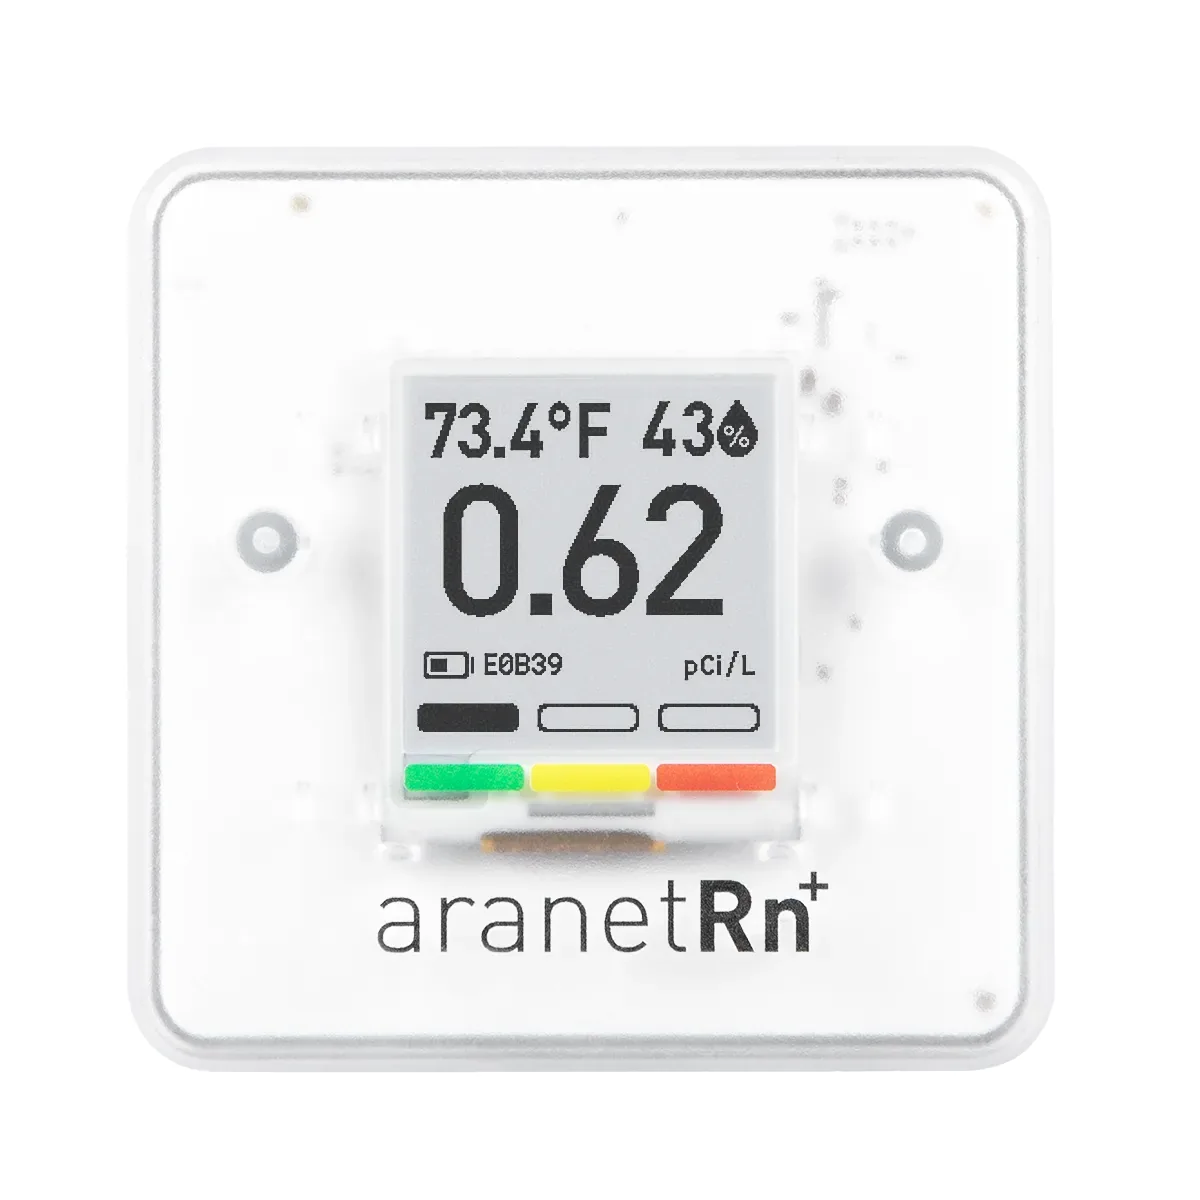
MonitorAranet
Method: Ion chamber
First reading: Within 10 minutes
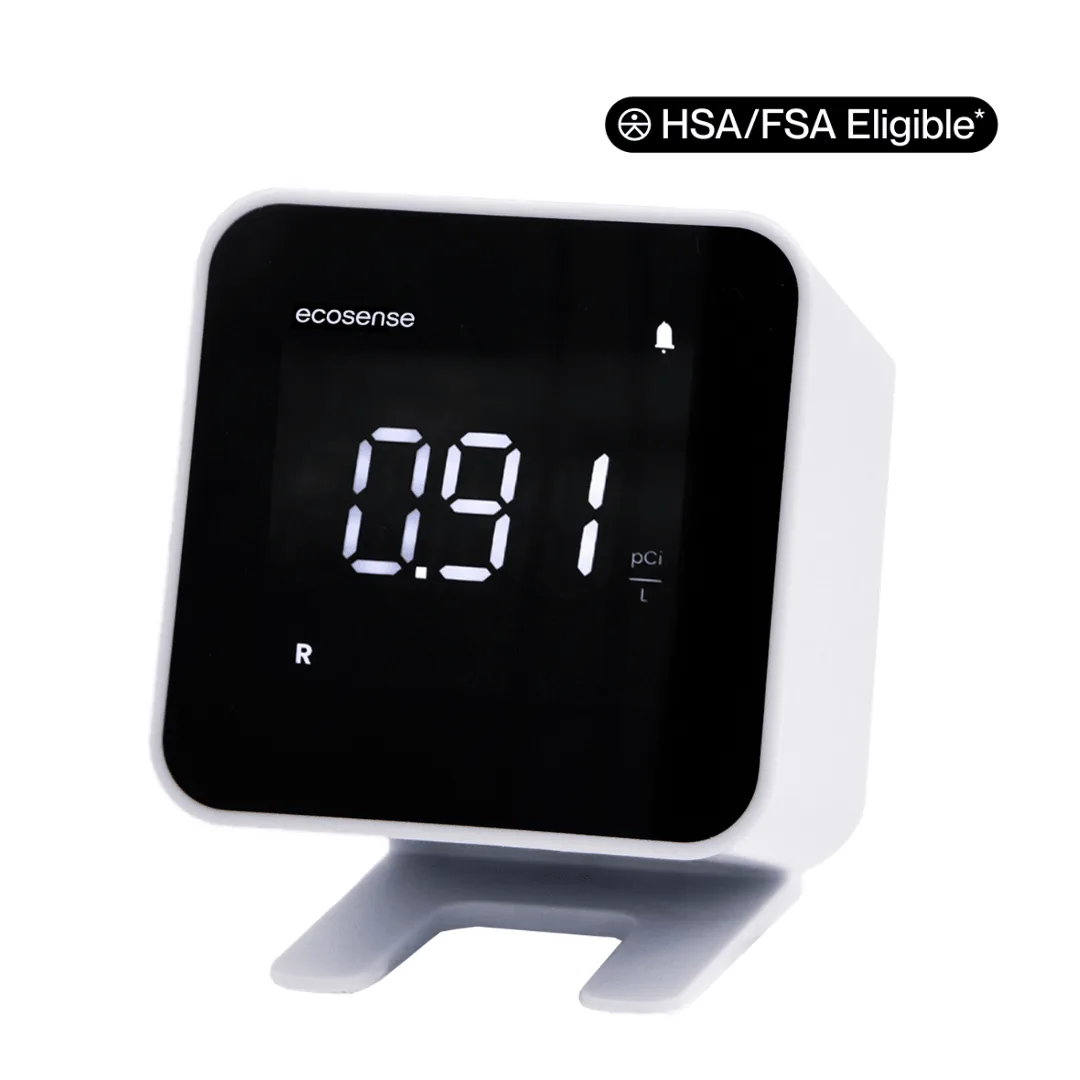
Monitor
Method: Ion chamber
First reading: Within 10 minutes
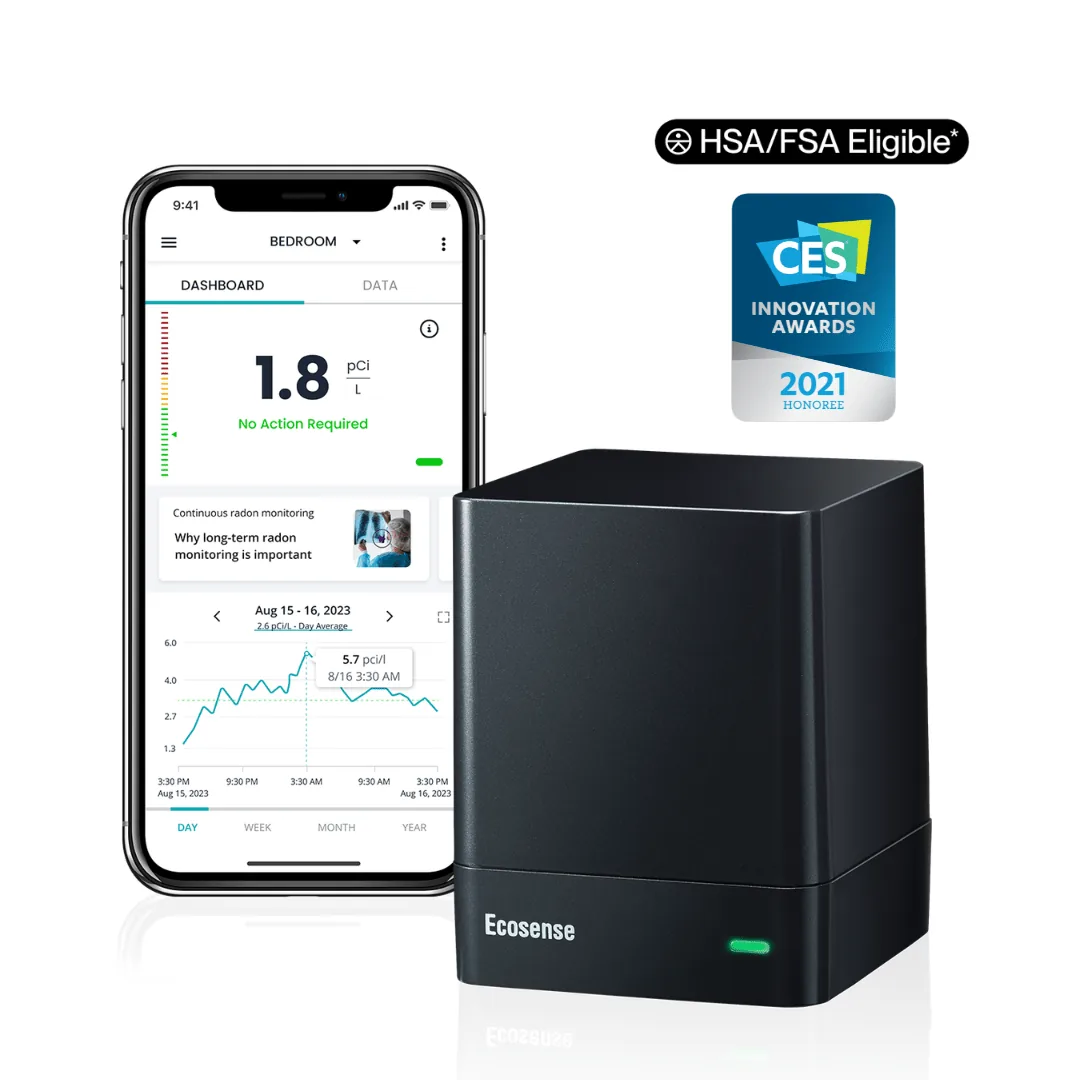
Monitor
Method: Ion chamber
First reading: Within 10 minutes
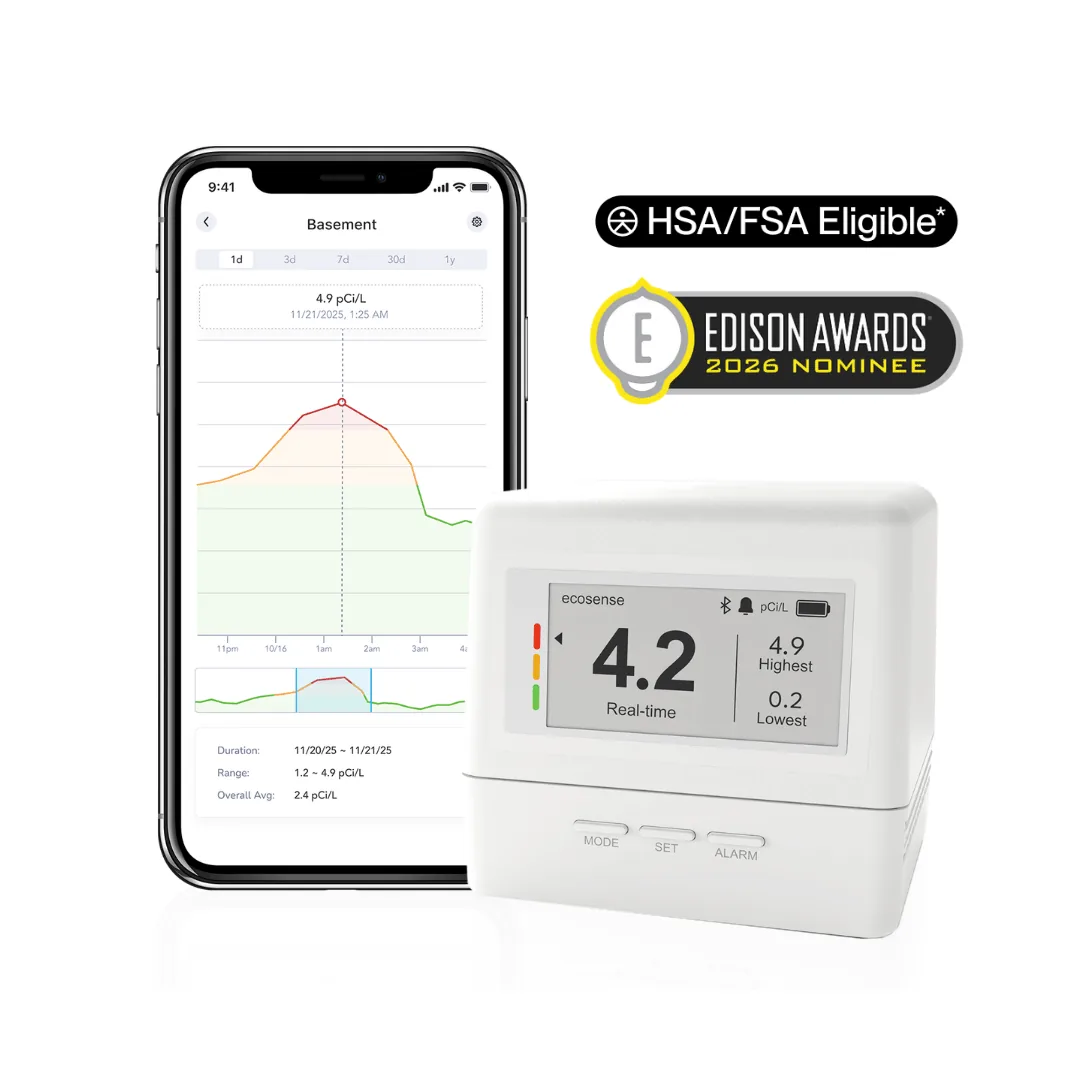
Monitor
Method: Ion chamber
First reading: Within 15 minutes
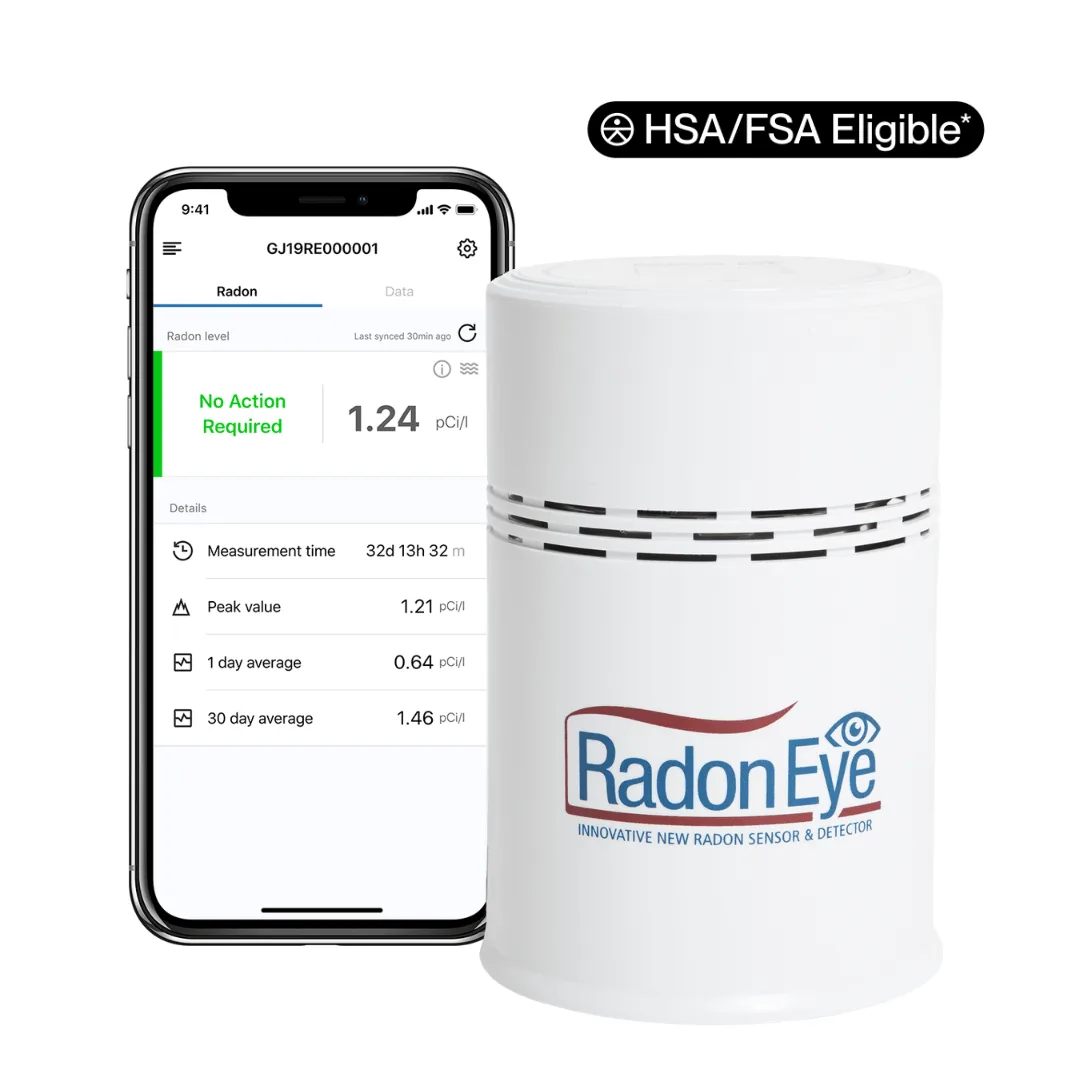
Monitor
Method: Ion chamber
First reading: Within 10 minutes
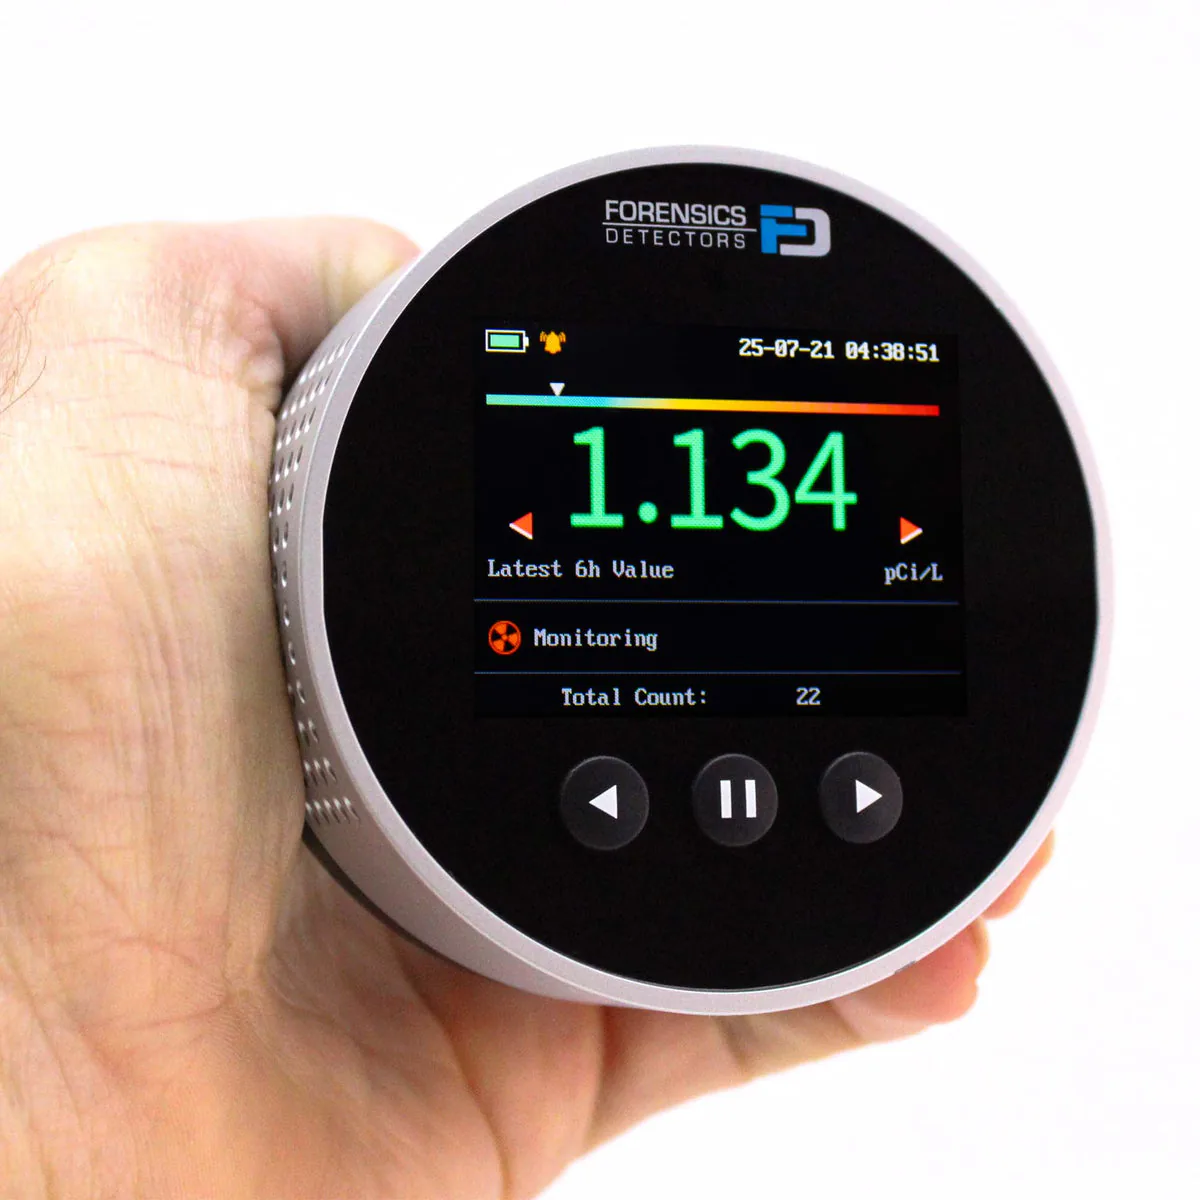
MonitorForensics Detectors
Method: Semiconductor sensor
First reading: Within 6 hours
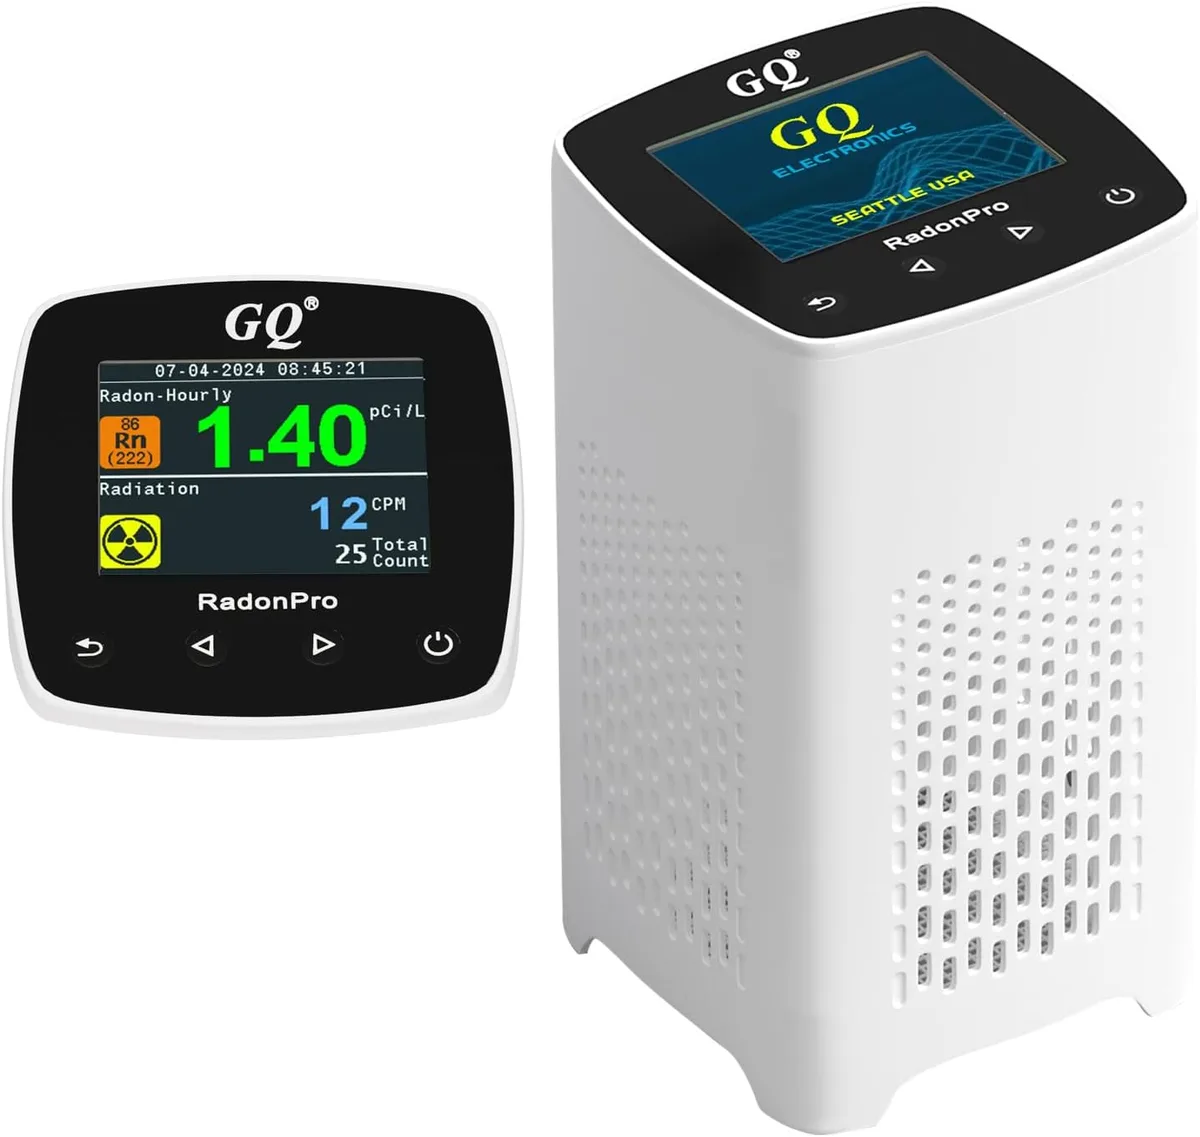
Monitor
First reading: Within 5 minutes
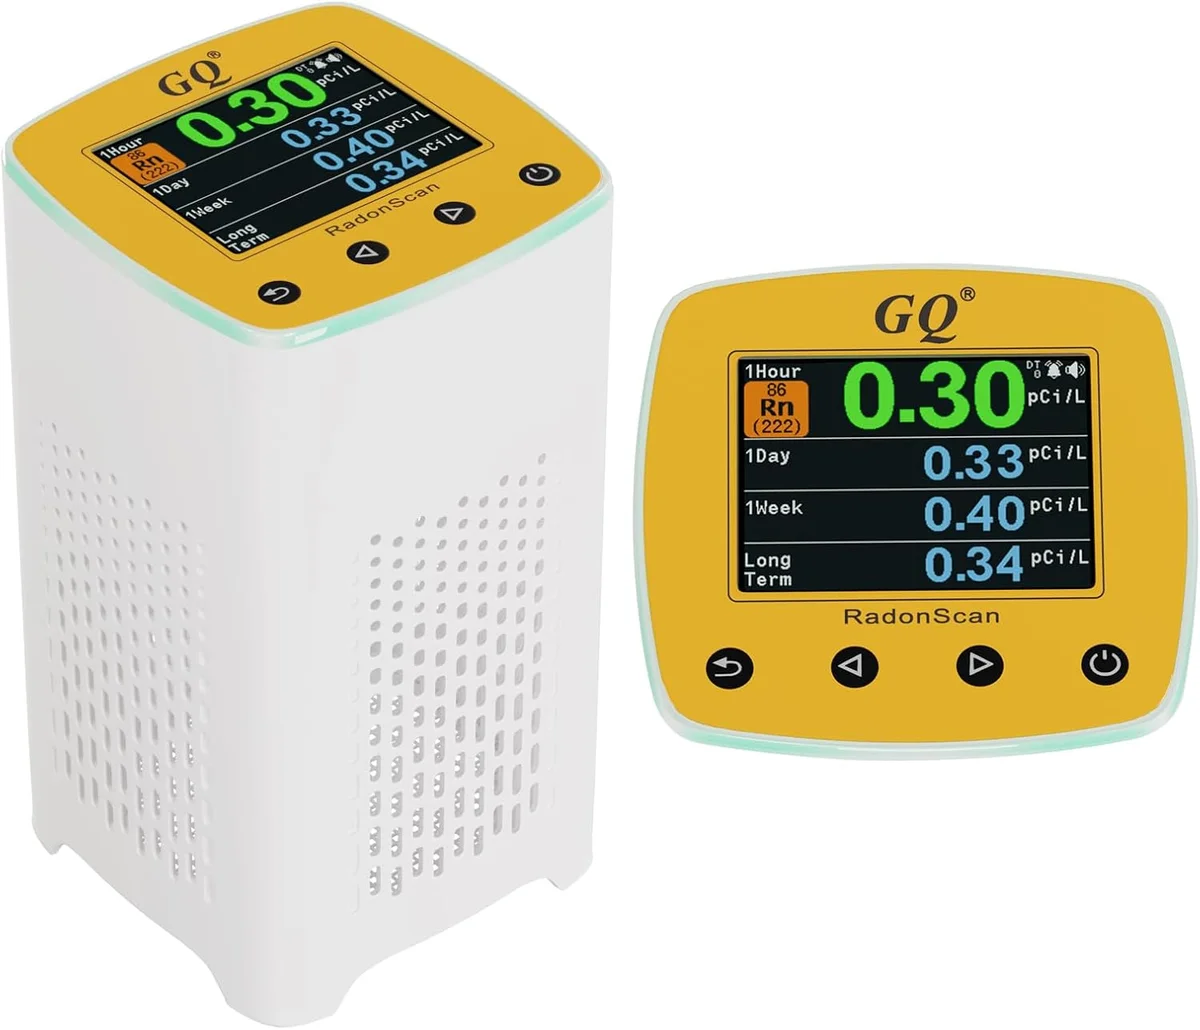
Monitor
First reading: Within 5 minutes
Monitor
First reading: Within 5 minutes
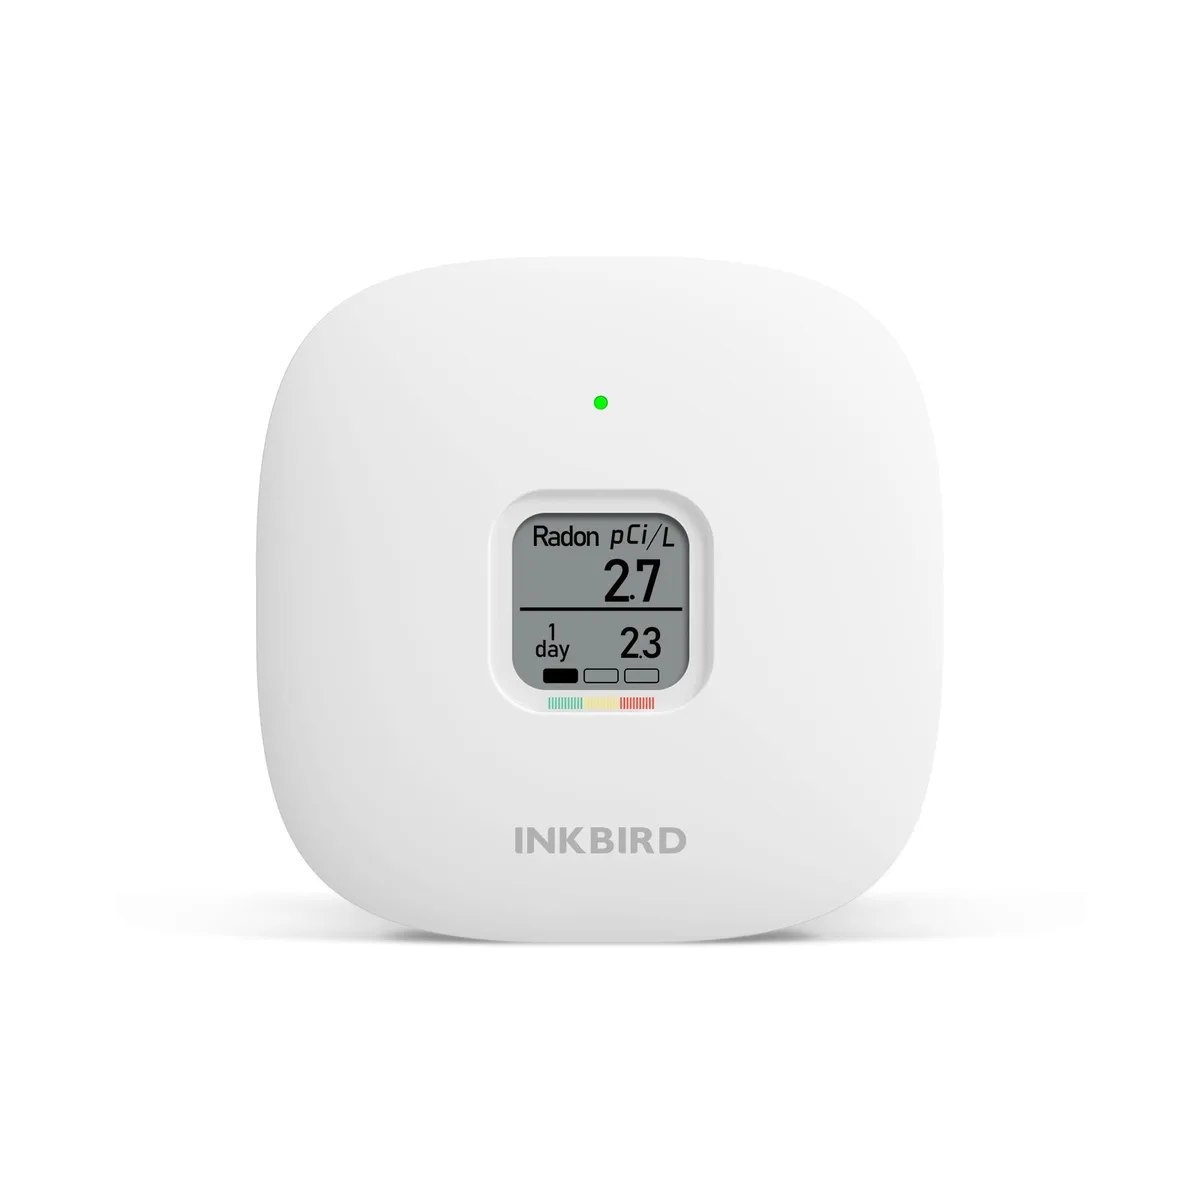
MonitorINKBIRD
First reading: Within 24 hours
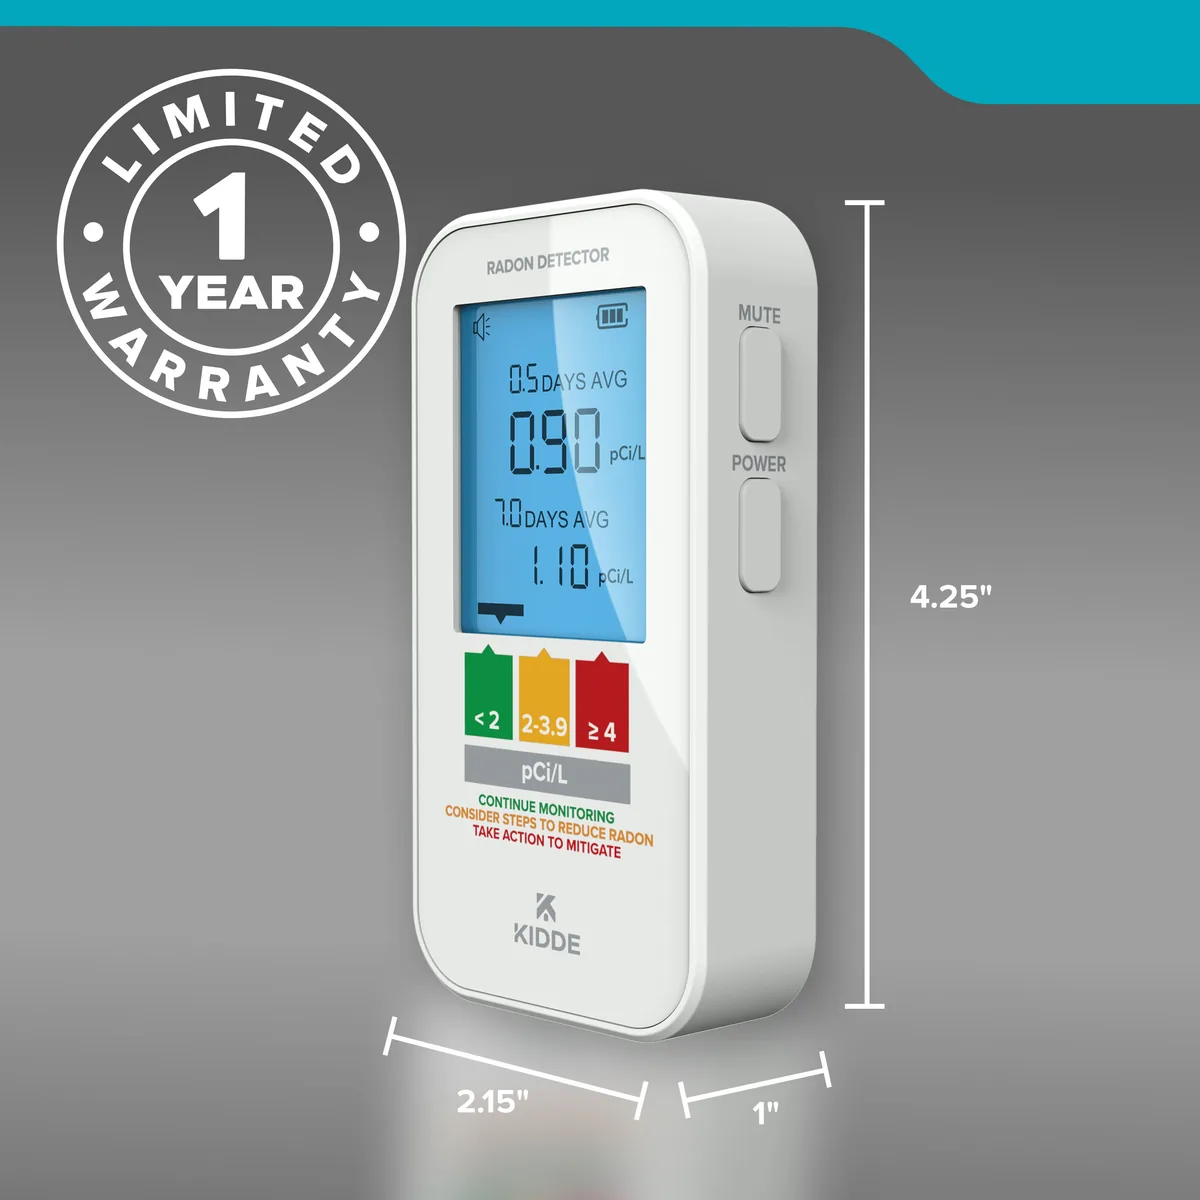
MonitorKidde
Method: Semiconductor sensor
First reading: Within 12 hours
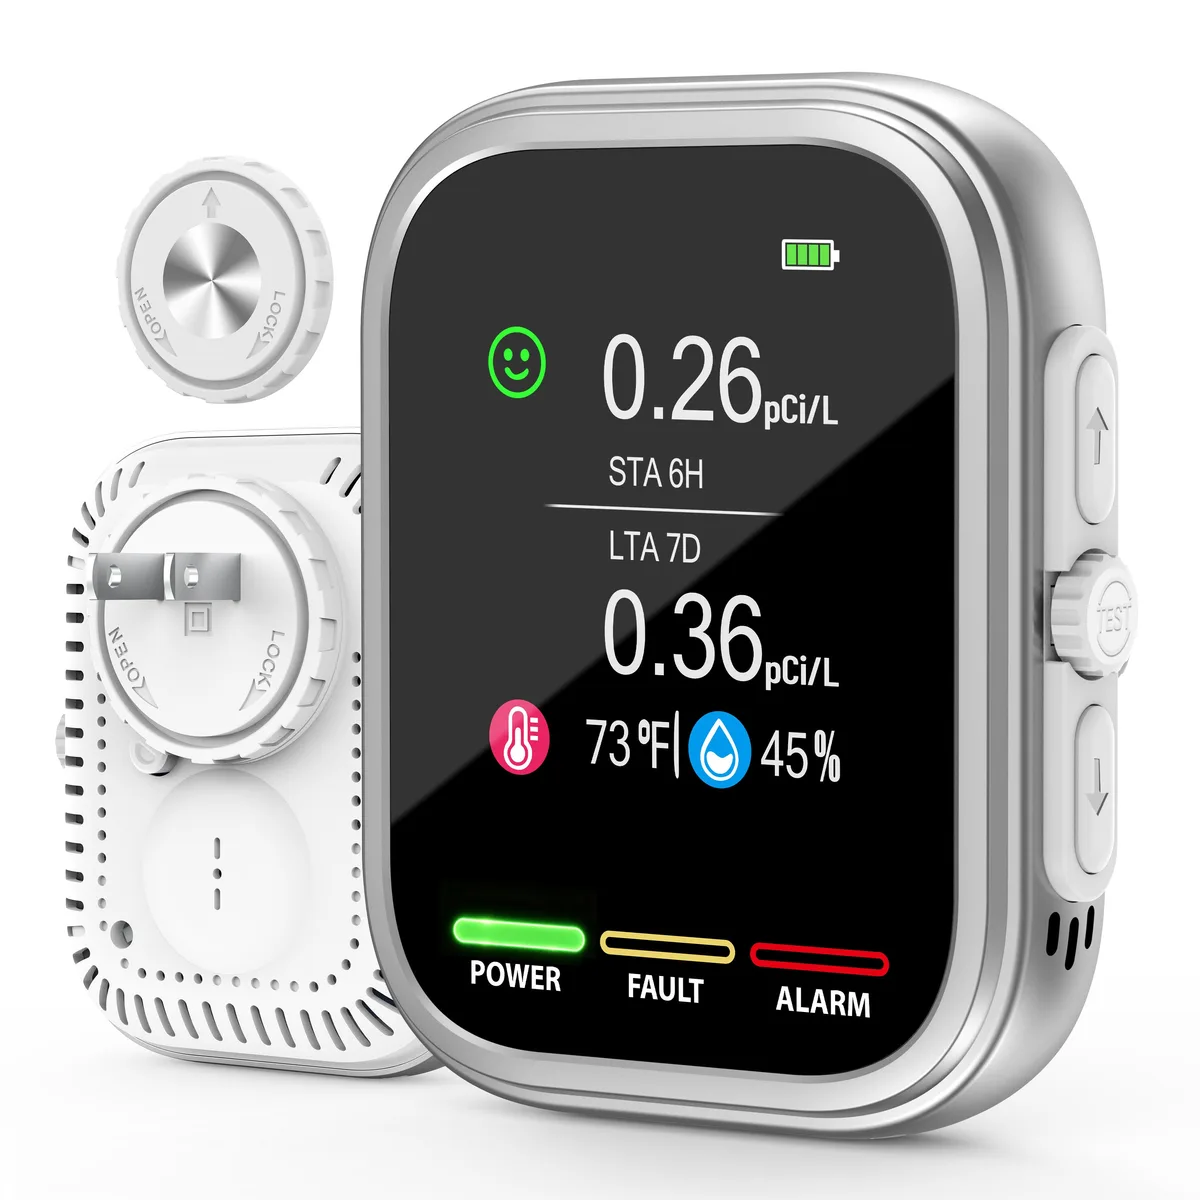
MonitorPYZYCKYH
Method: Semiconductor sensor
First reading: Within 6 hours
MonitorSafetySiren
First reading: Within 48 hours
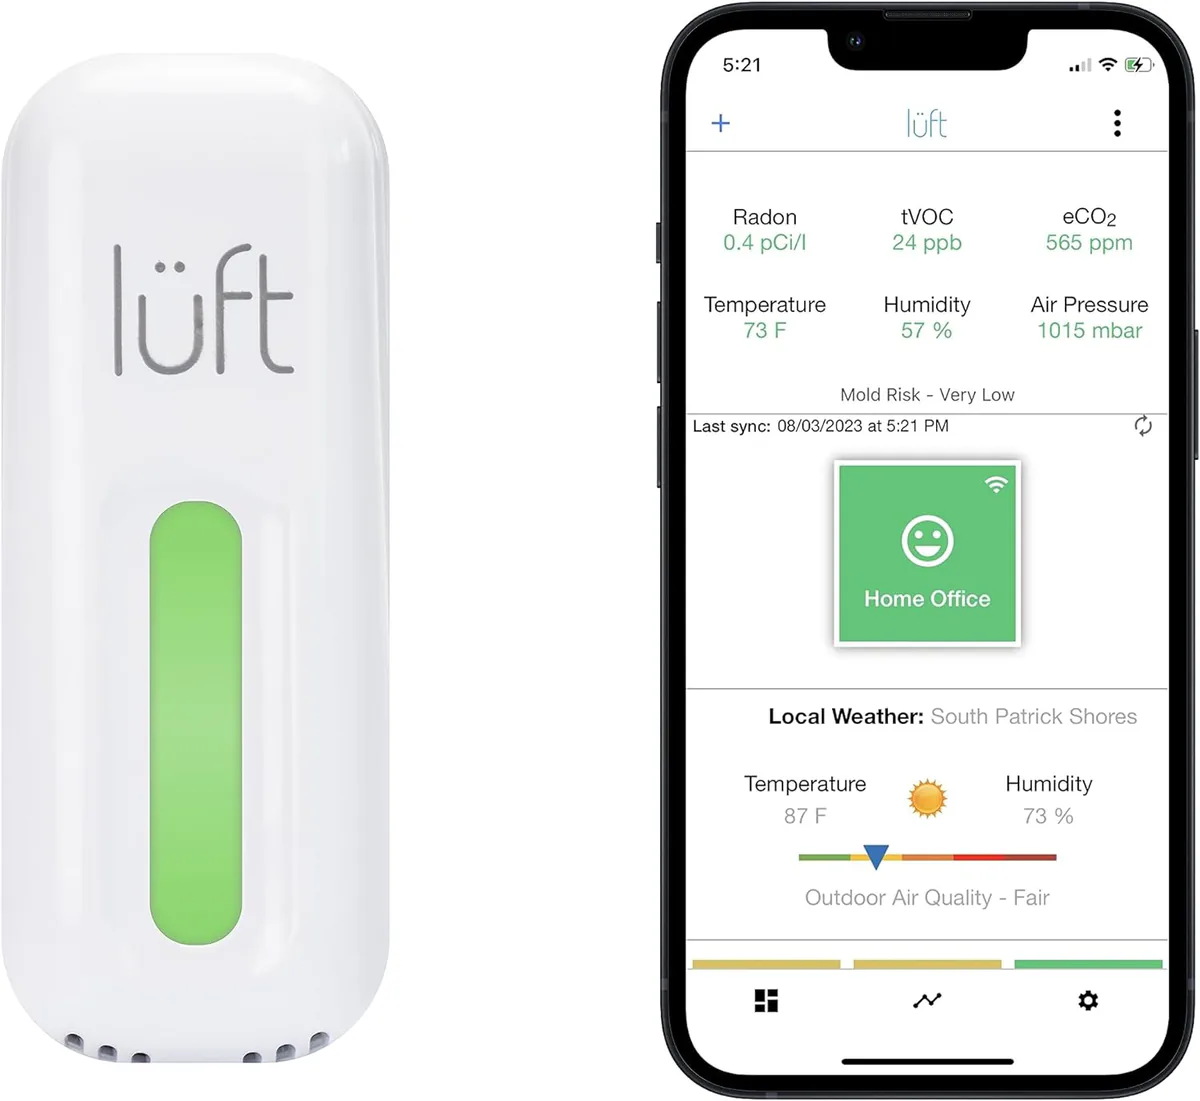
Monitor
First reading: Within 90 minutes
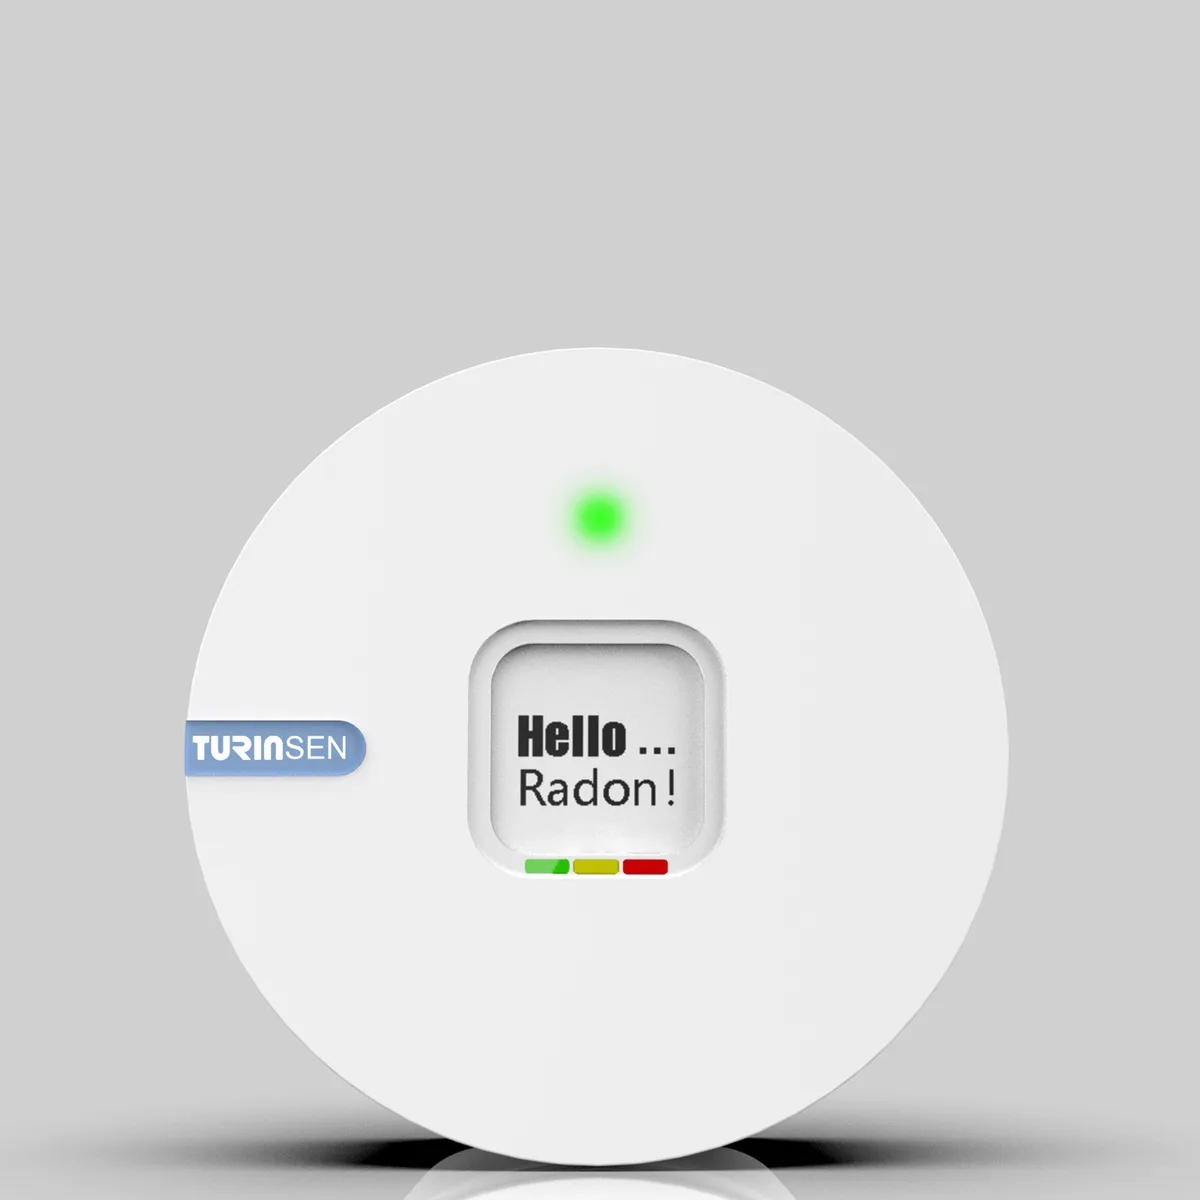
Monitor
Method: Alpha spectrometry
First reading: Within 24 hours
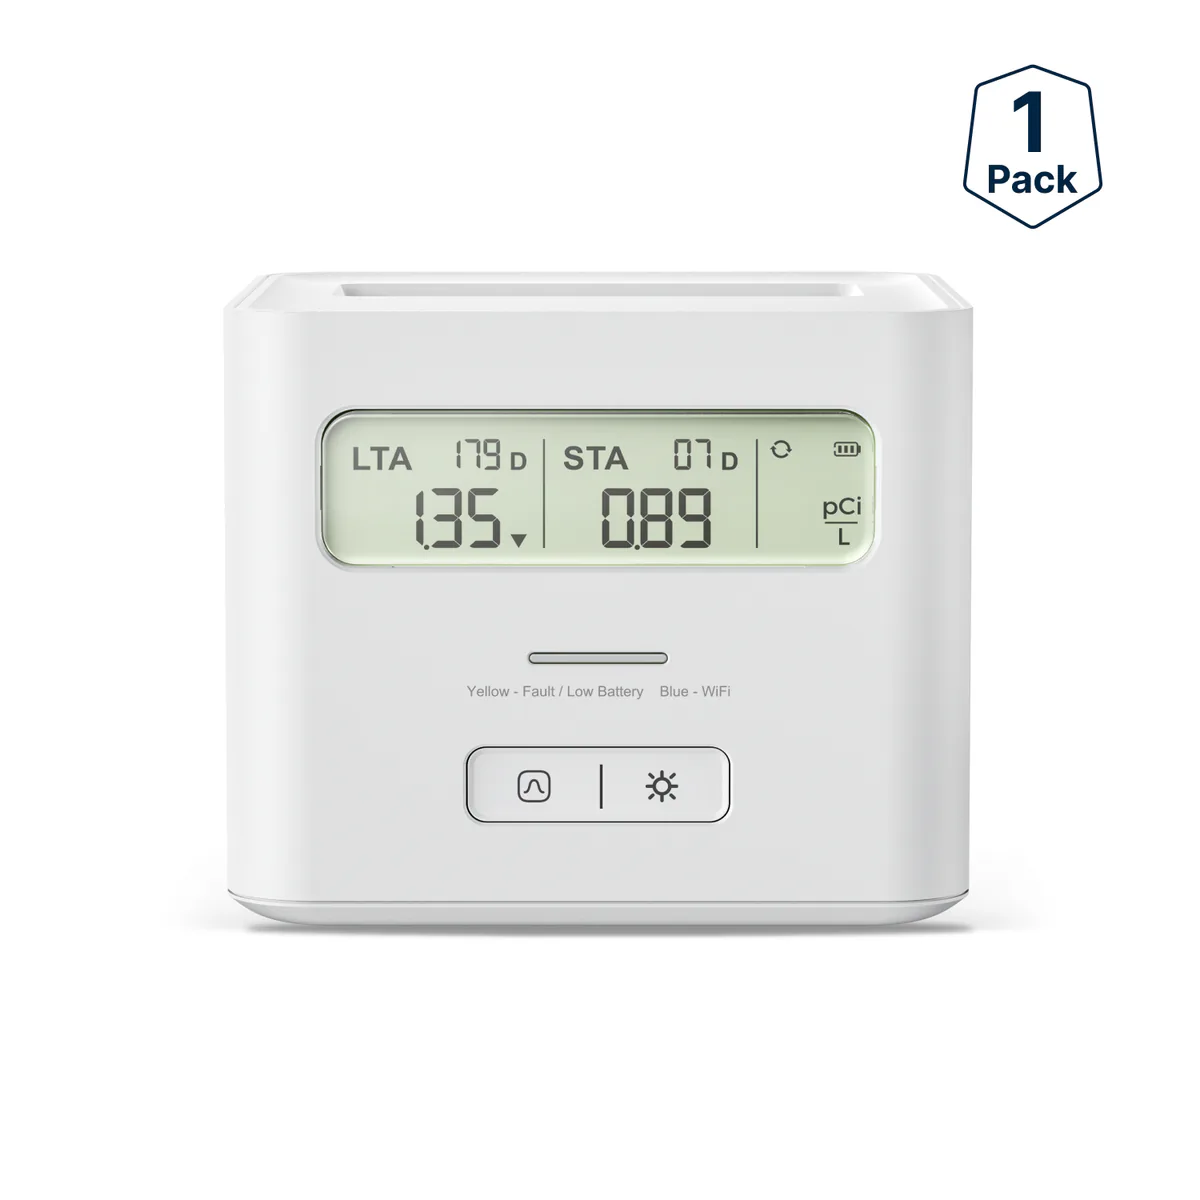
MonitorX-Sense
Method: Alpha spectrometry
First reading: Within 24 hours
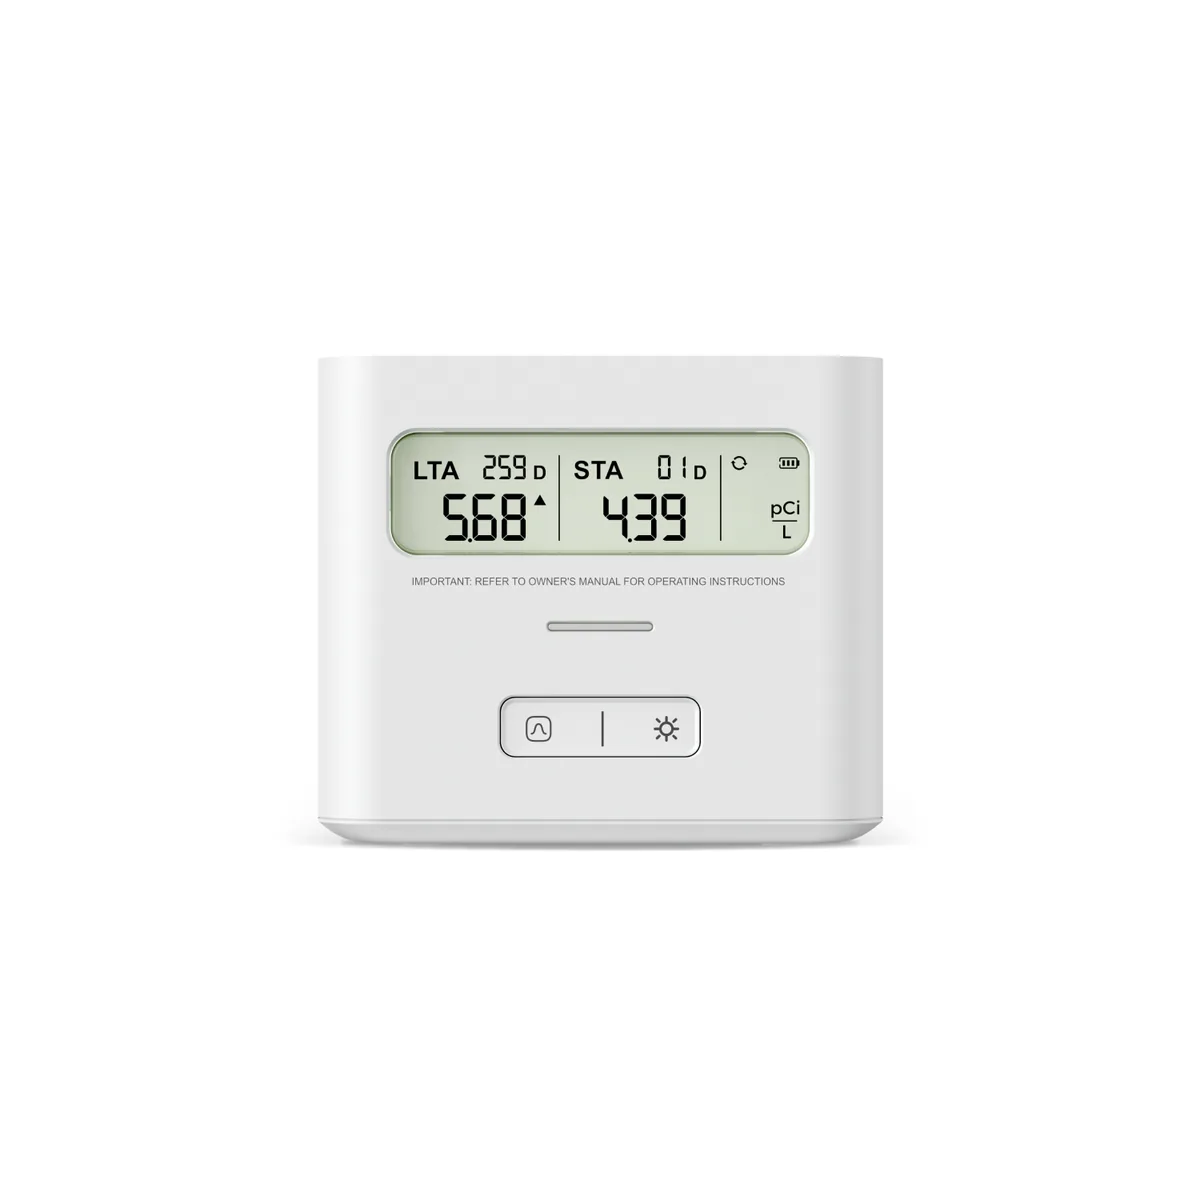
MonitorX-Sense
Method: Alpha spectrometry
First reading: Within 24 hours
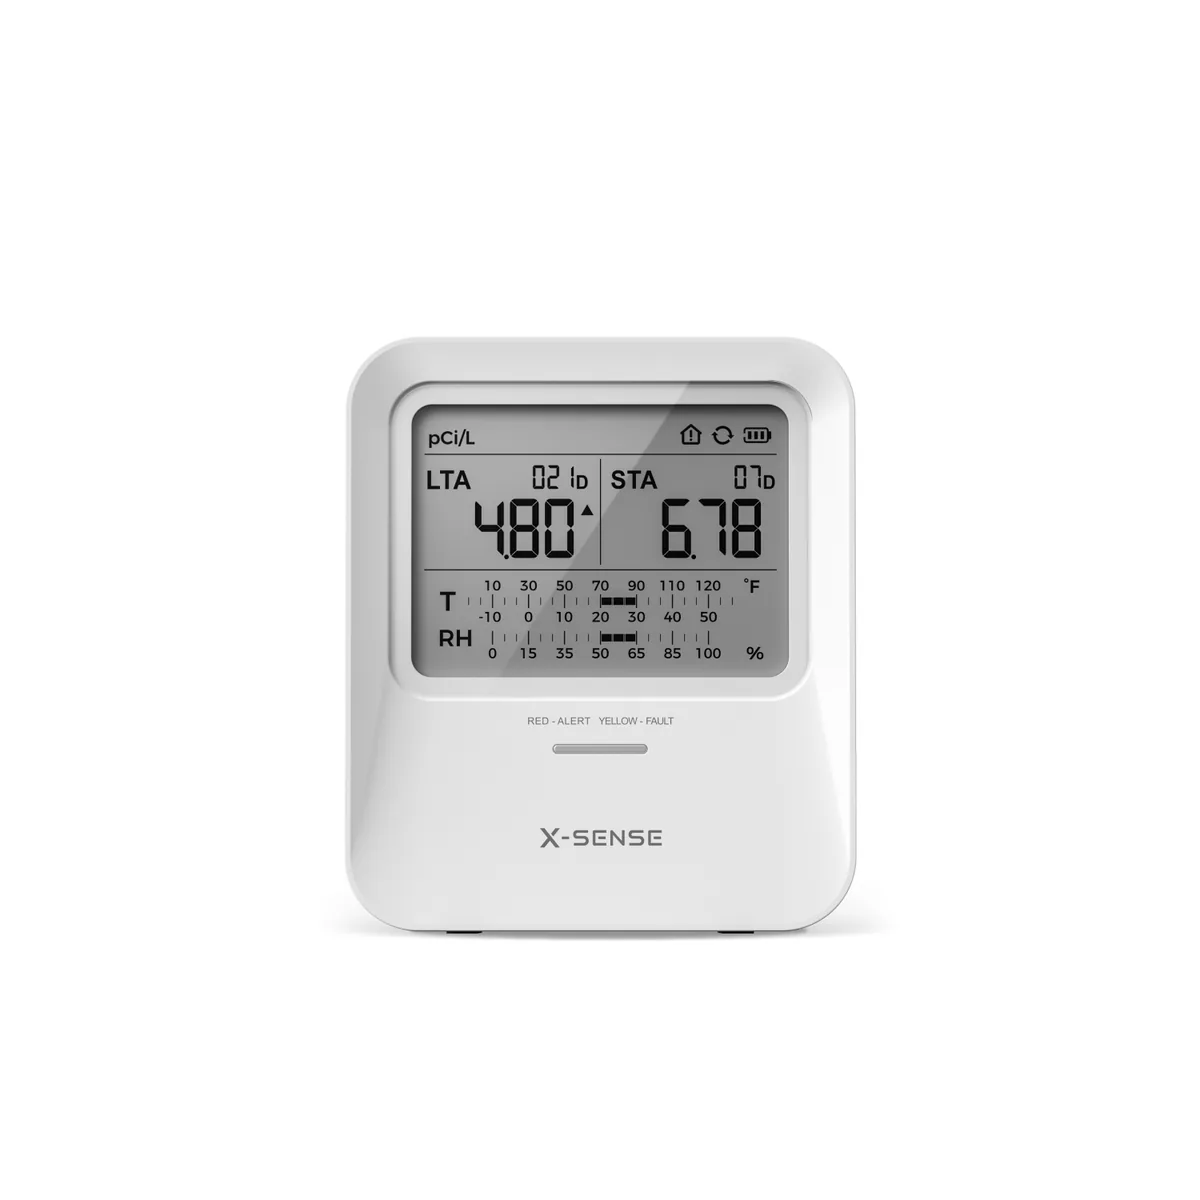
MonitorX-Sense
Method: Alpha spectrometry
First reading: Within 24 hours

Long-term kit
Method: Alpha track
In home: 90 days to 12 months
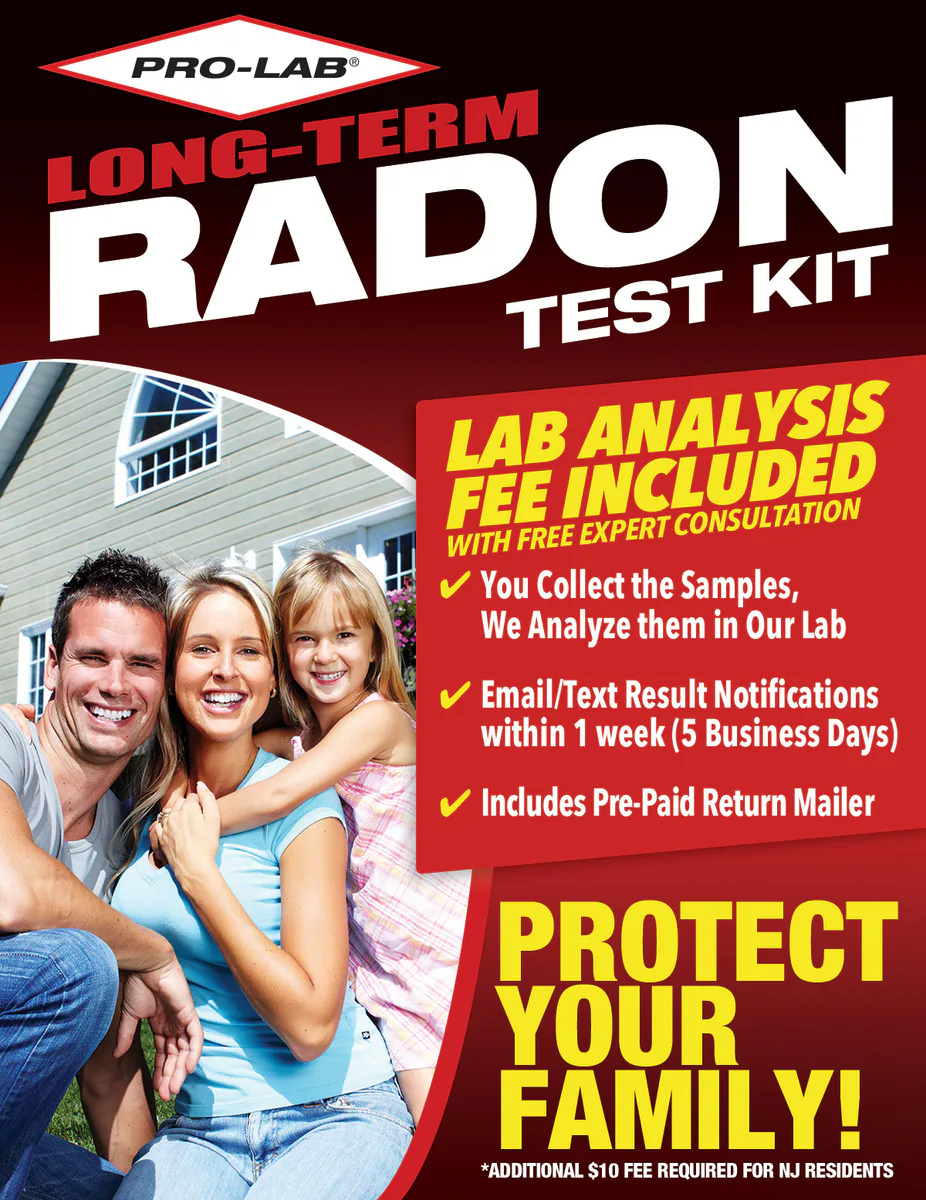
Long-term kit
Method: Alpha track
In home: 90 days to 12 months
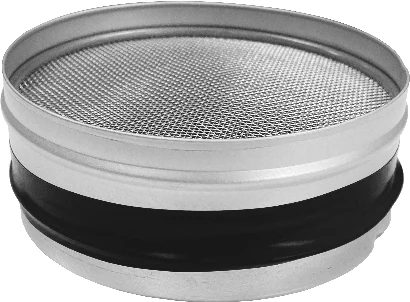
Short-term kit
Method: Charcoal
In home: 48 to 96 hours
No Amazon listing on file
See details of the AccuStar PicoCan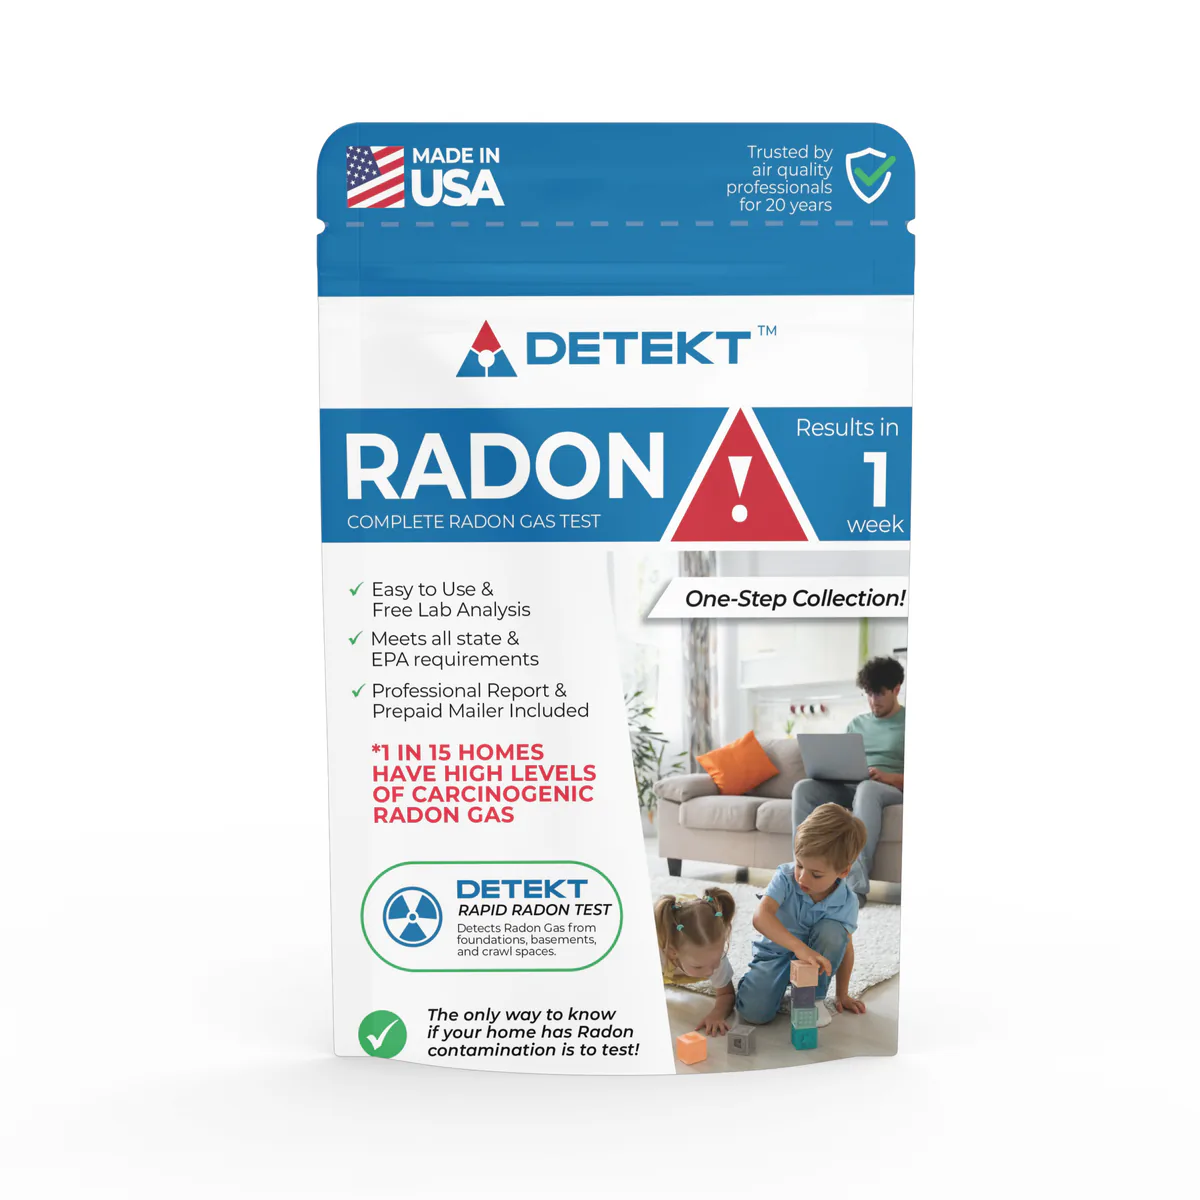
Short-term kit
Method: Charcoal
In home: 2 to 7 days
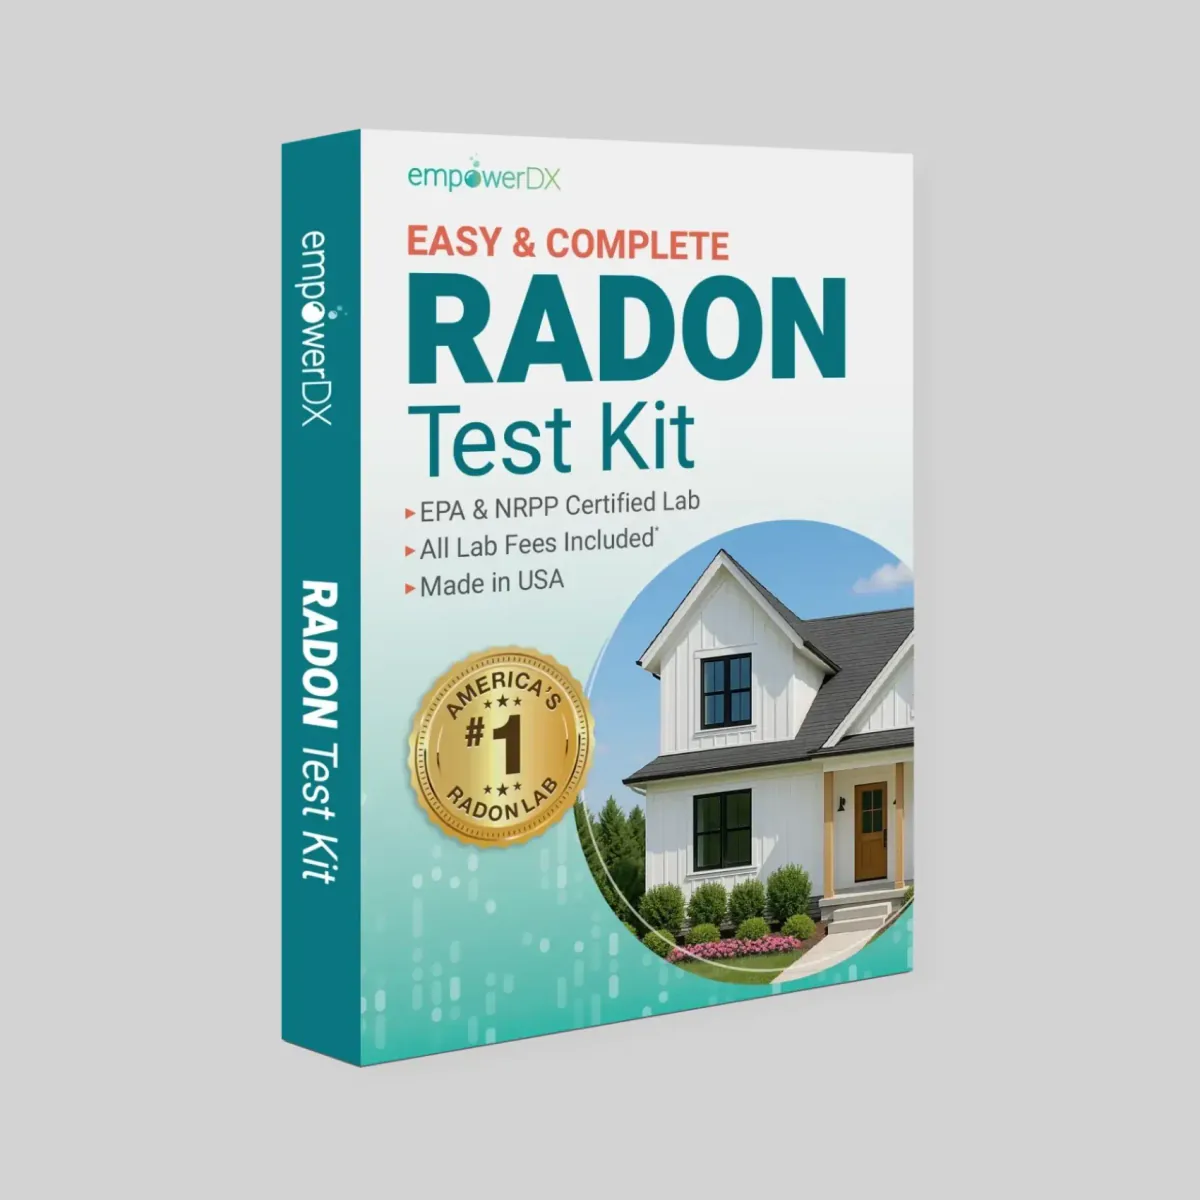
Short-term kitempowerDX
Method: Passive sampler
In home: 48 to 96 hours
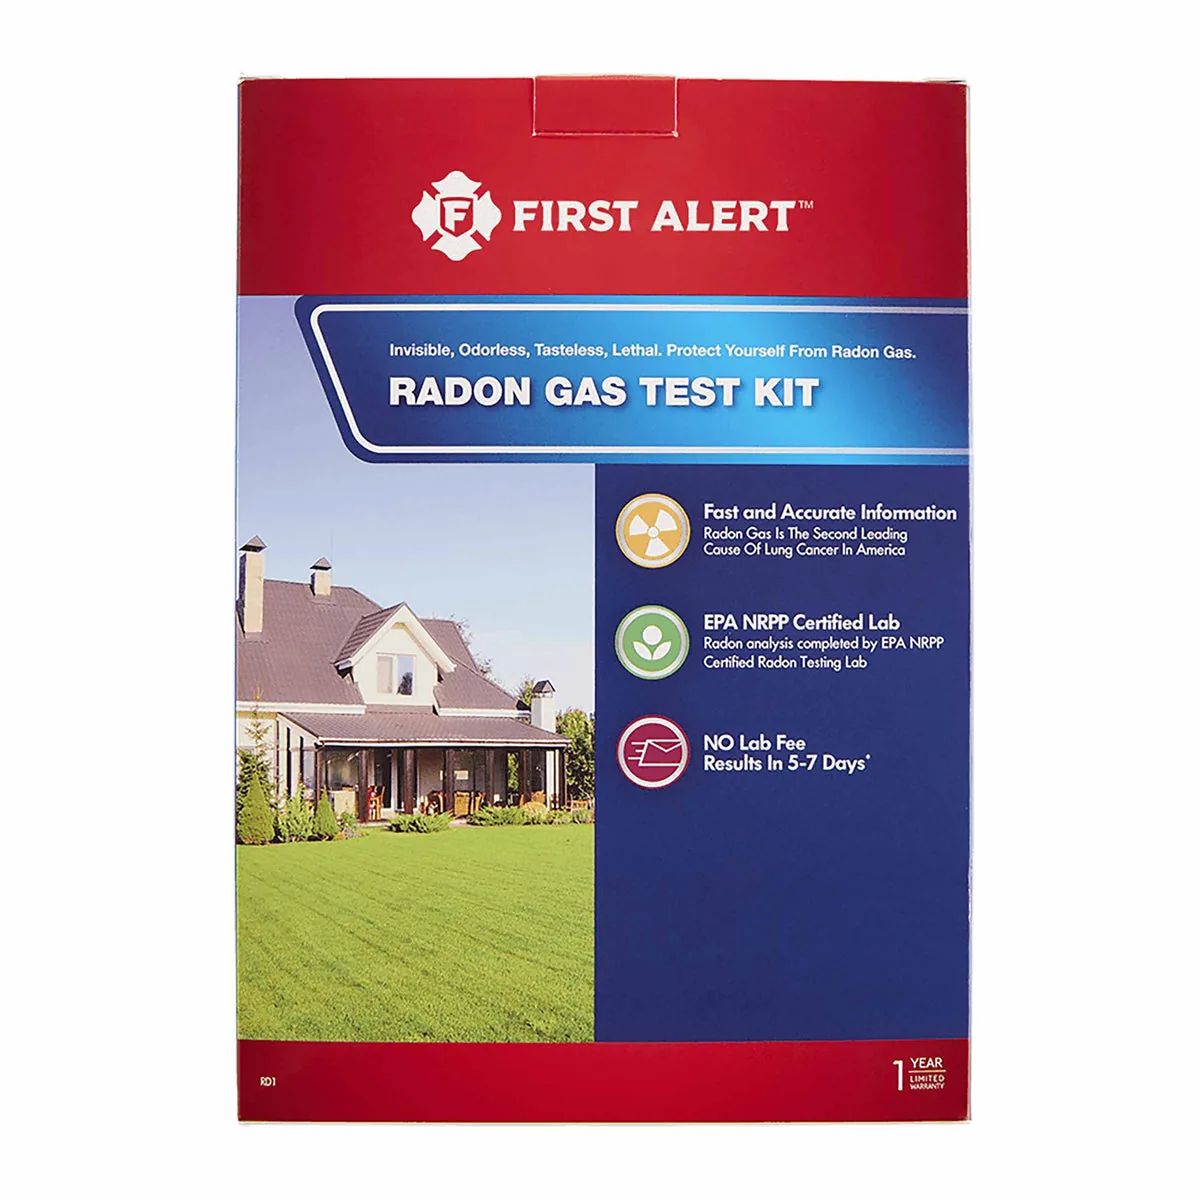
Short-term kitFirst Alert
Method: Charcoal
In home: 2 to 4 days
Short-term kitKidde
Method: Charcoal
In home: 3 days
No Amazon listing on file
See details of the Kidde 442020
Short-term kit
Method: Liquid scintillation
In home: 48 to 96 hours
Short-term kit
Method: Liquid scintillation
In home: 48 to 96 hours
Short-term kit
In home: 72 to 168 hours
No Amazon listing on file
See details of the RadonAway Air Chek Short-TermTest kits and monitors: 1 of 42
As an Amazon Associate, Radon411 earns from qualifying purchases.
Best radon monitors for Providence County homes, compared
Testing: 1 of 5
Mitigation: 1 of 3
Explore
Providence County, Bordering counties
counties bordering Providence County: 1 of 6
6 counties share a boundary with Providence County, computed from Census county geometry. Radon potential follows geology rather than county lines, so a bordering county’s report can be worth reading alongside this one.
Providence County, Cities and towns
The radon figures on this page are for Providence County as a whole. They do not differ by city or town.
6 incorporated places, as listed in the U.S. Census Bureau’s 2020 place reference files.
Providence County, Next steps
What to do next: 1 of 4
Informational. Follow EPA guidance. EPA says all radon tests should be taken for a minimum of 48 hours, with windows and doors closed from 12 hours before a short-term test.