Locations and reports
Radon Levels in Georgia
What this means for you
- Your area: EPA rates 4 of Georgia's 159 classified counties Zone 1, the highest of its three radon zones. Zones are predictions for whole counties, and homes with elevated levels occur in all three zones.
- Local tests: CDC publishes Georgia's radon test results by county. Open your county below to see its figures.
- Your home: The only way to know your home’s level is to test it.
pCi/L (picocuries per liter) is the unit radon is measured in. EPA recommends fixing a home at 4 pCi/L or above, its action level.
For Georgia, EPA's Map of Radon Zones places 4 of its 159 classified counties in Zone 1, highest predicted potential, a prediction for each county as a whole. Radon levels vary from home to home, so only a test measures the level in yours.
Predicted: EPA radon zone
159 of 159 counties classified
EPA classifies counties, not states. Of the 159 counties in Georgia with a zone, 4 are in Zone 1, 55 in Zone 2 and 100 in Zone 3.
- Zone 1: Highest predicted potentialgreater than 4 pCi/L4 of 159 counties · 2.5%
- Zone 2: Moderate predicted potential2 to 4 pCi/L55 of 159 counties · 34.6%
- Zone 3: Lower predicted potentialless than 2 pCi/L100 of 159 counties · 62.9%
An EPA radon zone describes predicted potential across a whole county. It is not intended to determine whether any individual home should be tested, and homes with elevated levels occur in all three zones. EPA recommends testing every home regardless of zone, and testing is the only way to know the radon level in a specific building.
This is a county-level geologic prediction. It is not a measurement of any address, and houses with elevated radon are found in all three zones.
Predicted: EPA Map of Radon Zones
Measured: tests reported to CDC
CDC publishes Georgia's radon test figures by county: 139 of its 159 counties have one. Each county's share is in the county list.
Georgia, In figures
Georgia in figures
What the published data says about Georgia, in words. A zone and a share of tests describe an area, never the level in any one home.
Predicted
PredictedEPA places 4 of Georgia's 159 counties in Zone 1, 55 in Zone 2 and 100 in Zone 3.
Zone 1 counties, A to Z, begin with Cobb County, DeKalb County and Fulton County; the county section below lists all 4.
Compared
Calculated by Radon4113% of Georgia's counties with a zone on file are in Zone 1, a smaller share than across all U.S. counties (34%). It is a share of counties, not of land, people or homes.
Reported tests
MeasuredCDC has no statewide testing figure for Georgia on file here.
139 of the 159 counties have a published county figure; the most tests in each one's latest year were reported for Fulton County (4,025 in 2017), Gwinnett County (3,330 in 2017) and DeKalb County (2,913 in 2017).
Georgia's radon program and its page are under Local resources.
Georgia, Counties
Georgia counties by EPA zone
PredictedAll 159 counties, by the zone EPA predicts for each. Every county has its own report.
Zone 1: highest predicted potential4
Zone 2: moderate predicted potential55
- Banks County35.1% of reported tests at or above 4 pCi/L, 2017
- Barrow County48.3% of reported tests at or above 4 pCi/L, 2017
- Bartow County24.9% of reported tests at or above 4 pCi/L, 2017
- Butts County6.7% of reported tests at or above 4 pCi/L, 2017
- Carroll County40.5% of reported tests at or above 4 pCi/L, 2017
- Catoosa County18.6% of reported tests at or above 4 pCi/L, 2017
- Cherokee County17.6% of reported tests at or above 4 pCi/L, 2017
- Clarke County12.8% of reported tests at or above 4 pCi/L, 2017
- Clayton County20.1% of reported tests at or above 4 pCi/L, 2017
- Coweta County19.2% of reported tests at or above 4 pCi/L, 2017
- Dawson County21.8% of reported tests at or above 4 pCi/L, 2017
- Douglas County47.3% of reported tests at or above 4 pCi/L, 2017
- Elbert County18.6% of reported tests at or above 4 pCi/L, 2017
- Fannin County44.7% of reported tests at or above 4 pCi/L, 2017
- Fayette County30.5% of reported tests at or above 4 pCi/L, 2017
- Floyd County19.8% of reported tests at or above 4 pCi/L, 2017
- Forsyth County13.0% of reported tests at or above 4 pCi/L, 2017
- Franklin County37.0% of reported tests at or above 4 pCi/L, 2017
- Gilmer County46.6% of reported tests at or above 4 pCi/L, 2017
- Greene County17.6% of reported tests at or above 4 pCi/L, 2017
- Habersham County37.5% of reported tests at or above 4 pCi/L, 2017
- Hall County39.8% of reported tests at or above 4 pCi/L, 2017
- Haralson County31.8% of reported tests at or above 4 pCi/L, 2017
- Harris County15.7% of reported tests at or above 4 pCi/L, 2017
- Hart County40.2% of reported tests at or above 4 pCi/L, 2017
- Heard County26.3% of reported tests at or above 4 pCi/L, 2017
- Henry County22.7% of reported tests at or above 4 pCi/L, 2017
- Jackson County40.0% of reported tests at or above 4 pCi/L, 2017
- Jasper County27.3% of reported tests at or above 4 pCi/L, 2017
- Lamar County40.0% of reported tests at or above 4 pCi/L, 2017
- Lumpkin County46.3% of reported tests at or above 4 pCi/L, 2017
- Madison County26.1% of reported tests at or above 4 pCi/L, 2017
- Meriwether County4.5% of reported tests at or above 4 pCi/L, 2017
- Monroe County23.0% of reported tests at or above 4 pCi/L, 2017
- Morgan County16.7% of reported tests at or above 4 pCi/L, 2017
- Newton County25.8% of reported tests at or above 4 pCi/L, 2017
- Oconee County19.0% of reported tests at or above 4 pCi/L, 2017
- Oglethorpe County32.9% of reported tests at or above 4 pCi/L, 2017
- Paulding County26.0% of reported tests at or above 4 pCi/L, 2017
- Pickens County37.6% of reported tests at or above 4 pCi/L, 2017
- Pike County38.5% of reported tests at or above 4 pCi/L, 2017
- Rabun County26.1% of reported tests at or above 4 pCi/L, 2017
- Richmond County0.0% of reported tests at or above 4 pCi/L, 2017
- Rockdale County29.1% of reported tests at or above 4 pCi/L, 2017
- Spalding County33.6% of reported tests at or above 4 pCi/L, 2017
- Stephens County25.3% of reported tests at or above 4 pCi/L, 2017
- Talbot County0.0% of reported tests at or above 4 pCi/L, 2017
- Towns County31.9% of reported tests at or above 4 pCi/L, 2017
- Troup County33.9% of reported tests at or above 4 pCi/L, 2017
- Union County44.6% of reported tests at or above 4 pCi/L, 2017
- Upson County20.0% of reported tests at or above 4 pCi/L, 2017
- Walker County22.7% of reported tests at or above 4 pCi/L, 2017
- Walton County42.2% of reported tests at or above 4 pCi/L, 2017
- White County25.3% of reported tests at or above 4 pCi/L, 2017
- Whitfield County20.6% of reported tests at or above 4 pCi/L, 2017
Zone 3: lower predicted potential100
- Appling CountyReported testing not yet available
- Atkinson CountyReported testing not yet available
- Bacon CountyReported testing not yet available
- Baker CountyReported testing not yet available
- Baldwin County20.0% of reported tests at or above 4 pCi/L, 2017
- Ben Hill County0.0% of reported tests at or above 4 pCi/L, 2017
- Berrien County0.0% of reported tests at or above 4 pCi/L, 2017
- Bibb County1.0% of reported tests at or above 4 pCi/L, 2017
- Bleckley County0.0% of reported tests at or above 4 pCi/L, 2017
- Brantley CountyReported testing not yet available
- Brooks County0.0% of reported tests at or above 4 pCi/L, 2017
- Bryan County0.0% of reported tests at or above 4 pCi/L, 2017
- Bulloch County0.0% of reported tests at or above 4 pCi/L, 2017
- Burke County0.0% of reported tests at or above 4 pCi/L, 2017
- Calhoun County0.0% of reported tests at or above 4 pCi/L, 2017
- Camden County0.0% of reported tests at or above 4 pCi/L, 2017
- Candler CountyReported testing not yet available
- Charlton County0.0% of reported tests at or above 4 pCi/L, 2017
- Chatham County0.0% of reported tests at or above 4 pCi/L, 2017
- Chattahoochee County0.0% of reported tests at or above 4 pCi/L, 2016
- Chattooga County60.0% of reported tests at or above 4 pCi/L, 2017
- Clay County0.0% of reported tests at or above 4 pCi/L, 2016
- Clinch County0.0% of reported tests at or above 4 pCi/L, 2017
- Coffee County0.0% of reported tests at or above 4 pCi/L, 2017
- Colquitt County0.0% of reported tests at or above 4 pCi/L, 2017
- Columbia County11.1% of reported tests at or above 4 pCi/L, 2017
- Cook County0.0% of reported tests at or above 4 pCi/L, 2017
- Crawford County50.0% of reported tests at or above 4 pCi/L, 2017
- Crisp County0.0% of reported tests at or above 4 pCi/L, 2017
- Dade County17.6% of reported tests at or above 4 pCi/L, 2017
- Decatur County0.0% of reported tests at or above 4 pCi/L, 2017
- Dodge County0.0% of reported tests at or above 4 pCi/L, 2017
- Dooly County0.0% of reported tests at or above 4 pCi/L, 2016
- Dougherty County0.0% of reported tests at or above 4 pCi/L, 2017
- Early County50.0% of reported tests at or above 4 pCi/L, 2017
- Echols CountyReported testing not yet available
- Effingham County0.0% of reported tests at or above 4 pCi/L, 2017
- Emanuel County0.0% of reported tests at or above 4 pCi/L, 2017
- Evans County0.0% of reported tests at or above 4 pCi/L, 2016
- Glascock County0.0% of reported tests at or above 4 pCi/L, 2014
- Glynn County0.0% of reported tests at or above 4 pCi/L, 2017
- Gordon County31.4% of reported tests at or above 4 pCi/L, 2017
- Grady County0.0% of reported tests at or above 4 pCi/L, 2014
- Hancock County0.0% of reported tests at or above 4 pCi/L, 2017
- Houston County11.3% of reported tests at or above 4 pCi/L, 2017
- Irwin County0.0% of reported tests at or above 4 pCi/L, 2017
- Jeff Davis CountyReported testing not yet available
- Jefferson County0.0% of reported tests at or above 4 pCi/L, 2017
- Jenkins County0.0% of reported tests at or above 4 pCi/L, 2017
- Johnson County0.0% of reported tests at or above 4 pCi/L, 2017
- Jones County29.0% of reported tests at or above 4 pCi/L, 2017
- Lanier CountyReported testing not yet available
- Laurens County17.9% of reported tests at or above 4 pCi/L, 2017
- Lee County0.0% of reported tests at or above 4 pCi/L, 2017
- Liberty County0.0% of reported tests at or above 4 pCi/L, 2017
- Lincoln County0.0% of reported tests at or above 4 pCi/L, 2017
- Long CountyReported testing not yet available
- Lowndes County0.0% of reported tests at or above 4 pCi/L, 2017
- Macon County33.3% of reported tests at or above 4 pCi/L, 2017
- Marion County0.0% of reported tests at or above 4 pCi/L, 2017
- McDuffie County8.3% of reported tests at or above 4 pCi/L, 2017
- McIntosh County0.0% of reported tests at or above 4 pCi/L, 2017
- Miller CountyReported testing not yet available
- Mitchell County0.0% of reported tests at or above 4 pCi/L, 2016
- Montgomery CountyReported testing not yet available
- Murray County23.1% of reported tests at or above 4 pCi/L, 2017
- Muscogee County5.7% of reported tests at or above 4 pCi/L, 2017
- Peach County66.7% of reported tests at or above 4 pCi/L, 2017
- Pierce County0.0% of reported tests at or above 4 pCi/L, 2017
- Polk County57.1% of reported tests at or above 4 pCi/L, 2017
- Pulaski County0.0% of reported tests at or above 4 pCi/L, 2017
- Putnam County30.0% of reported tests at or above 4 pCi/L, 2017
- Quitman CountyReported testing not yet available
- Randolph County16.7% of reported tests at or above 4 pCi/L, 2017
- Schley County0.0% of reported tests at or above 4 pCi/L, 2017
- Screven County0.0% of reported tests at or above 4 pCi/L, 2017
- Seminole CountyReported testing not yet available
- Stewart CountyReported testing not yet available
- Sumter County20.0% of reported tests at or above 4 pCi/L, 2017
- Taliaferro County0.0% of reported tests at or above 4 pCi/L, 2016
- Tattnall CountyReported testing not yet available
- Taylor CountyReported testing not yet available
- Telfair County0.0% of reported tests at or above 4 pCi/L, 2017
- Terrell CountyReported testing not yet available
- Thomas County13.3% of reported tests at or above 4 pCi/L, 2017
- Tift County0.0% of reported tests at or above 4 pCi/L, 2017
- Toombs County0.0% of reported tests at or above 4 pCi/L, 2017
- Treutlen County0.0% of reported tests at or above 4 pCi/L, 2016
- Turner County0.0% of reported tests at or above 4 pCi/L, 2016
- Twiggs County50.0% of reported tests at or above 4 pCi/L, 2017
- Ware County0.0% of reported tests at or above 4 pCi/L, 2017
- Warren County0.0% of reported tests at or above 4 pCi/L, 2017
- Washington County0.0% of reported tests at or above 4 pCi/L, 2017
- Wayne County0.0% of reported tests at or above 4 pCi/L, 2017
- Webster CountyReported testing not yet available
- Wheeler County0.0% of reported tests at or above 4 pCi/L, 2017
- Wilcox County0.0% of reported tests at or above 4 pCi/L, 2017
- Wilkes County20.0% of reported tests at or above 4 pCi/L, 2017
- Wilkinson County0.0% of reported tests at or above 4 pCi/L, 2017
- Worth CountyReported testing not yet available
Georgia, Local resources
Local resources in Georgia
Who to ask in Georgia: the state's radon program, test kits and professionals.
Georgia's radon program
Georgia Attorney General's Consumer Protection Division
Georgia’s radon program answers questions about testing, mitigation and the rules where you live.
- Licensing of radon professionals
There are no laws mandating a mitigator receive certification in Georgia, however, many mitigators choose to get certified by one of two national programs.
Test kits
The program says: A kit costs $15.00 if mailed or $10.00 if picked up at a participating County Extension office.
Radon professionals
2 professionals are listed in Georgia.
Professionals in GeorgiaGeorgia, Questions
Questions about radon in Georgia
Common questions9 questions, answered from the figures above
Is radon a problem in Georgia?
EPA's Map of Radon Zones places 4 of the 159 Georgia counties it classifies in Zone 1, the highest predicted potential, 55 in Zone 2 and 100 in Zone 3. An EPA radon zone describes predicted potential across a whole county. It is not intended to determine whether any individual home should be tested, and homes with elevated levels occur in all three zones. EPA recommends testing every home regardless of zone, and testing is the only way to know the radon level in a specific building.
Which Georgia counties are in EPA radon Zone 1?
4 counties are in Zone 1: Cobb County, DeKalb County, Fulton County, Gwinnett County. Zone 1 is EPA's class for highest predicted potential, a predicted average indoor screening level greater than 4 pCi/L. A zone is a prediction for a county, not a measurement of any home.
Radon in Cobb CountyRadon in DeKalb CountyRadon in Fulton County
How do I get a radon test in Georgia?
EPA says you can test your home yourself or hire a qualified radon test company, and that either approach takes only a small amount of time and effort. The Georgia radon program is the place to ask about certified testers and any test kit offer it runs.
How to test a homeFree and low-cost kits by stateGeorgia radon program
Who does radon mitigation in Georgia?
Radon411's Georgia directory lists 2 certified radon companies. EPA recommends having a qualified contractor fix a home with a radon problem, because lowering high radon levels takes technical knowledge and special skills, and some states require the work to be done by a licensed or certified professional.
How radon mitigation worksWhat mitigation costsRadon professionals in Georgia
Which Georgia counties have the highest radon?
159 of Georgia's 159 counties have an EPA radon zone published here. Radon411 will not rank counties on data it does not hold, and a zone is a prediction for an area rather than a measurement of any building.
What share of radon tests in Georgia are high?
CDC has published no statewide radon testing statistics for Georgia, so we cannot give a figure. Where CDC does publish one, the percentage describes radon tests reported to CDC, not homes.
Which EPA region is Georgia in?
Georgia is in EPA Region 4: Southeast.
Do I need to test my home in Georgia?
Yes, wherever you live in the state. Testing is the only way to know the radon level in a specific building. EPA recommends fixing a home when the radon level is 4 pCi/L or higher. EPA recommends considering a fix when the level is between 2 and 4 pCi/L.
Why does this page show coverage rather than one radon level for Georgia?
A statewide figure averages counties with very different geology and very different numbers of reported tests, so it hides more than it shows. The county report is the level at which the EPA zone, the geologic potential and the reported testing statistics are actually published, which is why the county table above links to every one of them.
What these figures mean if you own, buy, sell or rent
The zone counts on this page describe counties across Georgia. They are predictions for areas, and none of them measures your building.
- How to test a home
If you own your home
Test the lowest lived-in level; a short-term kit screens in days, a long-term kit reflects the year.
- Buying a house: radon guide
If you are buying
Ask for past results and any system's post-mitigation test, and test during the sale.
- Selling a house: radon guide
If you are selling
Testing before you list puts the timing in your hands; disclosure rules differ by state.
- Radon in rental homes
If you rent, or rent out a home
A tenant can test; a fix is the owner's to make, and duties differ by state.
How long a test has to run, under what conditions, and what EPA says a result means: the testing standard, in full.
Georgia, Products
Testing and mitigation products
Whatever the figures for Georgia show, only a test tells you about one home.
Testing
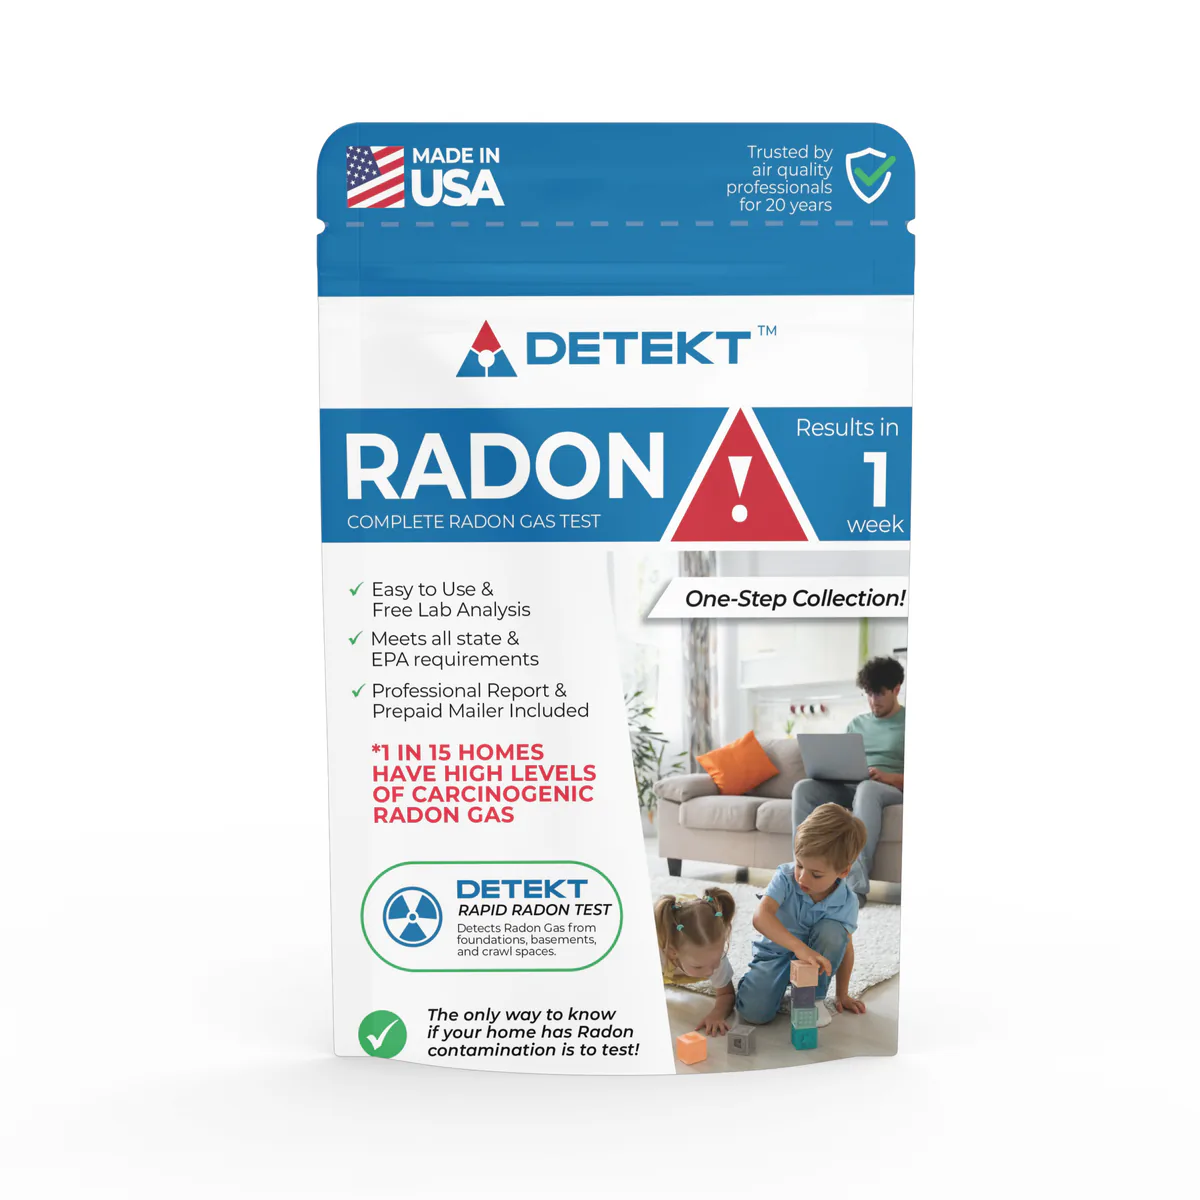
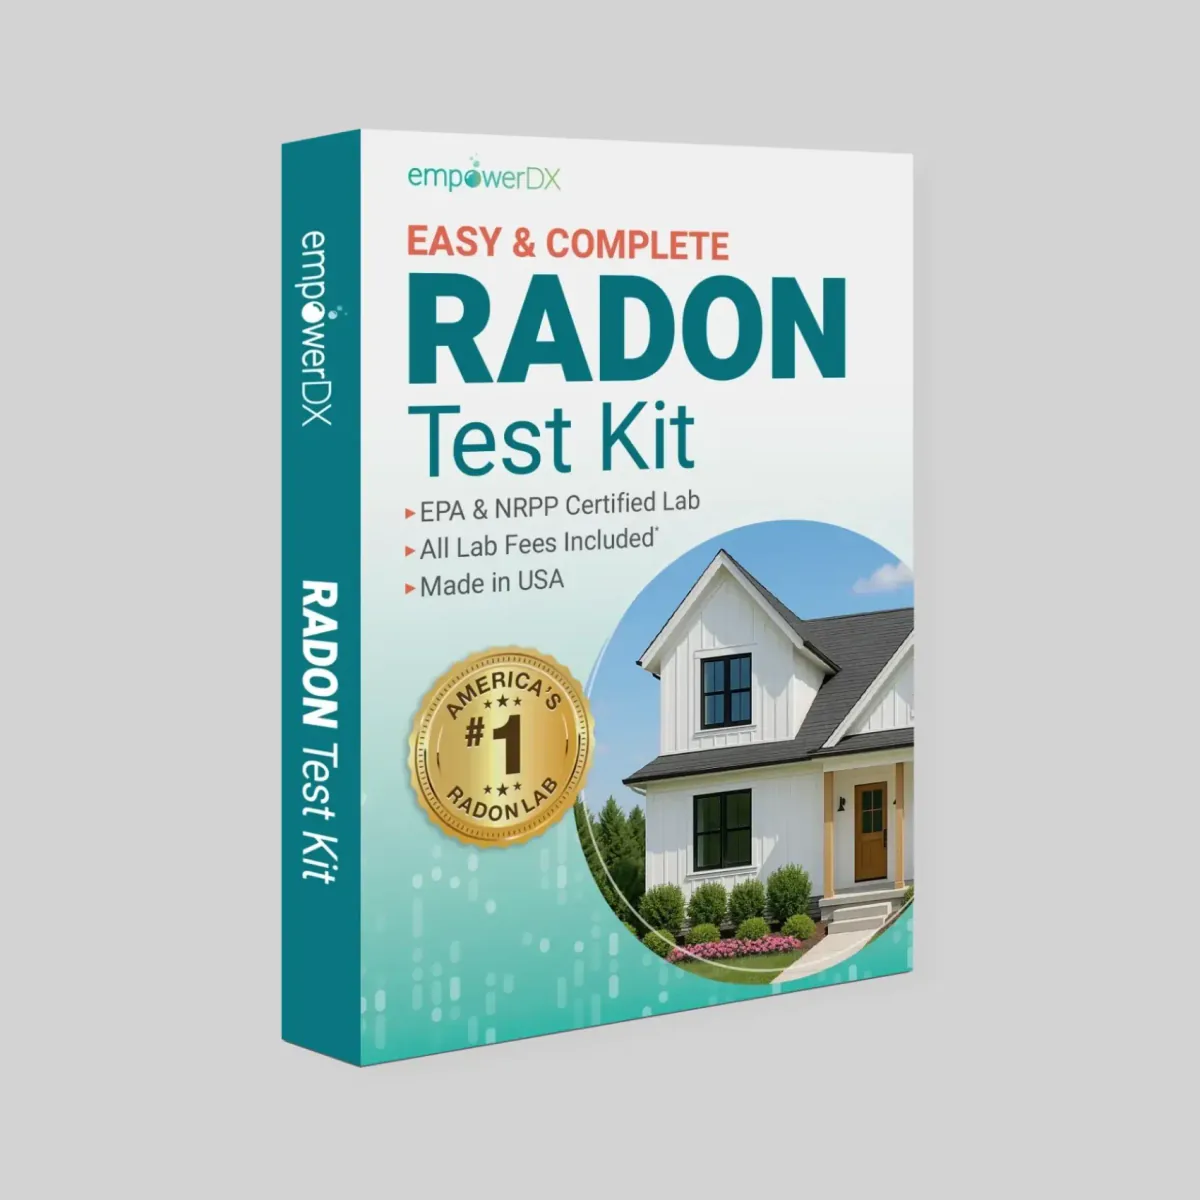
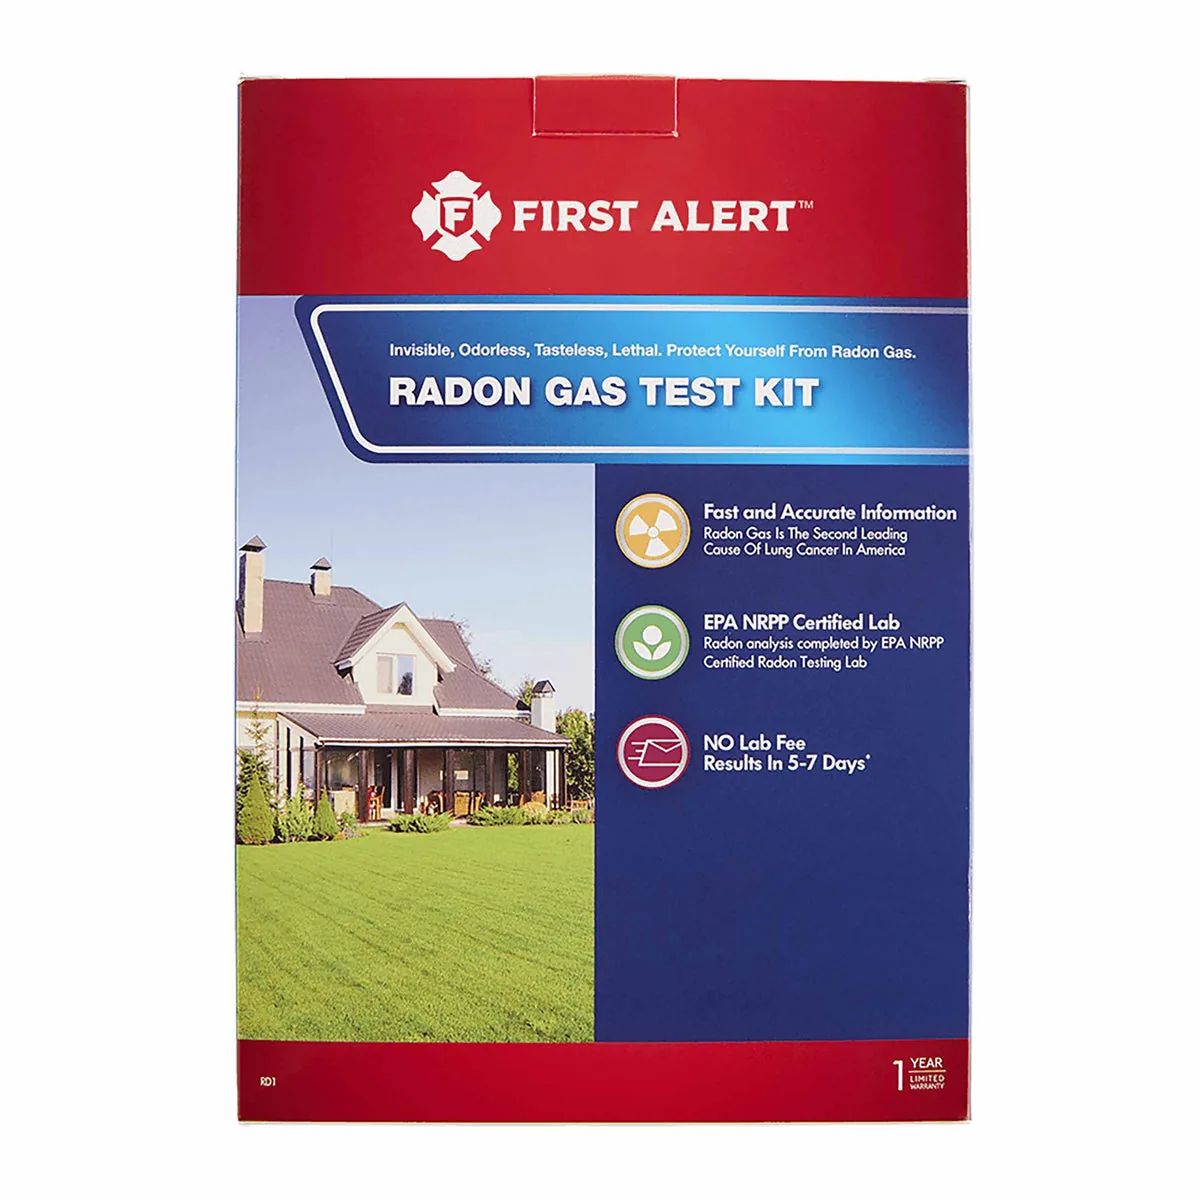
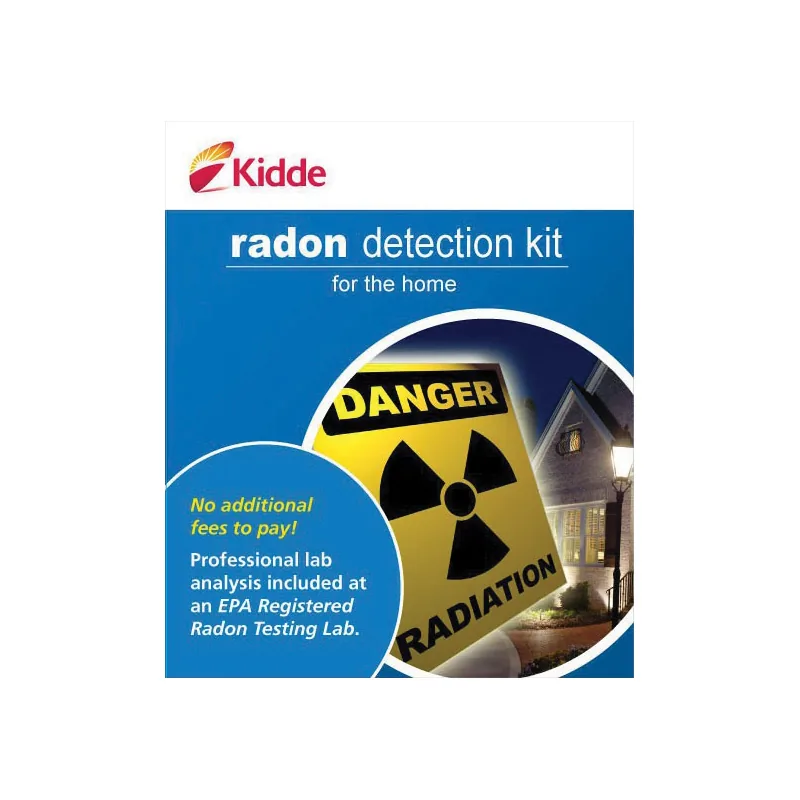
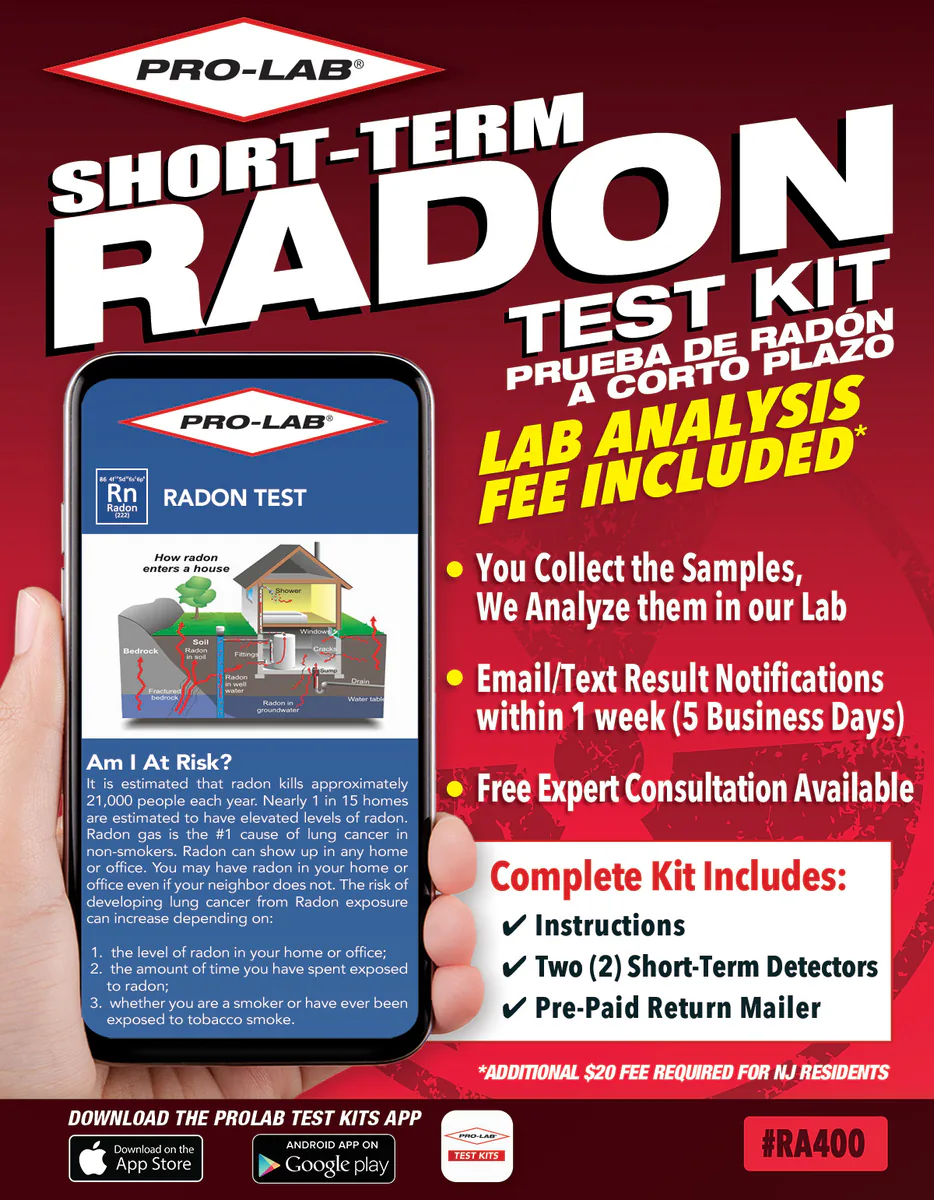
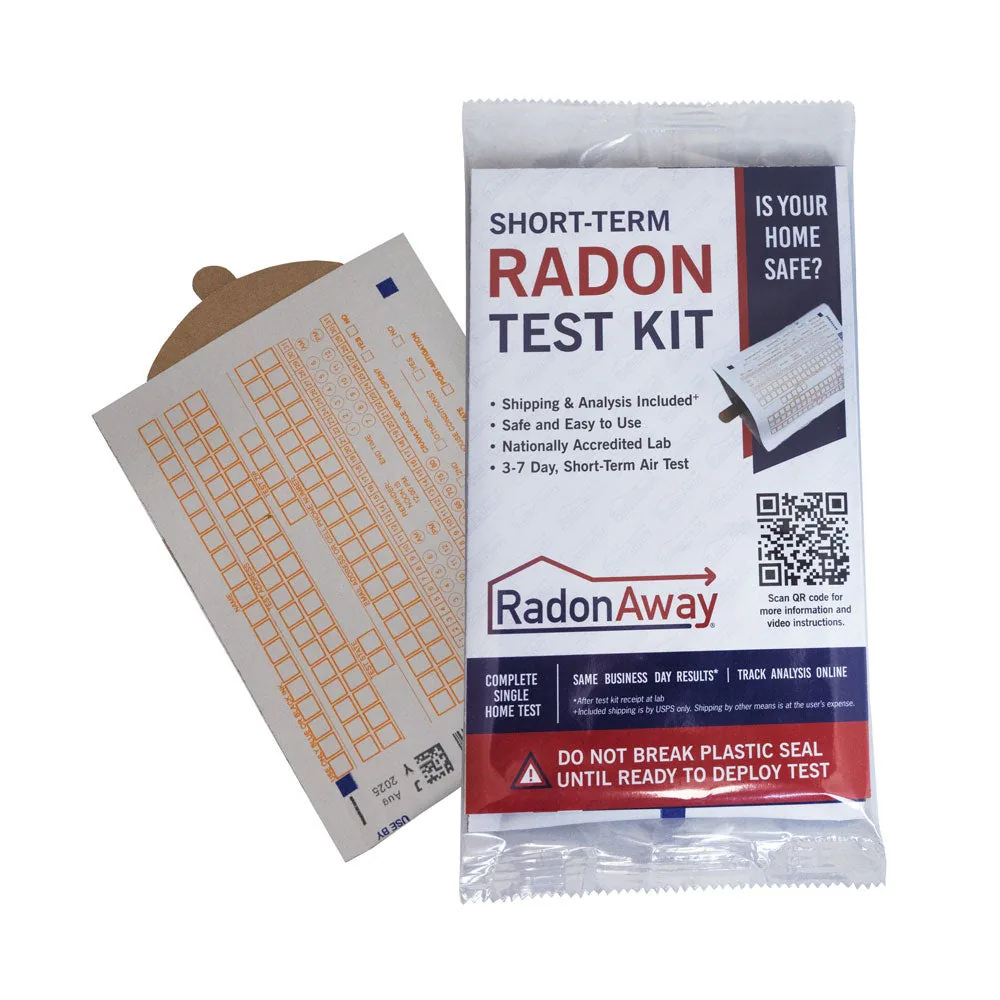
- Short-term test kitsPassive detectors exposed for a few days under closed-building conditions, then analyzed by a lab.
- Long-term test kitsDetectors exposed for more than 90 days, for a closer picture of the annual average.
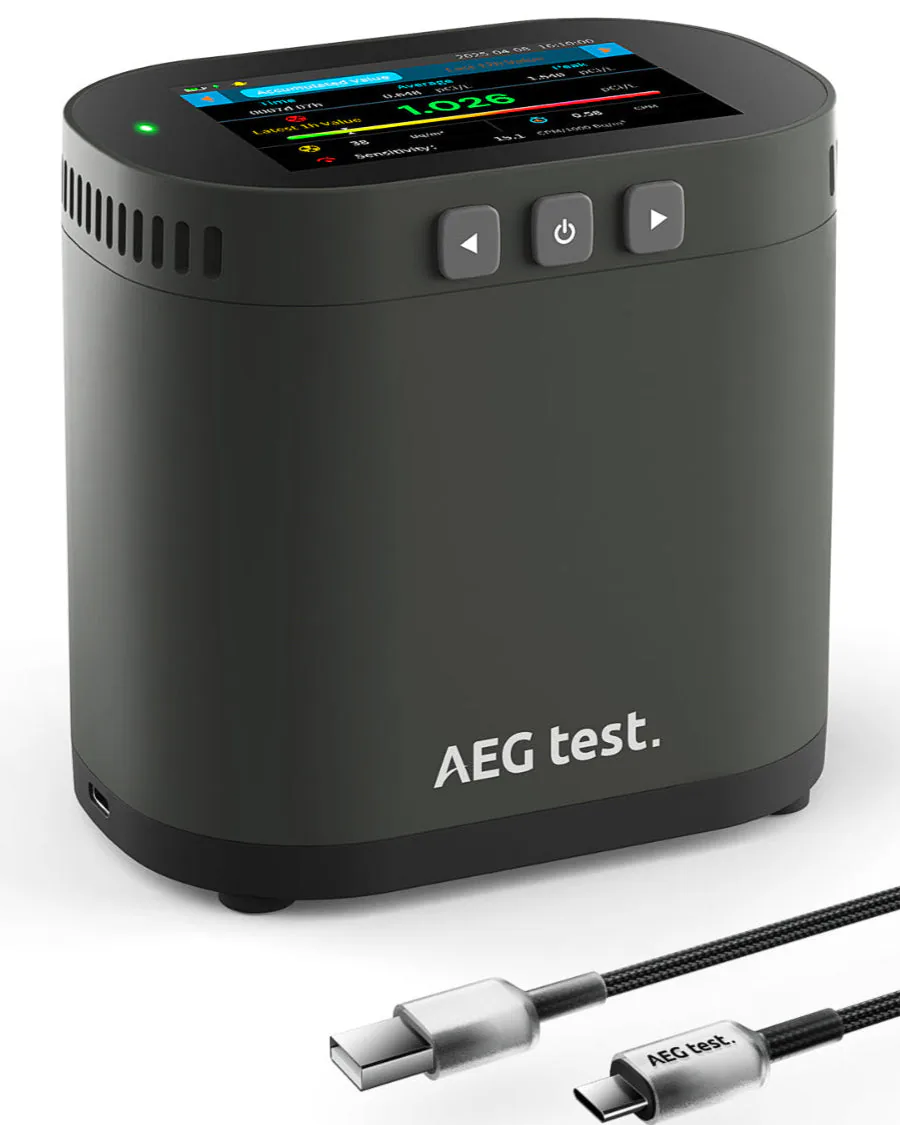
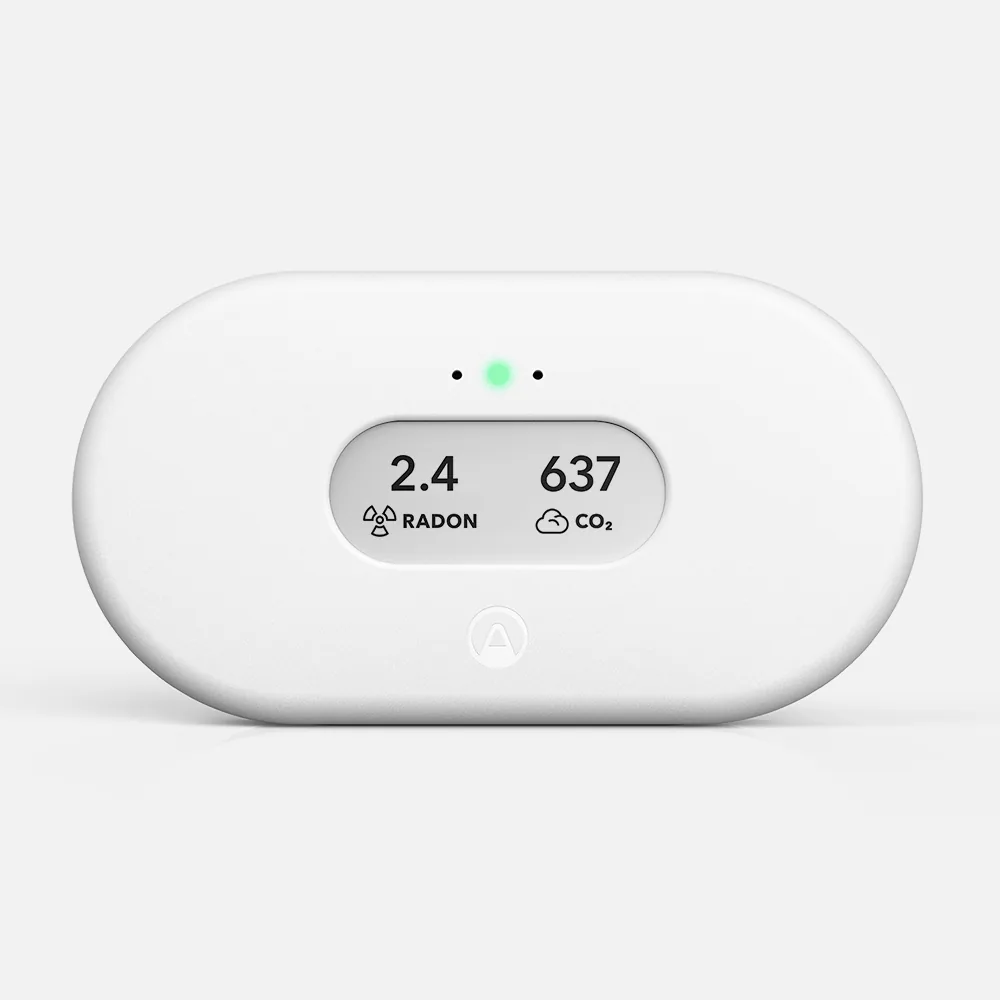
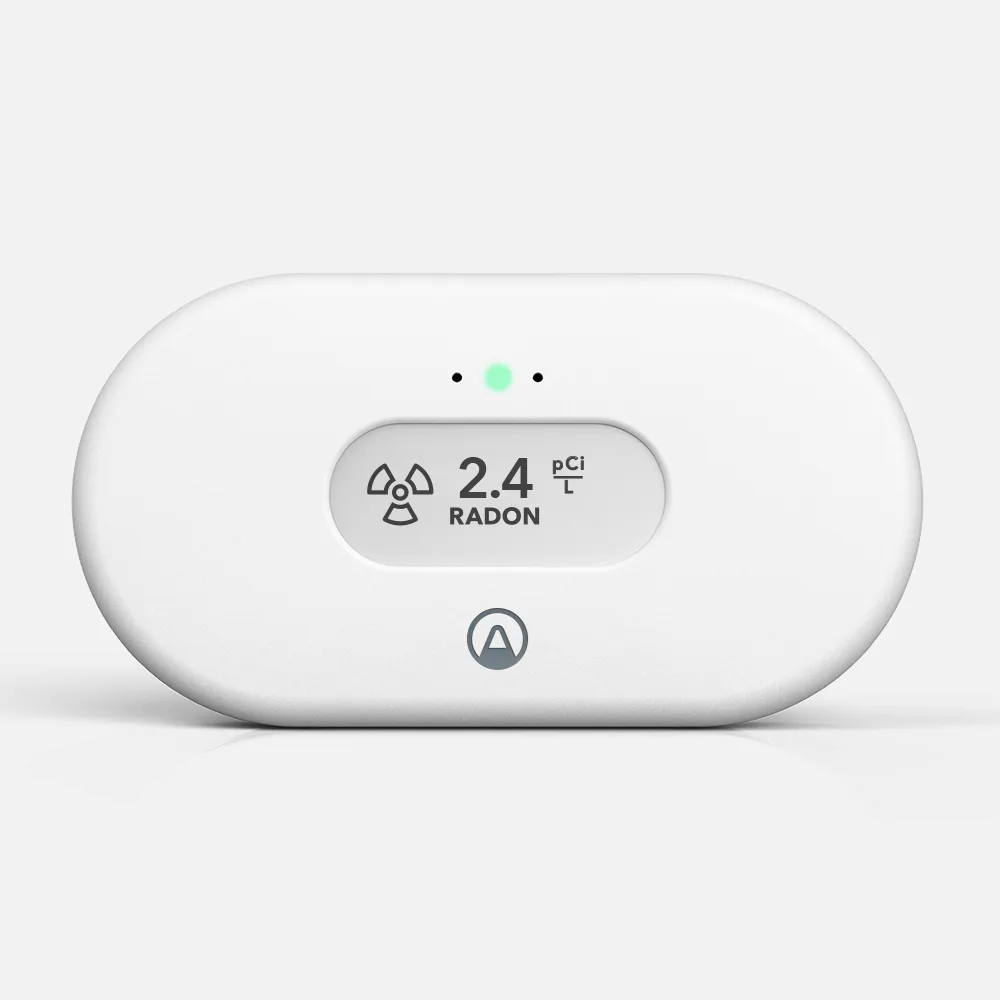
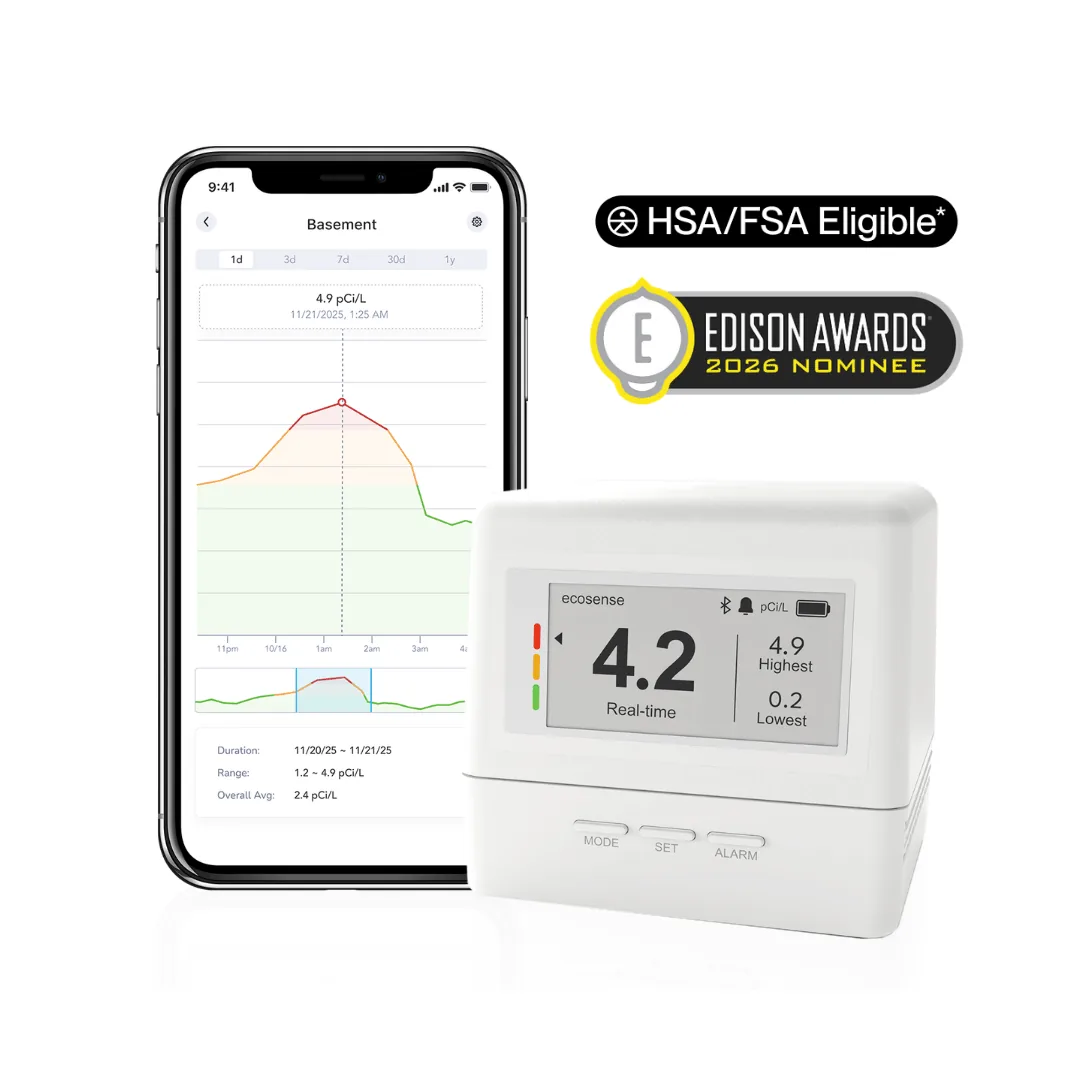
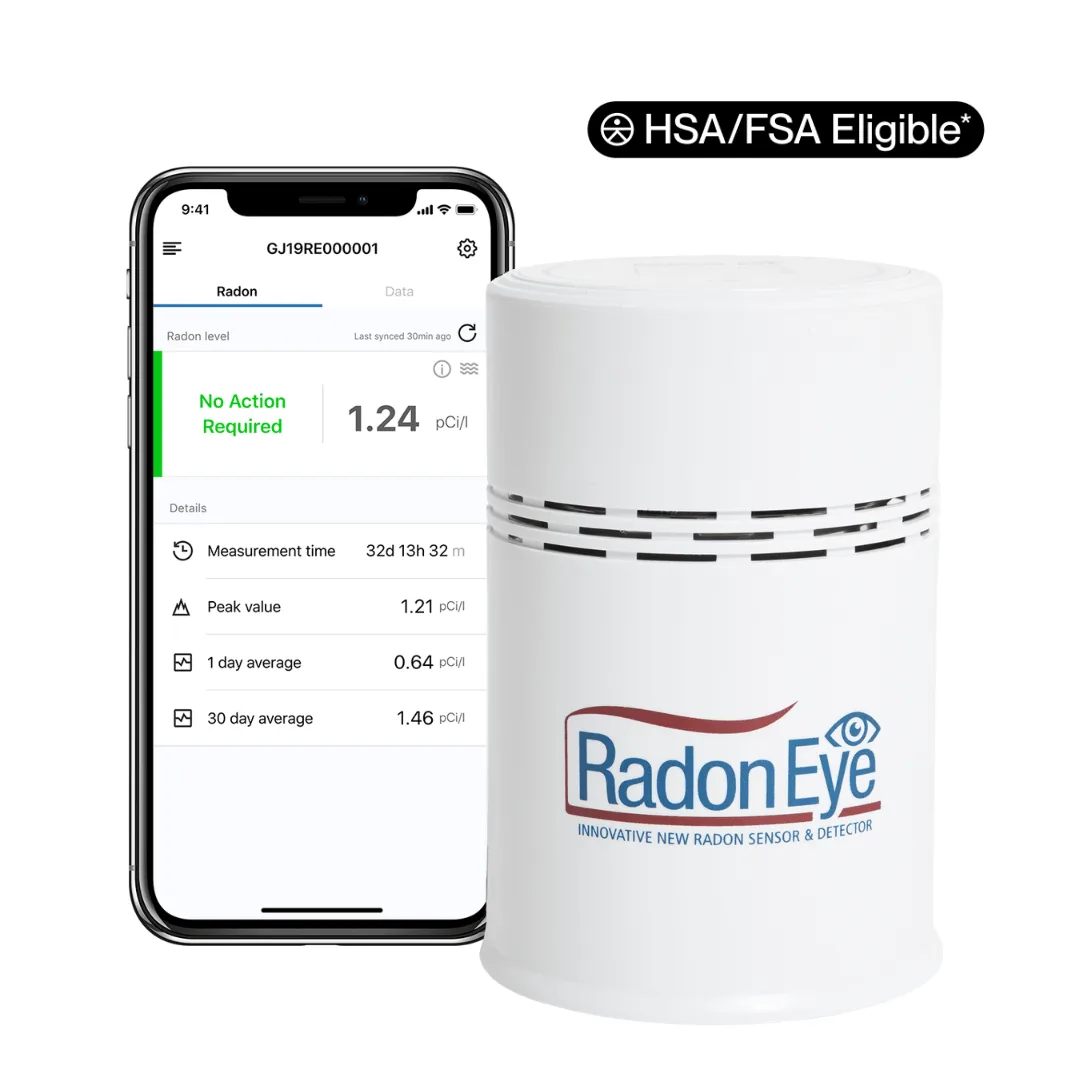
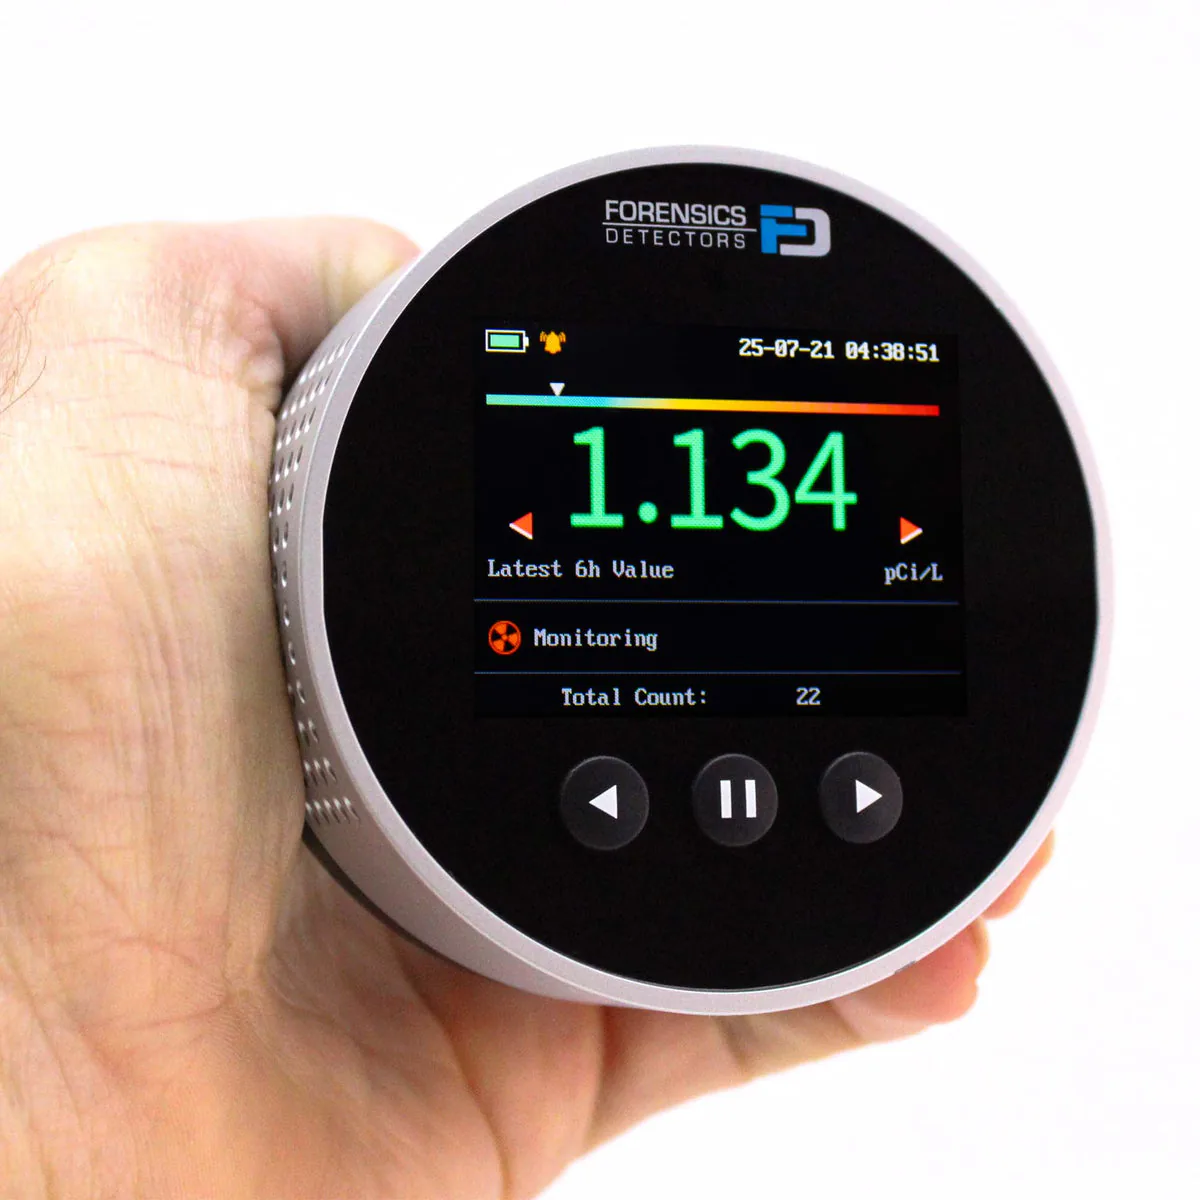
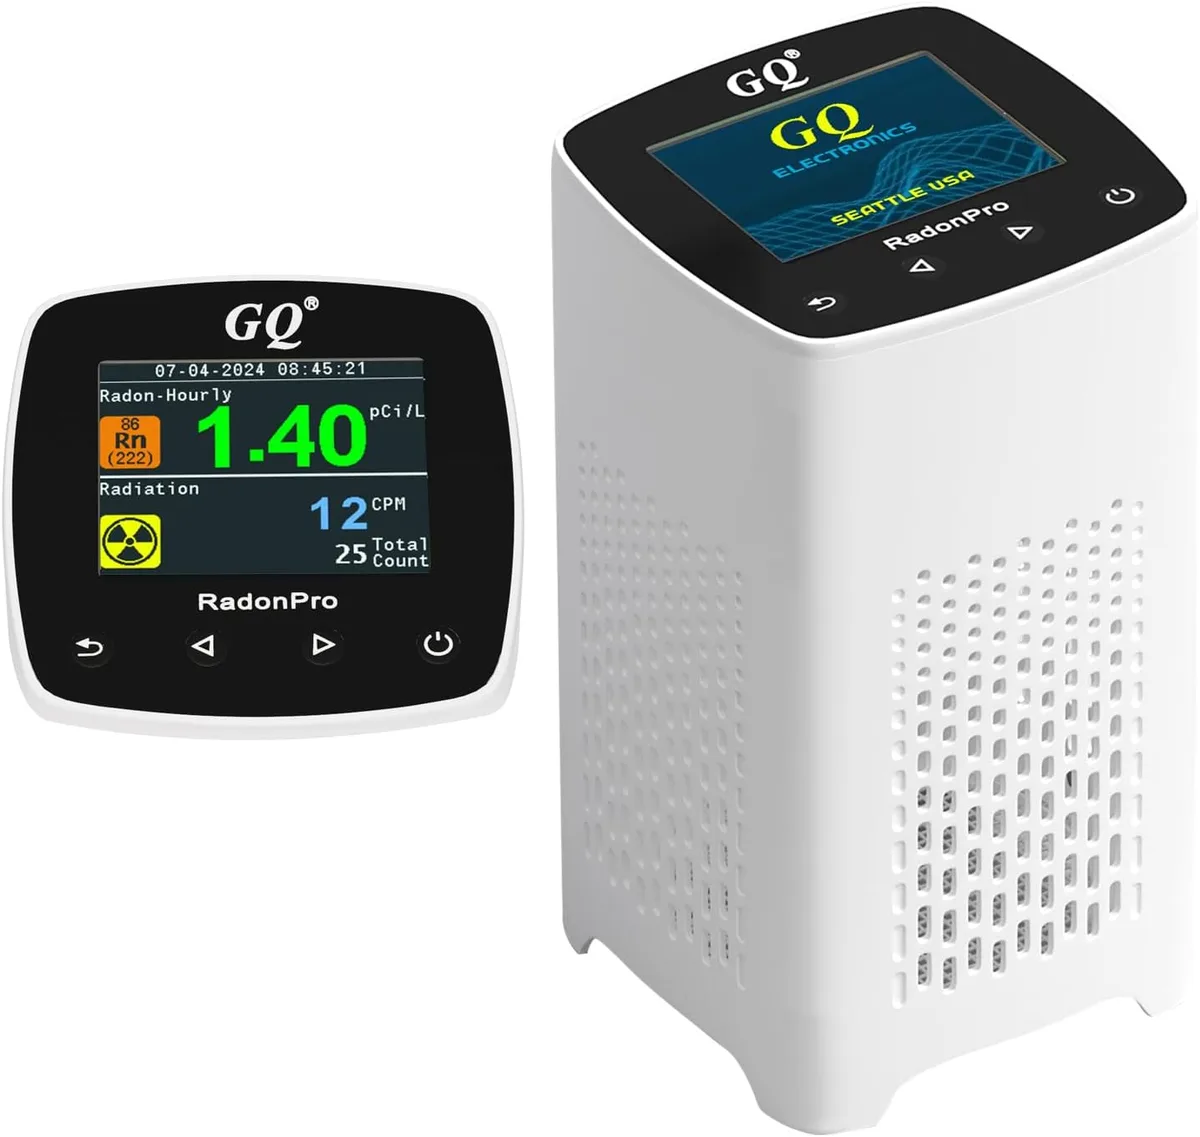
- Continuous monitorsPowered devices that log radon on a repeating cycle, often used for transaction tests.
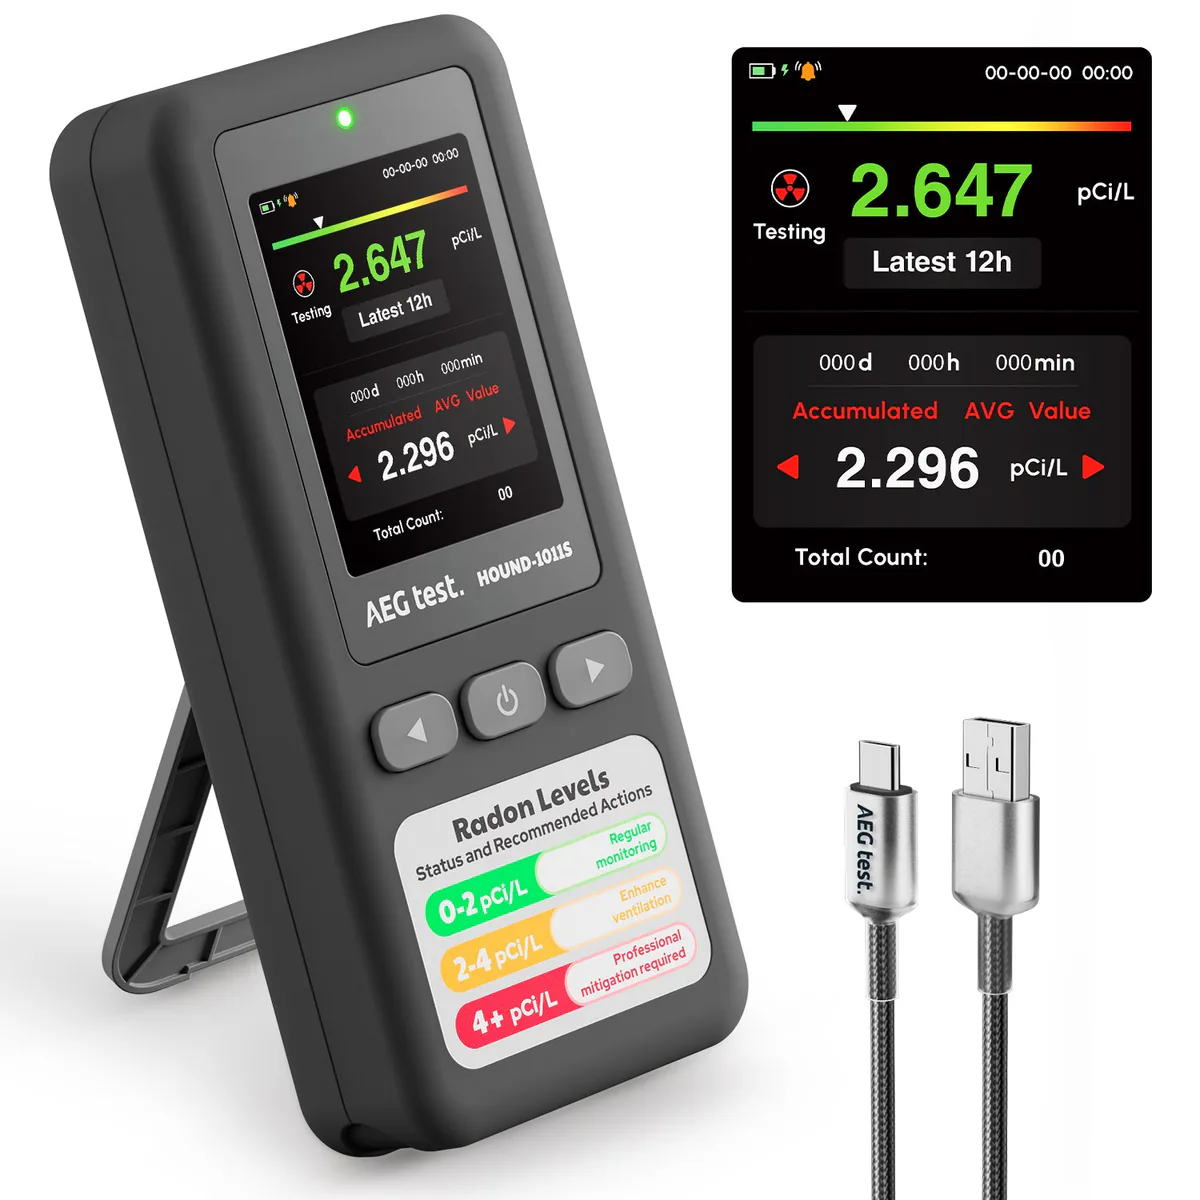
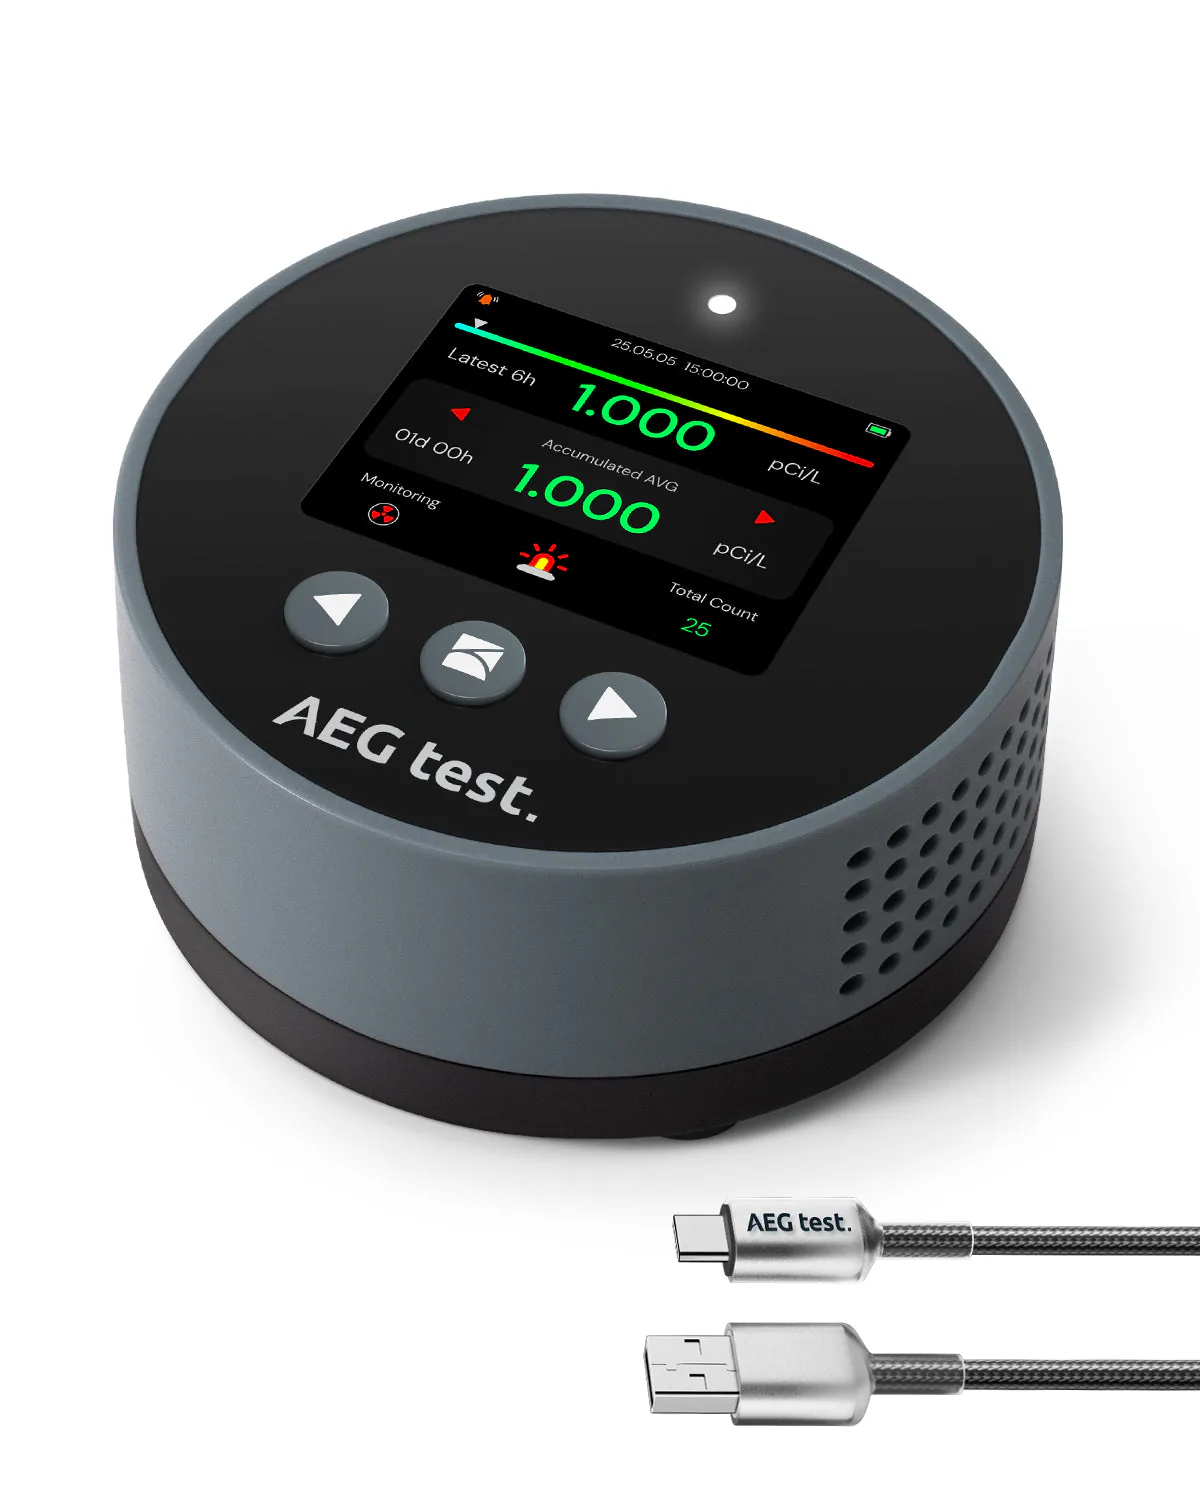
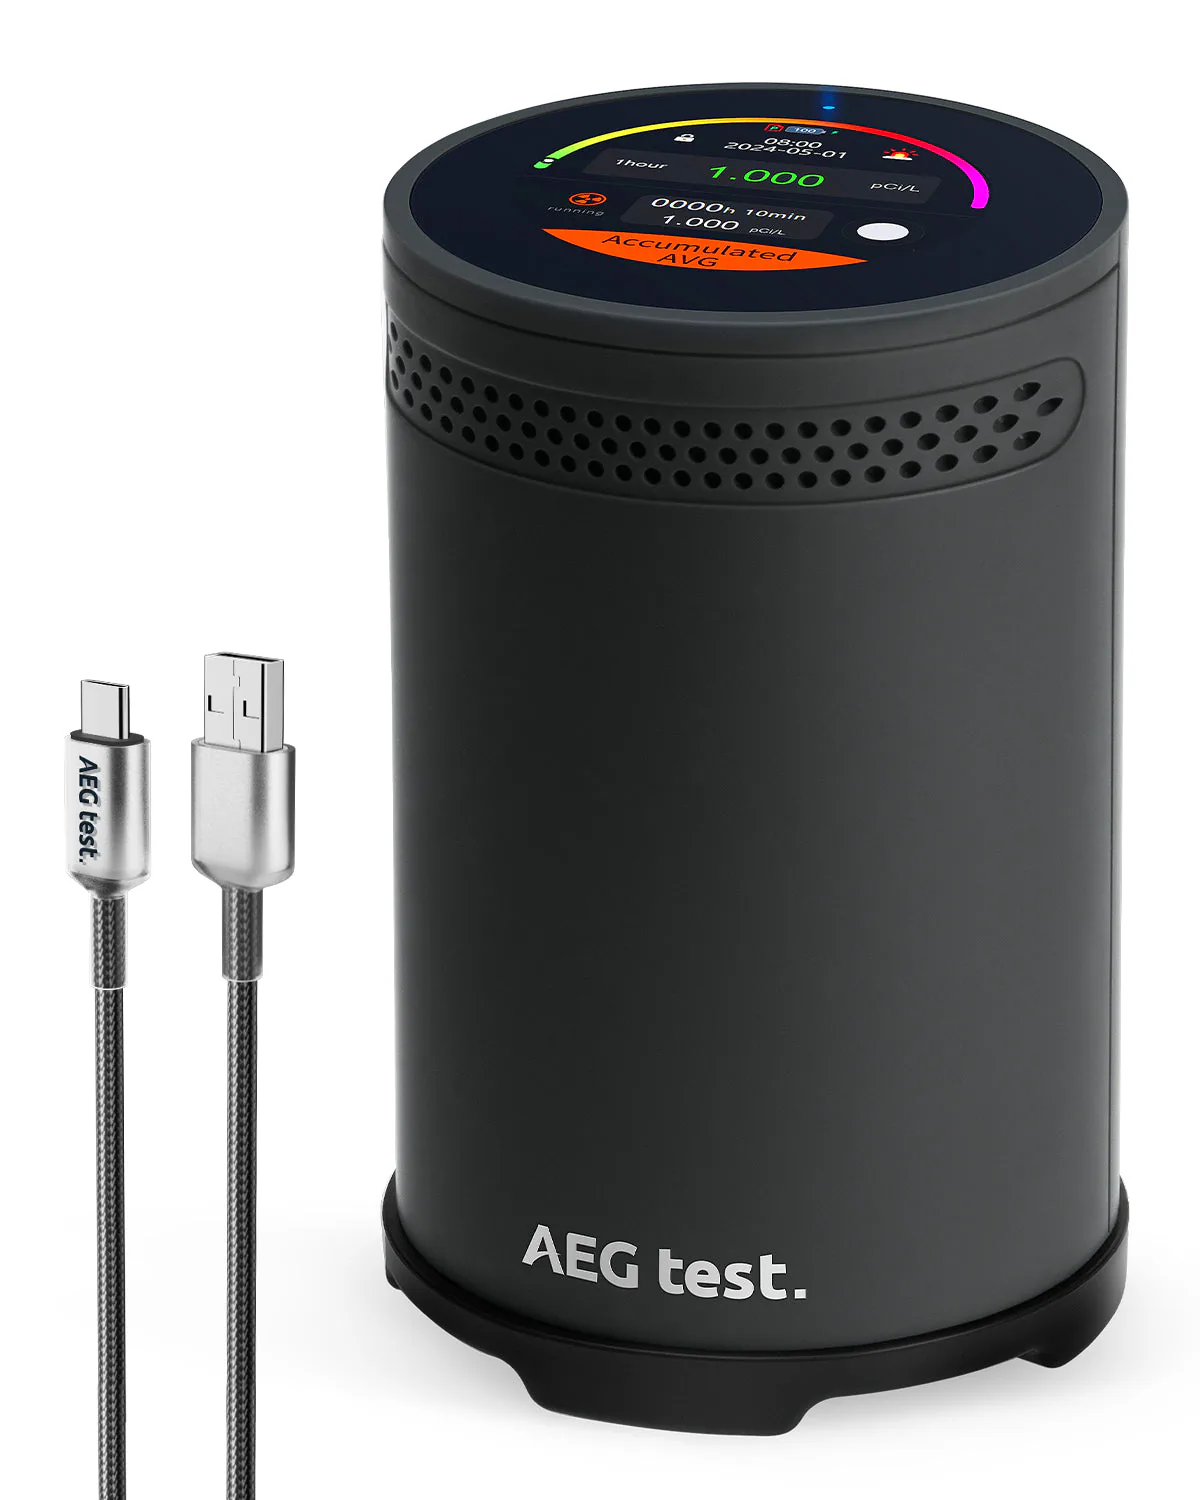
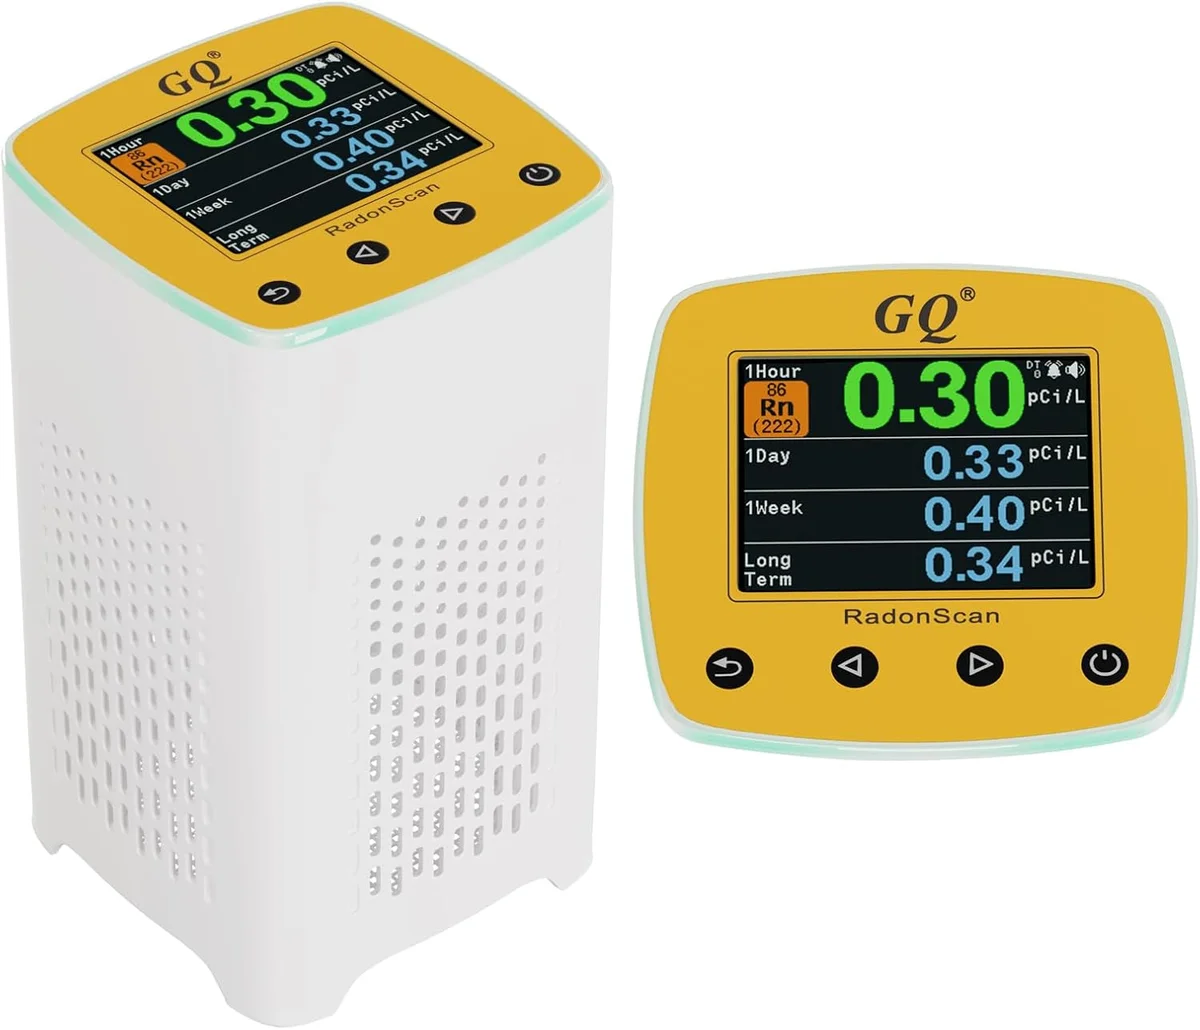
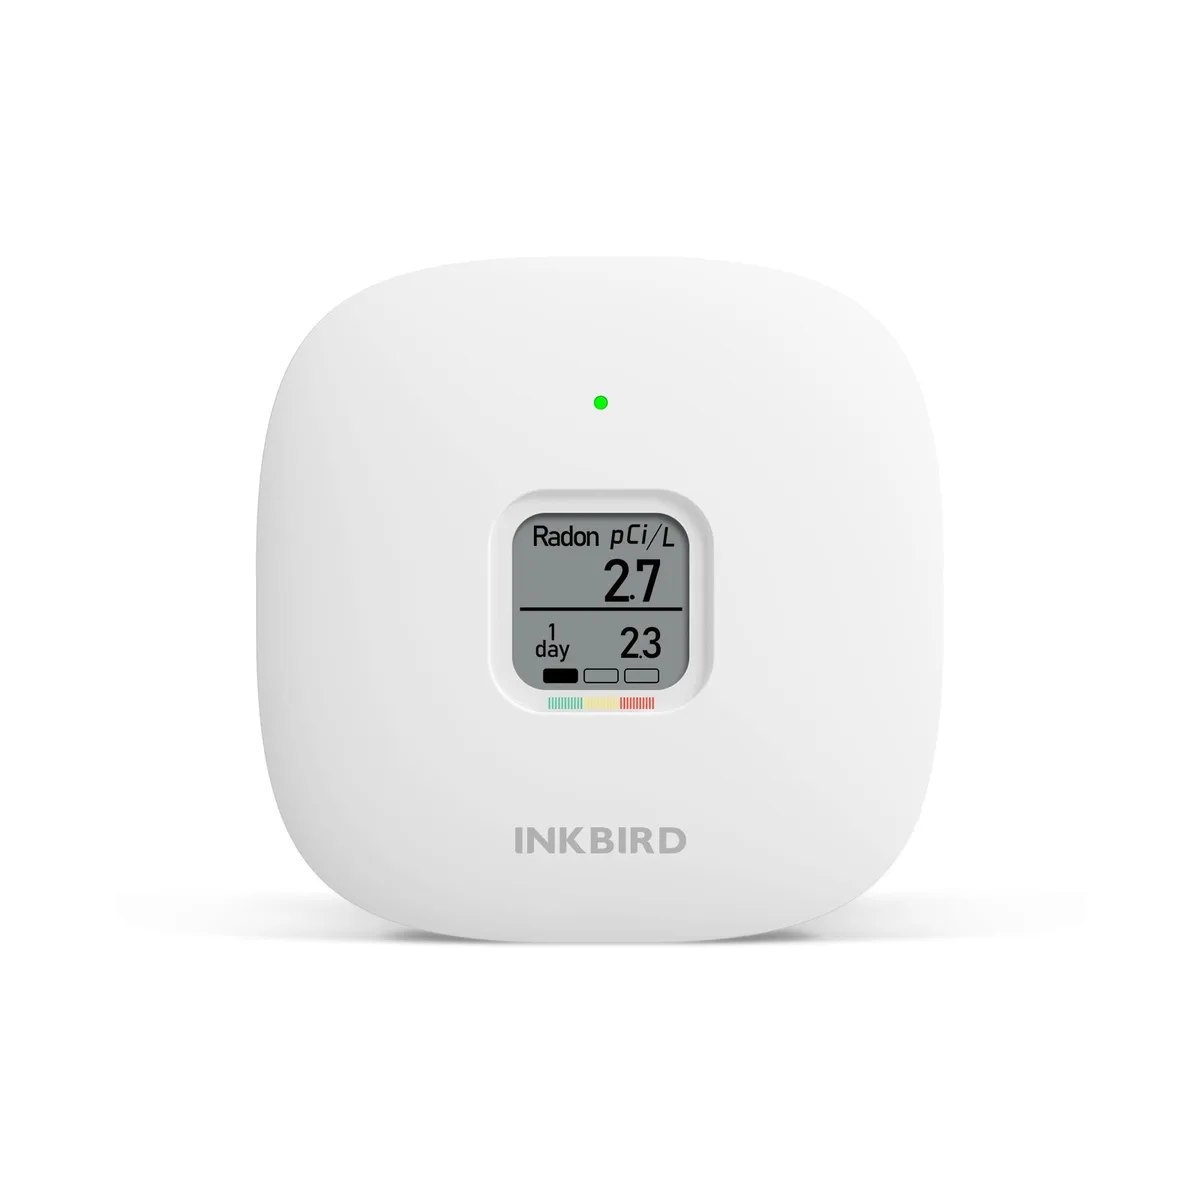
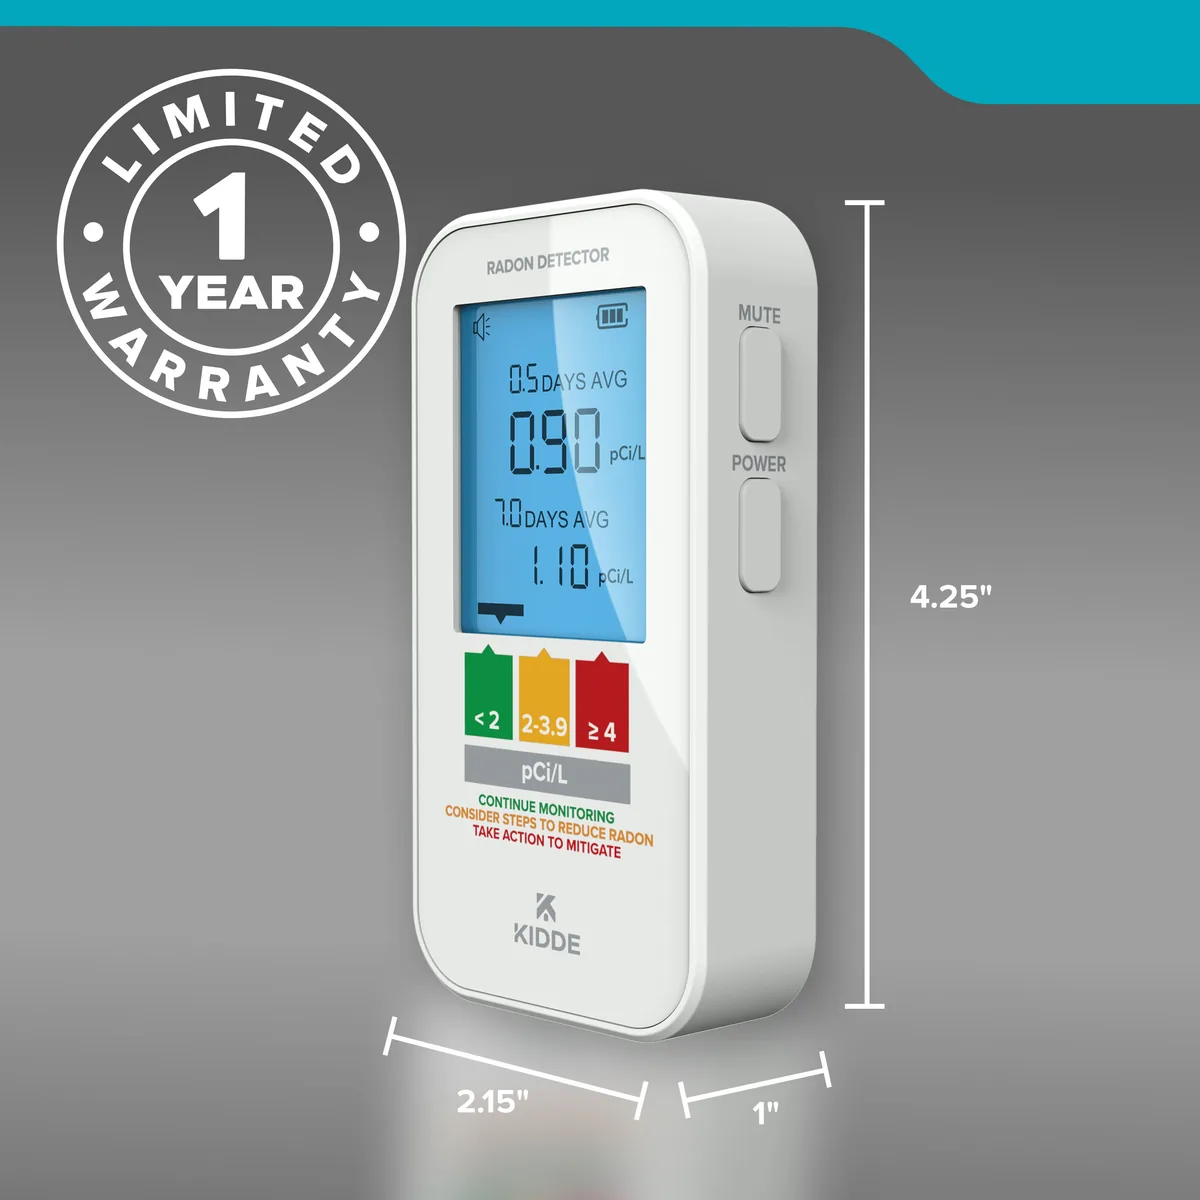
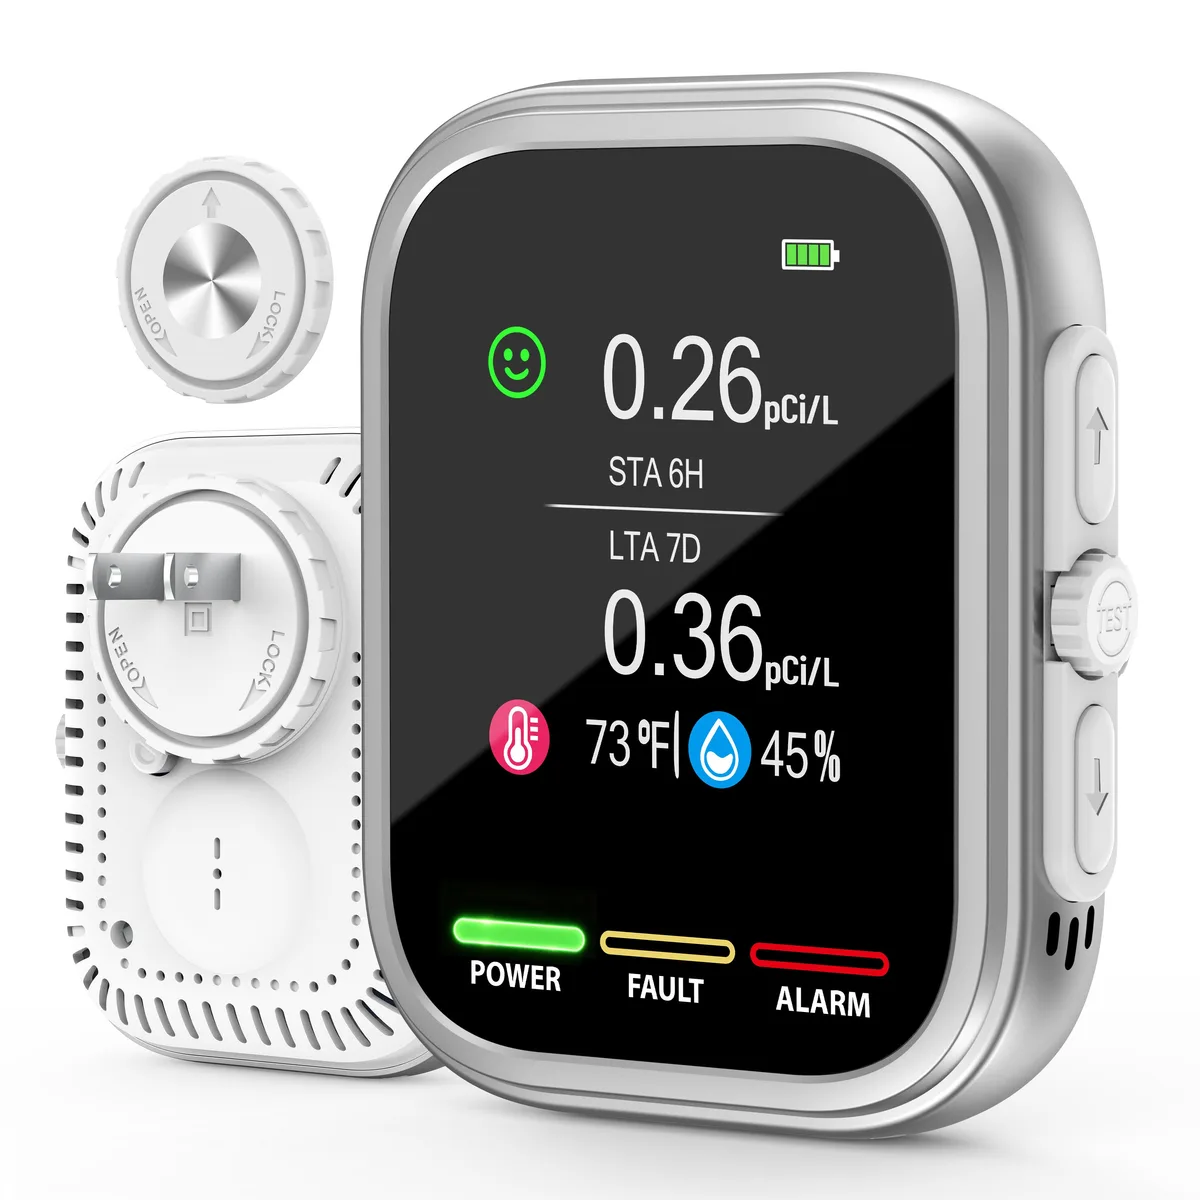
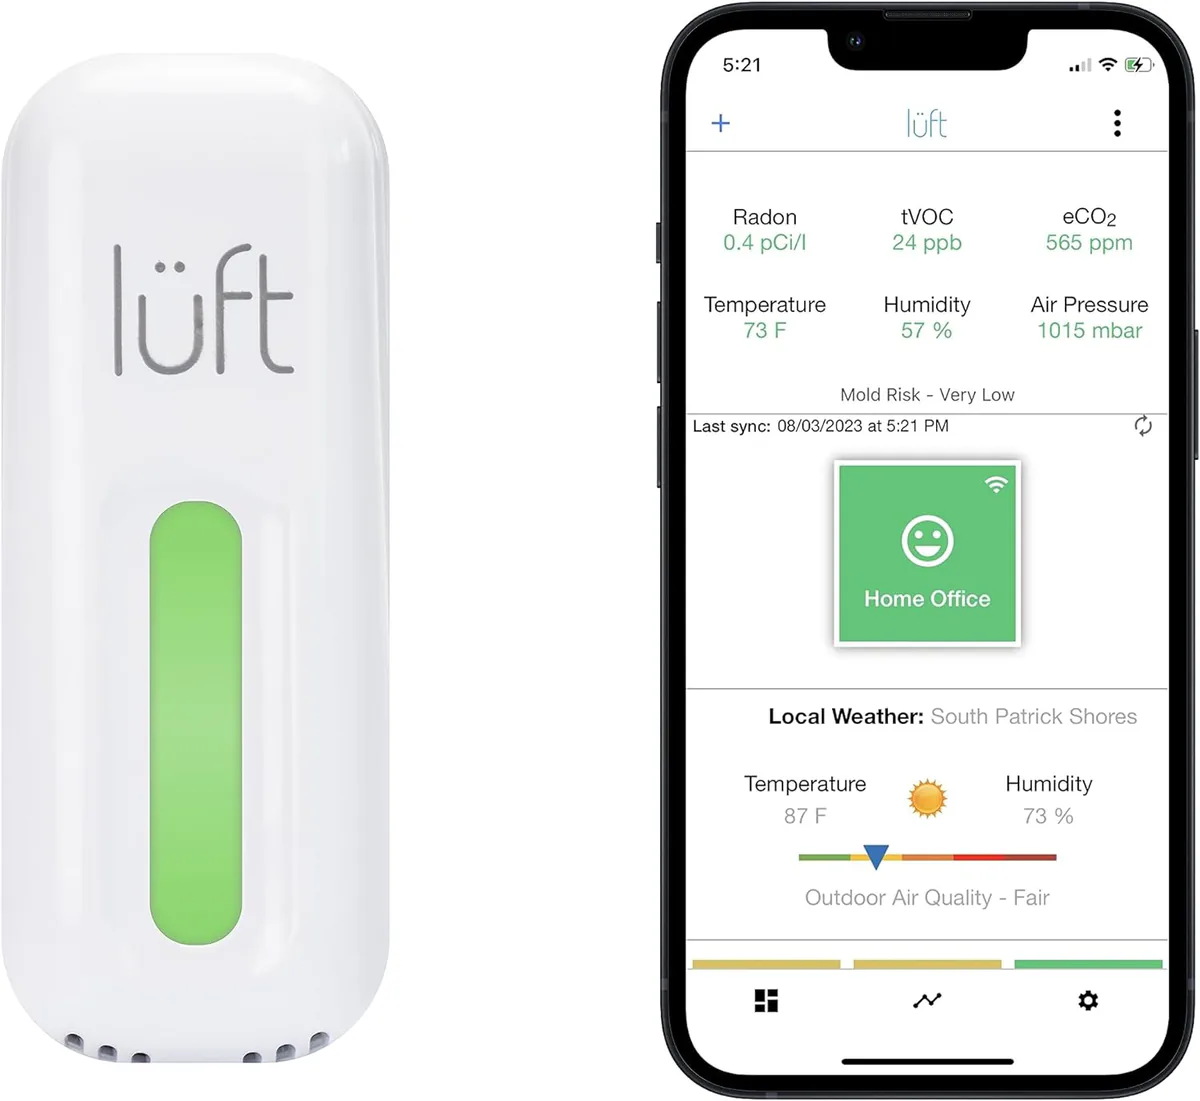
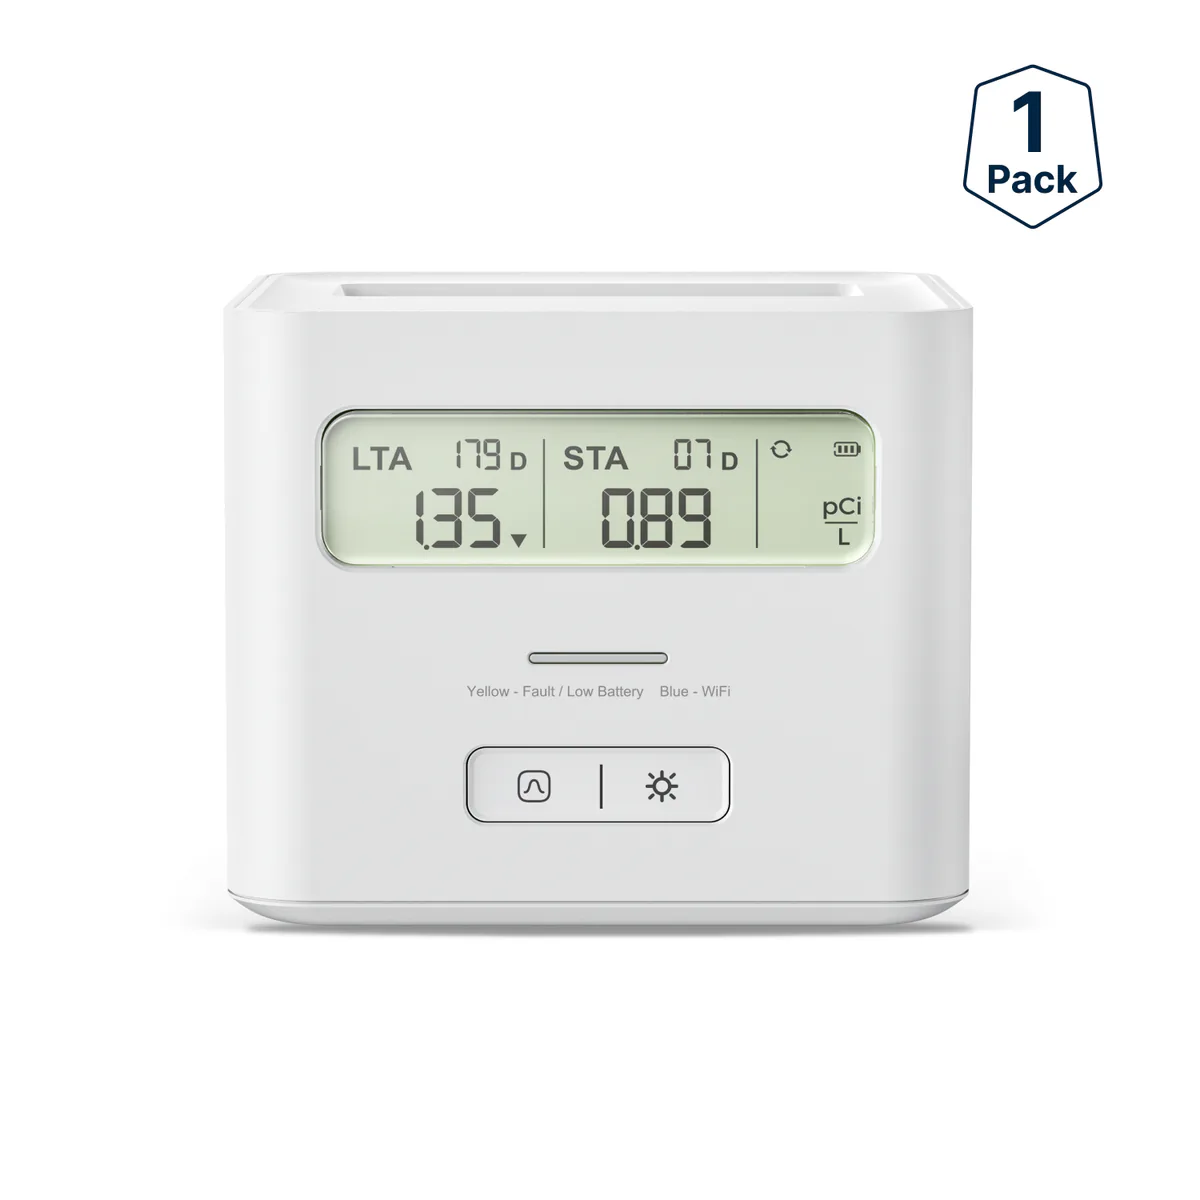
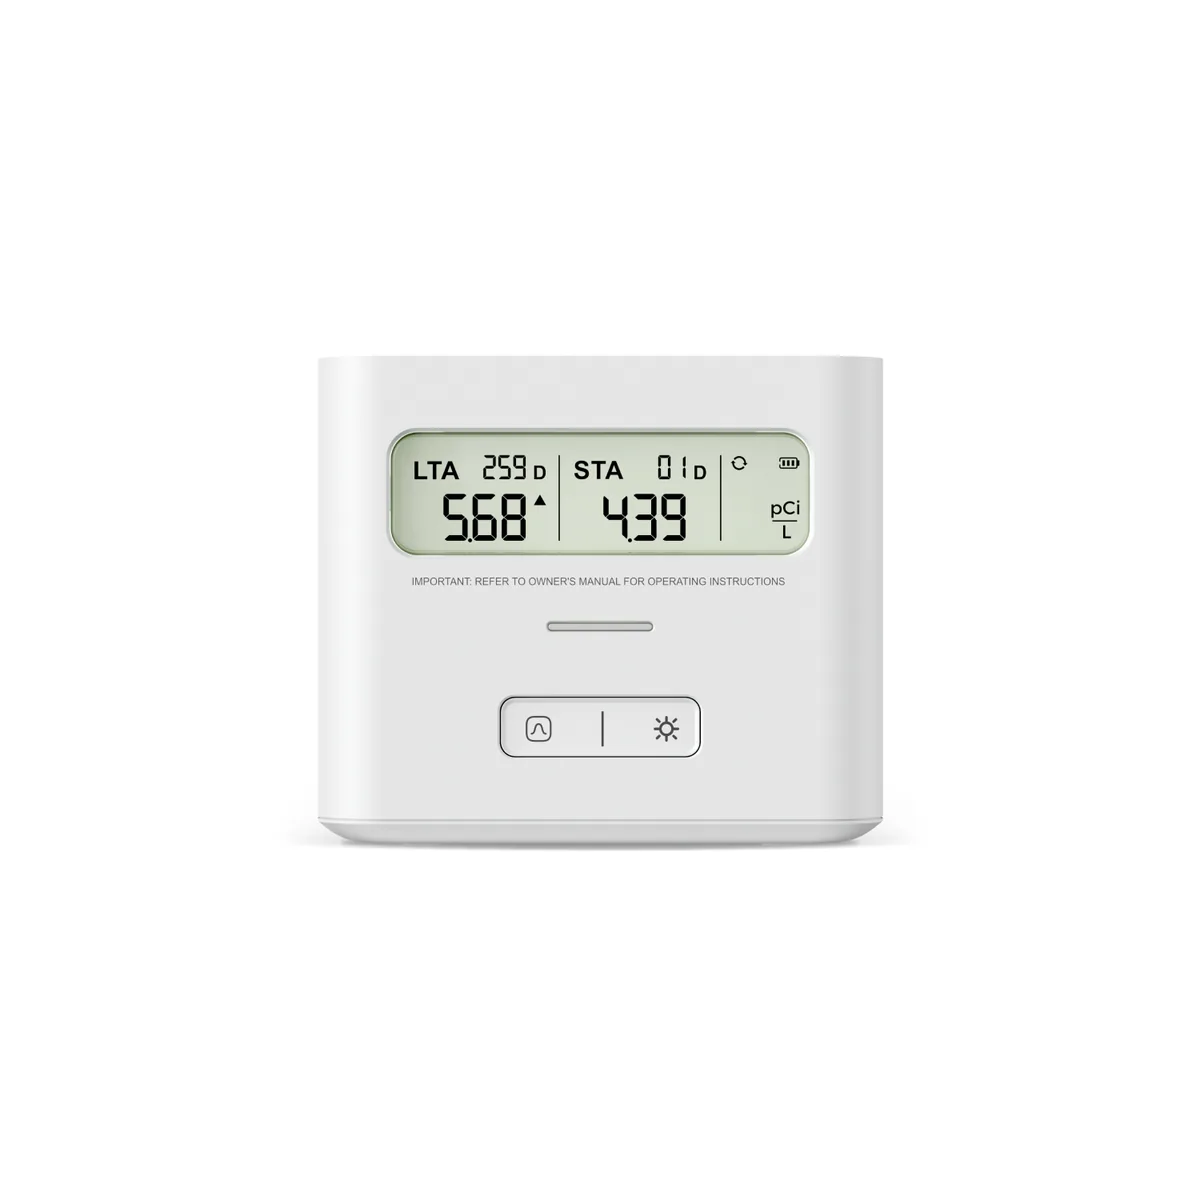
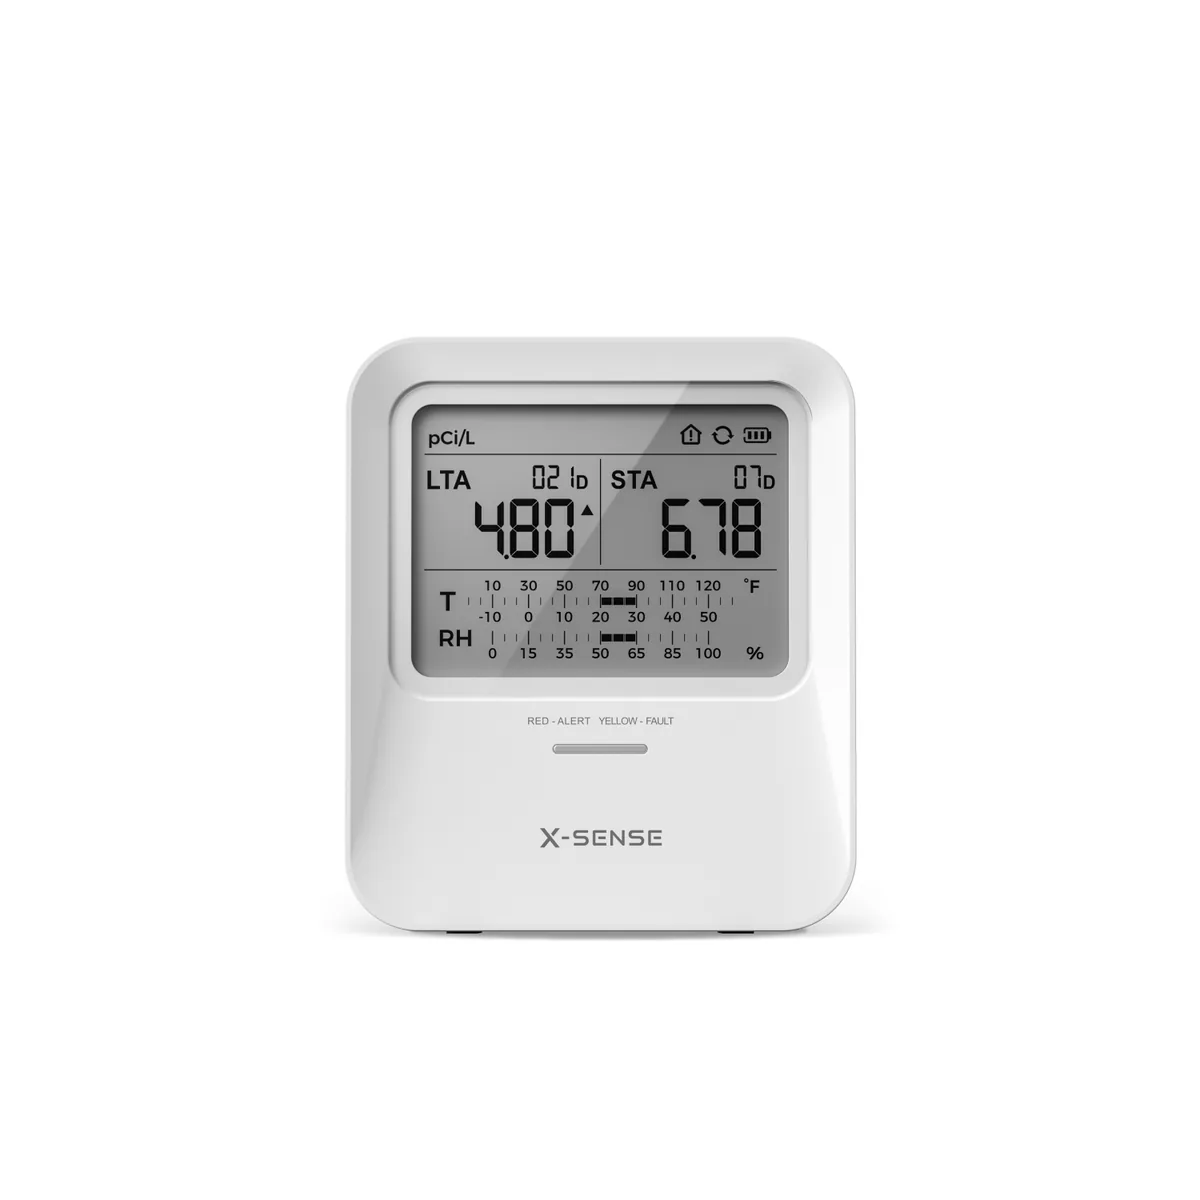
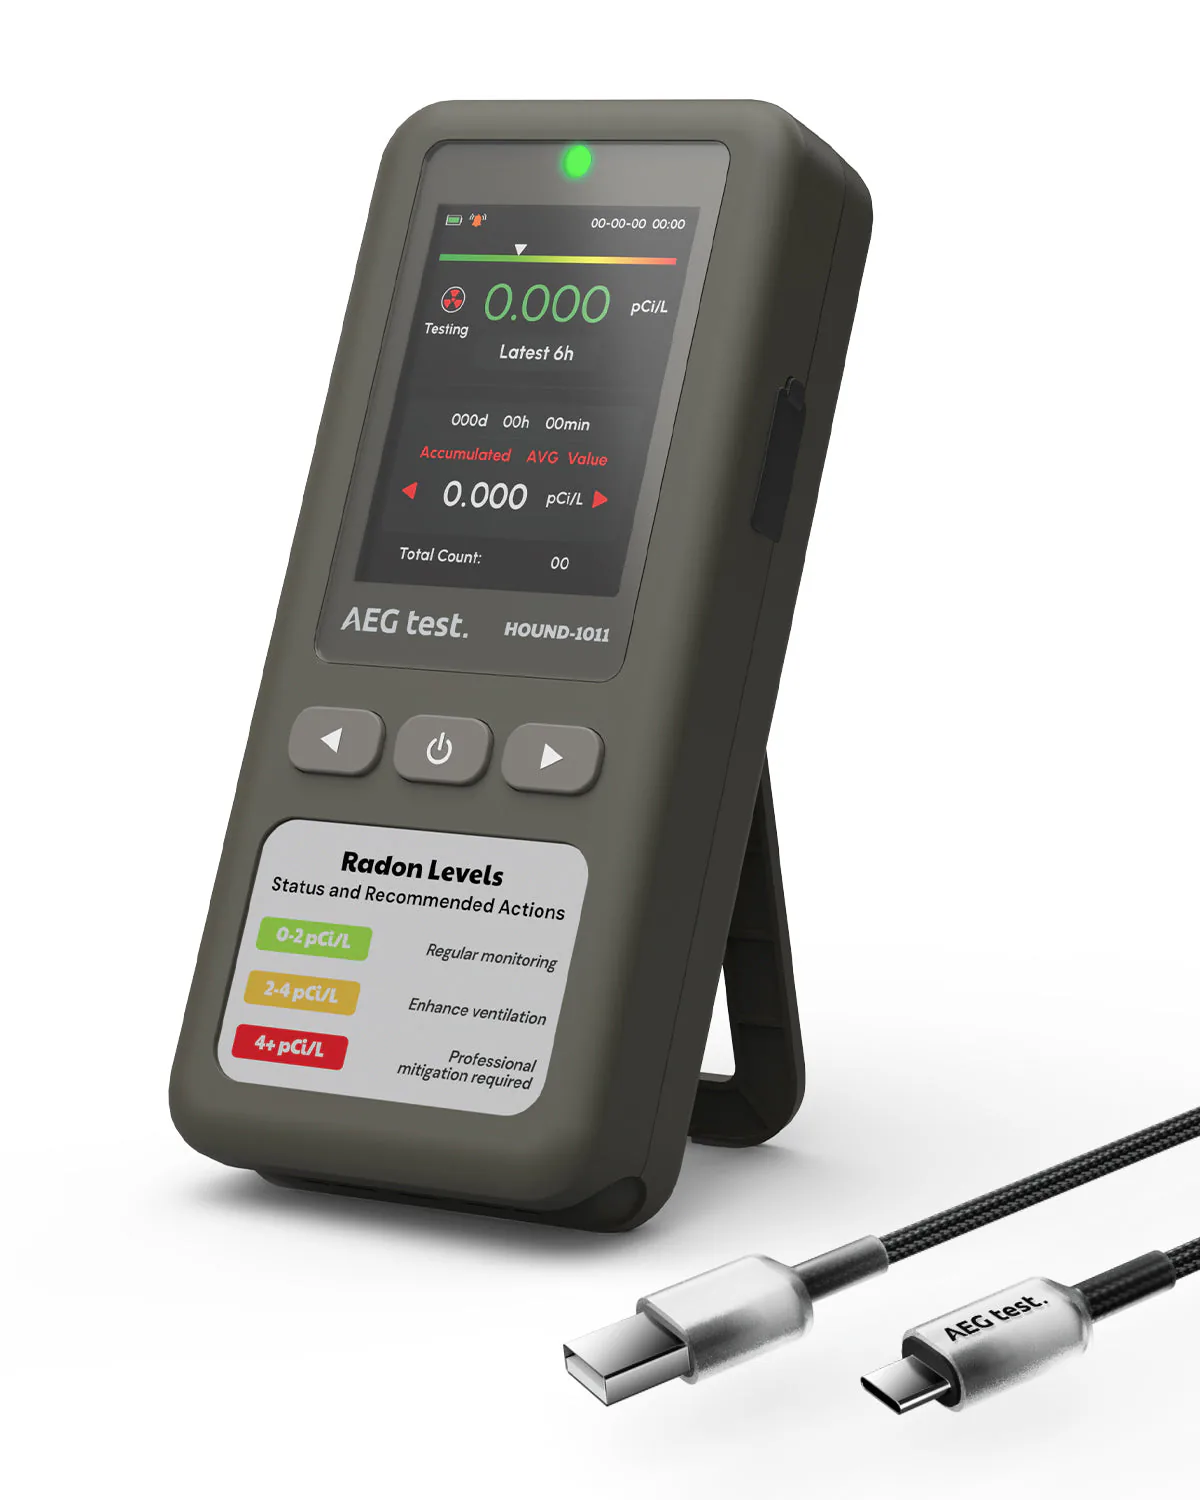
- Digital detectorsConsumer devices that display a running radon reading without a lab.
- Water radon testsKits for radon dissolved in well water, analyzed by a lab.
Mitigation
- Mitigation fansThe inline fan that keeps a soil depressurization system running, sized by the installer.
- System indicatorsU-tube manometers and fan alarms that show whether a mitigation system is still working.
- Sealing materialsCrack, joint and sump sealing used alongside a mitigation system, not instead of one.
Georgia / Next steps
What to do next
Learn
Know what radon is
What radon is, how it gets indoors, and why a county zone is not a reading for your home.
Learn about radonTest
Test the building you live in
Short-term or long-term, where the device goes, and closed-house conditions.
How to testFix
Bring a high level down
How a mitigation system works, and the retest that confirms it.
How mitigation worksFind a pro
Hire a certified professional
Measurement and mitigation professionals by state, with their certifications.
Find a professional
Informational. Follow EPA guidance. EPA says all radon tests should be taken for a minimum of 48 hours, with windows and doors closed from 12 hours before a short-term test.