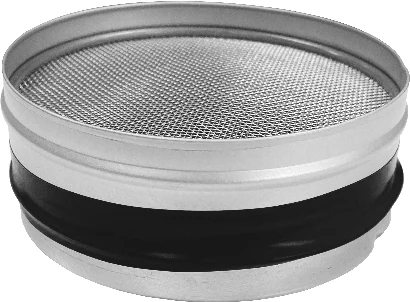
Short-term kit
PicoCan short-term charcoal canister radon test
- Lab fee included
Method: Charcoal
In home: 48 to 96 hours
Locations and reports
EPA puts Monroe County in Zone 2, its middle radon zone, and 22.5% of its 213 reported radon tests (2023) were at or above 4 pCi/L. Homes with elevated levels occur in all three zones, so only a test measures yours.
Data checked By Radon411Methodology
Share at 4+ pCi/L
22.5%
13.2 pts below WI
213 tests, 2023
Median result
2.2pCi/L
Below action level
Midpoint of the tests, 2023
Tests reported
213
28th of 69 by tests
Reported to CDC before any fix, 2023
EPA radon zone
Zone 2
Moderate potential
1 highest, 3 lowest
EPA predicts 2 to 4 pCi/L indoors
Rank in Wisconsin
58 of 69
Lowest quarter
By share, of 69 with 30+ tests
Read a result for Monroe County
EPA’s own thresholds; the figures are the area’s, never this home’s.
EPA’s reading of 2.2 pCi/L
Between 2 and 4 pCi/L
This result is between 2 and 4 pCi/L. EPA recommends considering a fix when the level is between 2 and 4 pCi/L. Monroe County's median reported result, 2023.
The data
Monroe County, At a glance
Predicted: EPA radon zone
Monroe County is a
USGS geologic potential: Moderate across 91% of the county's area
Predicted: EPA Map of Radon Zones
Measured: tests reported to CDC
| Year | Share of reported tests at or above 4 pCi/L |
|---|---|
| 2014 | 46.8% |
| 2015 | 41.7% |
| 2016 | 34.8% |
| 2017 | 28.3% |
| 2019 | 26.8% |
| 2020 | 15.5% |
| 2021 | 24.5% |
| 2022 | 23.3% |
| 2023 | 22.5% |
2023: 22.5%. Across these years the share ran from 15.5% to 46.8%. Each column counts radon tests reported to CDC that year, not homes.
These are the 213 tests reported to CDC for Monroe County over 2023, many from homes being sold or already suspected of a problem: they describe the county's reported tests, not this house.
Measured: CDC tracking data. Figure above: 2023. Measured data period: 2005 to 2023 (every CDC figure on file).
Monroe County, Compared
Monroe County's 213 reported tests in 2023 had a middle value of 2.2 pCi/L and a maximum of 24.4 pCi/L, and 22.5% reached 4 pCi/L. Wisconsin as a whole (72 Wisconsin counties, pooled) comes to 35.7%: 13.2 points higher than here.
Among its state's counties it ranks 58th of 69 Wisconsin counties with 30 or more tests for the same period. Statewide for the same period, Langlade County reported the highest share (65.8%) and Bayfield County the lowest (5.7%).
Below the action level, 103 tests (48.4%) came in under 2 pCi/L, against 41.4% statewide, and 62 tests (29.1%) fell between 2 and 4, against 23.0% statewide. The busiest year on file was 2023, with 213 tests reported; the quietest, 2014, had 47.
EPA's 1993 zone map puts Monroe County in Zone 2, a predicted county average between 2 and 4 pCi/L. USGS geology rates 91% of the county's land moderate radon potential.
Next door, the shares run from 10.0% in Juneau County to 47.5% in Vernon County, with Juneau County below Monroe County. Over 9 years of annual figures the share fell 24.3 points, from 46.8% in 2014 to 22.5% in 2023; its peak was 46.8% in 2014.
CDC also counts 5 tests taken after mitigation in Monroe County for the same period: tests in homes where a fix was already in.
| Year | Tests | Monroe County, at or above 4 pCi/L | Wisconsin, pooled |
|---|---|---|---|
| 2014 | 47 | 46.8% | 51.1% |
| 2015 | 127 | 41.7% | 51.6% |
| 2016 | 158 | 34.8% | 45.2% |
| 2017 | 159 | 28.3% | 44.8% |
| 2019 | 205 | 26.8% | 42.9% |
| 2020 | 193 | 15.5% | 27.0% |
| 2021 | 106 | 24.5% | 39.9% |
| 2022 | 133 | 23.3% | 42.9% |
| 2023 | 213 | 22.5% | 35.7% |
Pooled shares: Radon411's sum of CDC's county counts for one period.
Monroe County, Geology
Most of the ground under Monroe County is one class on USGS's geologic map: 91.2% of its land is moderate radon potential, with 8.8% high. The map puts 91.2% of Monroe County in the area it calls Driftless Area and 8.8% in Driftless Area. USGS gives the first a radon index of 10, in the moderate band (9 to 11), and the second 12, in the high band (12 to 17).
| Area | The rock, in USGS's words | Potential | Radon index | Share of land |
|---|---|---|---|---|
| Driftless Area | Cambrian sandstone. | Moderate | 10 | 91.2% |
| Driftless Area | Cambrian sandstone and Ordovician limestone and dolostone. | High | 12 | 8.8% |
Names, descriptions and indexes: U.S. Geological Survey, Geologic Radon Potential Map (2025). Shares: Radon411, from the map cut to the boundary.
Wisconsin as a whole has more high-potential ground than Monroe County: 34.8% of its land, against 8.8% here. Of the 4 counties that border it, 2 have more high-potential ground, Vernon County the most at 83.1%.
The map rates the ground, not the air in any home.
Local help
Monroe County, Local resources
We recommend starting with your regional Radon Information Center since many centers provide test kits for free or reduced cost, and often with laboratory fees covered.
The State of Wisconsin does not require contractors performing radon measurement or mitigation work to be state licensed or nationally certified.
What it means
Monroe County, Questions
In 2023, 22.5% of the radon tests reported to CDC for Monroe County, Wisconsin were at or above 4 pCi/L, and the median reported pre-mitigation result was 2.2 pCi/L. Of 69 Wisconsin counties with 30 or more tests for the same period, 57 reported a higher share; pooled, the state comes to 35.7%.
Monroe County borders 4 counties: Juneau County, Vernon County, La Crosse County and Jackson County.
Products
Monroe County, Products
In Monroe County, 22.5% of 213 tests reported to CDC in 2023 reached 4 pCi/L, against 35.7% pooled across Wisconsin. In Zone 2 a short-term kit (2 to 90 days) is the quick first check in Monroe County; a long-term test tells the year-round average.
Short-term kit
Method: Charcoal
In home: 48 to 96 hours

Long-term kit
Method: Alpha track
In home: 90 days to 12 months
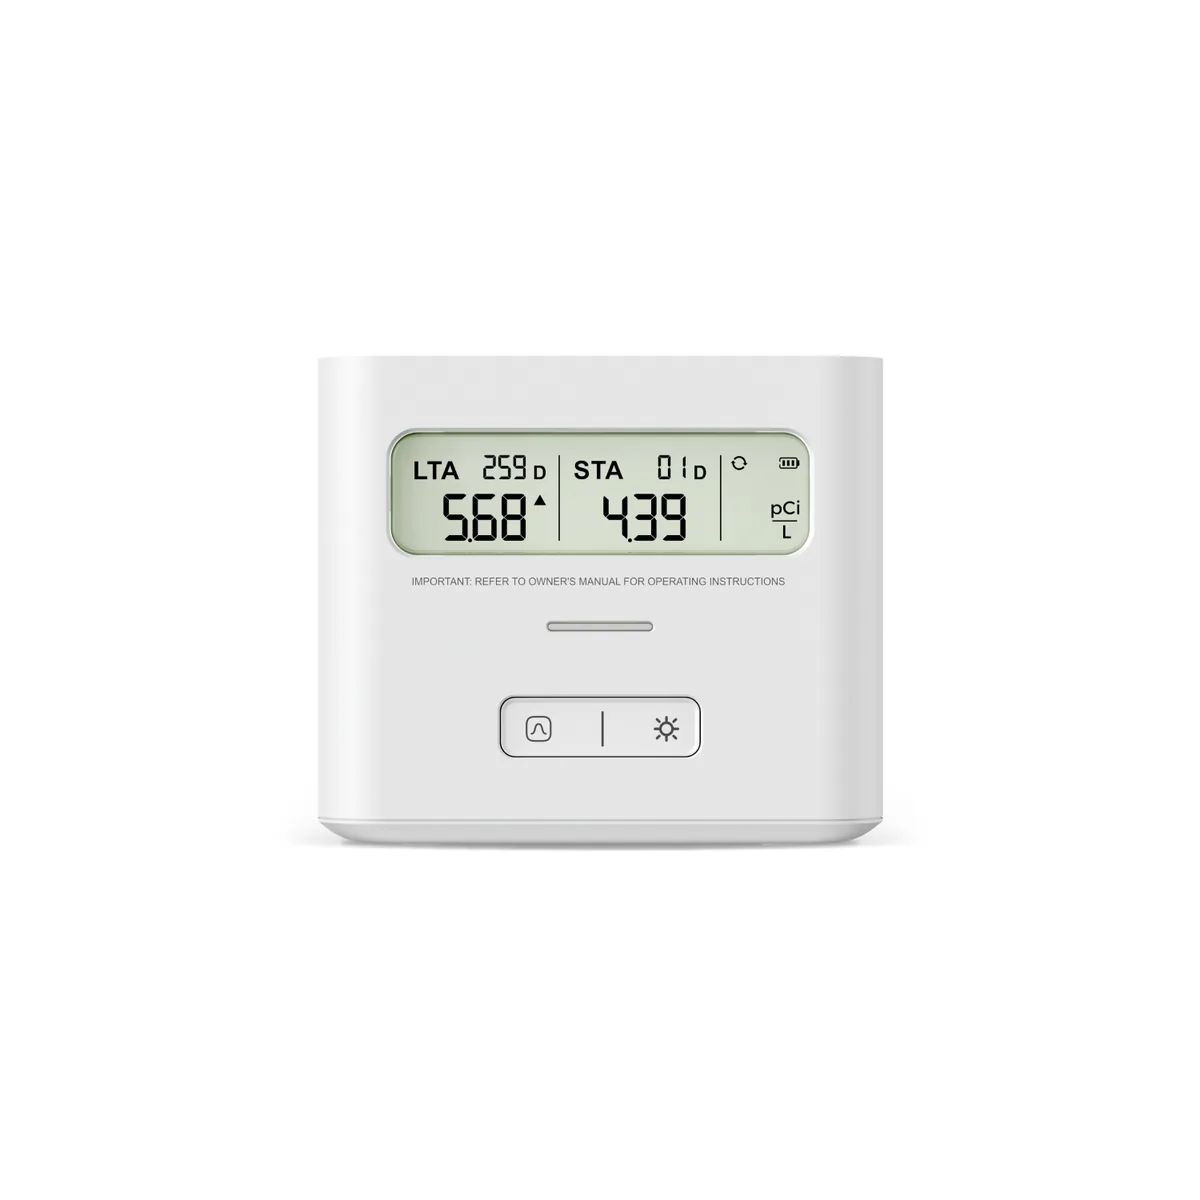
MonitorX-Sense
Method: Alpha spectrometry
First reading: Within 24 hours
Test kits and monitors: 1 of 3
Explore
Monroe County, Bordering counties
47.5%at or above 4 pCi/L
Median 3.8 pCi/L · 162 tests · 25.0 points above Monroe County
38.7%at or above 4 pCi/L
Median 3.2 pCi/L · 93 tests · 16.2 points above Monroe County
31.4%at or above 4 pCi/L
Median 2.7 pCi/L · 771 tests · 8.9 points above Monroe County
10.0%at or above 4 pCi/L
Median 1.1 pCi/L · 50 tests · 12.5 points below Monroe County
Monroe County, Cities and towns
The Census Bureau estimates 46,572 residents in Monroe County for July 1, 2025, 265 more than in 2020 (+0.6%). That works out to 52 people per square mile of land. Its largest town, Sparta, has 9,974 residents, 21.4% of the total. CDC's 213 reported tests for 2023 work out to 4.6 per 1,000 residents (2025 estimate), close to Wisconsin's 3.5.
From Sparta to Melvina, CDC publishes no figure by town: each reads Monroe County's.
| Place | Residents | Since 2020 | Share of residents |
|---|---|---|---|
| Sparta | 9,974 | −0.6% | 21.4% |
| Tomah | 9,600 | +0.4% | 20.6% |
| Cashton | 1,174 | +1.2% | 2.5% |
| Rocklandextends beyond Monroe County | 754 | −2.0% | Counted whole |
| Norwalk | 604 | −1.0% | 1.3% |
| Warrens | 534 | −0.2% | 1.1% |
| Ontarioextends beyond Monroe County | 528 | −0.8% | Counted whole |
| Wilton | 523 | −1.7% | 1.1% |
| Kendall | 465 | −2.5% | 1.0% |
| Oakdale | 307 | +2.0% | 0.7% |
| Wyeville | 117 | −4.1% | 0.3% |
| Melvina | 94 | +2.2% | 0.2% |
12 incorporated places, as listed in the U.S. Census Bureau’s 2020 place reference files. Residents: U.S. Census Bureau population estimates for July 1, 2025 (Vintage 2025). A place that extends beyond Monroe County is counted whole, so it has no share.
Monroe County, Homes
Of Monroe County's 19,918 homes, 73% are detached houses, against 66% across Wisconsin; 8% are in buildings of five or more homes. Half of its homes were built before 1980, close to Wisconsin's 1975: 31% date from before 1960 and 23% from 2000 or later. 72% of occupied homes are lived in by their owner (Wisconsin: 68%); in the rest a tenant can run a test, but a fix is the landlord's to make.
| Homes | Monroe County | Wisconsin |
|---|---|---|
| Housing units | 19,918 | 2,750,750 |
| Detached houses | 73% | 66% |
| In buildings of 5 or more | 8% | 17% |
| Mobile homes | 8% | 3% |
| Built before 1960 | 31% | 34% |
| Built since 2000 | 23% | 20% |
| Middle year built | 1980 | 1975 |
| Owner-occupied | 72% | 68% |
Census Bureau, American Community Survey, 2019 to 2023: estimates from a sample of homes, looser for a small place. Shares by Radon411.