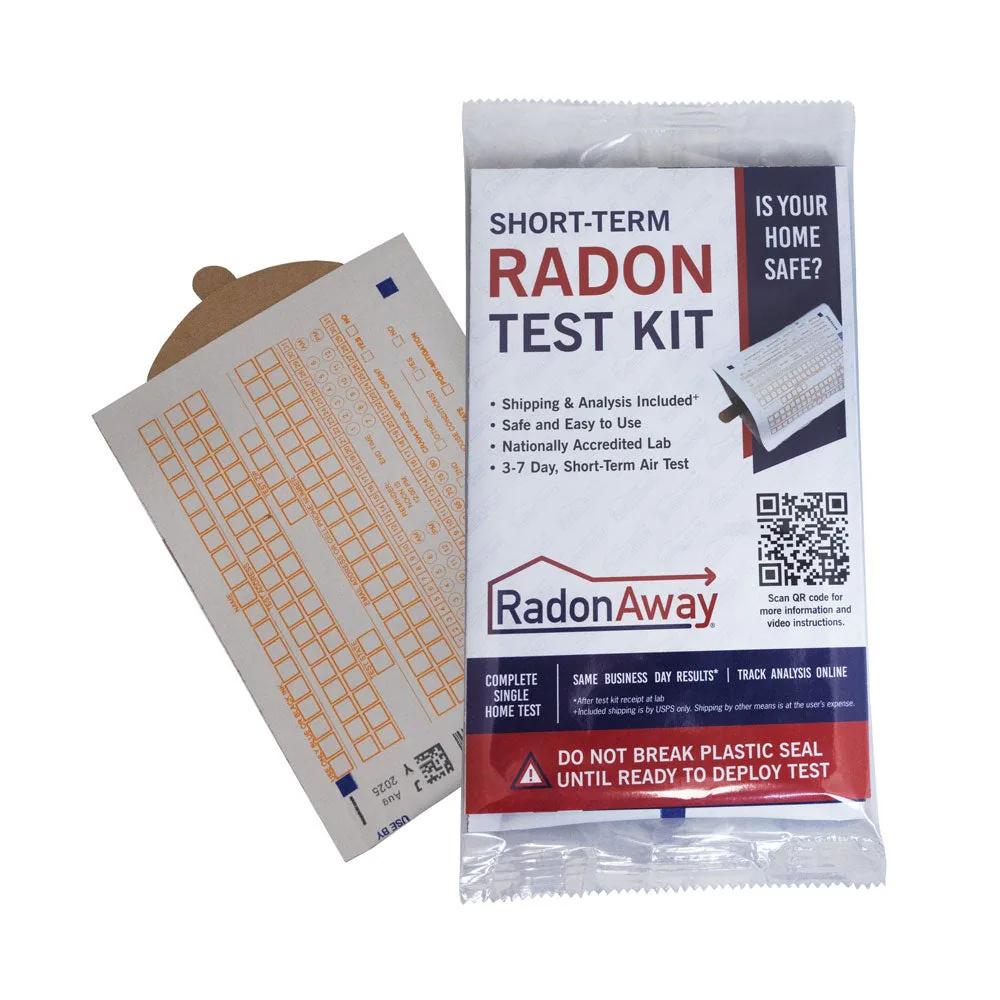
Short-term kit
Air Chek Short-Term radon test kit you hang, lab fee included
- Lab fee included
In home: 72 to 168 hours
Locations and reports
EPA puts Isle of Wight County in Zone 3, its lowest radon zone, and only 3 radon tests from it are on file with CDC (2008 to 2017, laboratory totals). Homes with elevated levels occur in all three zones, so only a test measures yours.
Data checked By Radon411Methodology
Nearest county
5.9%
Newport News city, 19 miles
Share at 4+ pCi/L, 34 tests, 2006 to 2015
Ground above low
None
77.9 pts below Virginia
Share of land USGS rates moderate or high potential
Tests reported
3
Too few for a share
2008 to 2017, laboratory
EPA radon zone
Zone 3
Lower potential
1 highest, 3 lowest
EPA predicts under 2 pCi/L indoors
Read a result for Isle of Wight County
EPA’s own thresholds; the figures are the area’s, never this home’s.
EPA’s reading of 4.0 pCi/L
At or above 4 pCi/L
This result is at or above 4 pCi/L. EPA recommends fixing a home when the radon level is 4 pCi/L or higher.
The data
Isle of Wight County, At a glance
Predicted: EPA radon zone
USGS geologic potential: Low across 99% of the county's area
Predicted: EPA Map of Radon Zones
Measured: tests reported to CDC
CDC holds 3 reported tests for Isle of Wight County over the 2008 to 2017 laboratory totals, with a median of 1.1 pCi/L: too few to describe a county (Radon411 reads a share from 30 tests up). Isle of Wight County beside the counties around it is how this page reads it.
Only 3 tests were reported to CDC for Isle of Wight County over 2008 to 2017 (laboratory totals), and tests are often run on homes being sold or already suspected of a problem: so few describe neither the county nor this house.
Measured: CDC tracking data. Figure above: 2008 to 2017, laboratory. Measured data period: 2005 to 2017 (every CDC figure on file).
Isle of Wight County, Compared
CDC's largest figure for Isle of Wight County rests on 3 tests over the 2008 to 2017 laboratory totals, 1 of them at or above 4 pCi/L, so each test moves its share by 33.3 points and no rank or comparison is drawn from it. Results reached as high as 6.1 pCi/L, with a middle value of 1.1 pCi/L.
The nearest counties with a figure are Newport News city (19 miles away) at 5.9%, Norfolk city (26 miles away) at 5.3% and Chesapeake city (28 miles away) at 7.0%. Pooled across 132 Virginia counties, 30.7% of reported tests reached that level; across every county in the country with a figure, 36.3%.
Statewide for the same period, Russell County reported the highest share (68.5%) and Norfolk city the lowest (5.3%). EPA's 1993 map puts Isle of Wight County in Zone 3, its lowest label: a predicted county average under 2 pCi/L. USGS geology rates 99% of the county's land low radon potential.
Pooled shares: Radon411's sum of CDC's county counts for one period.
Isle of Wight County, Geology
USGS's geologic map puts all of Isle of Wight County's mapped land in one class: low radon potential. 98.9% of it lies in the area the map calls Tertiary Coastal Plain Sediments, to which USGS gives a radon index of 8, in the low band (5 to 8).
| Area | The rock, in USGS's words | Potential | Radon index | Share of land |
|---|---|---|---|---|
| Tertiary Coastal Plain Sediments | Tertiary Coastal Plain sand, silt, clay | Low | 8 | 98.9% |
Names, descriptions and indexes: U.S. Geological Survey, Geologic Radon Potential Map (2025). Shares: Radon411, from the map cut to the boundary.
Across Virginia 47.9% of the land is rated high; none of Isle of Wight County's is. None of the 4 counties that border it has any moderate-potential ground either.
The map rates the ground, not the air in any home.
Local help
Isle of Wight County, Local resources
The Code of Virginia requires that Radon testers and mitigators be currently certified by either the National Radon Proficiency Program (NRPP) or the National Radon Safety Board (NRSB).
What it means
Isle of Wight County, Questions
Over the 2008 to 2017 laboratory totals, 33.3% of the radon tests reported to CDC for Isle of Wight County, Virginia were at or above 4 pCi/L, and the median reported pre-mitigation result was 1.1 pCi/L. Of the 8 nearest counties with a figure, within 60 miles, the share of tests at or above 4 pCi/L runs from 5.3% to 38.4%.
Isle of Wight County borders 4 counties: Suffolk city, Surry County, Franklin city and Southampton County.
Products
Isle of Wight County, Products
No CDC figure names Isle of Wight County; the nearest county with one, Newport News city (19 miles away), reported 5.9% of its tests at or above 4 pCi/L over the 2006 to 2015 laboratory totals, the only reading nearby until a test of this home. Zone 3 is the lowest label, yet homes at or above 4 pCi/L occur in every zone: a short-term kit (2 to 90 days) is the quick first check in Isle of Wight County.
Short-term kit
In home: 72 to 168 hours

Long-term kit
Method: Alpha track
In home: 90 days to 12 months
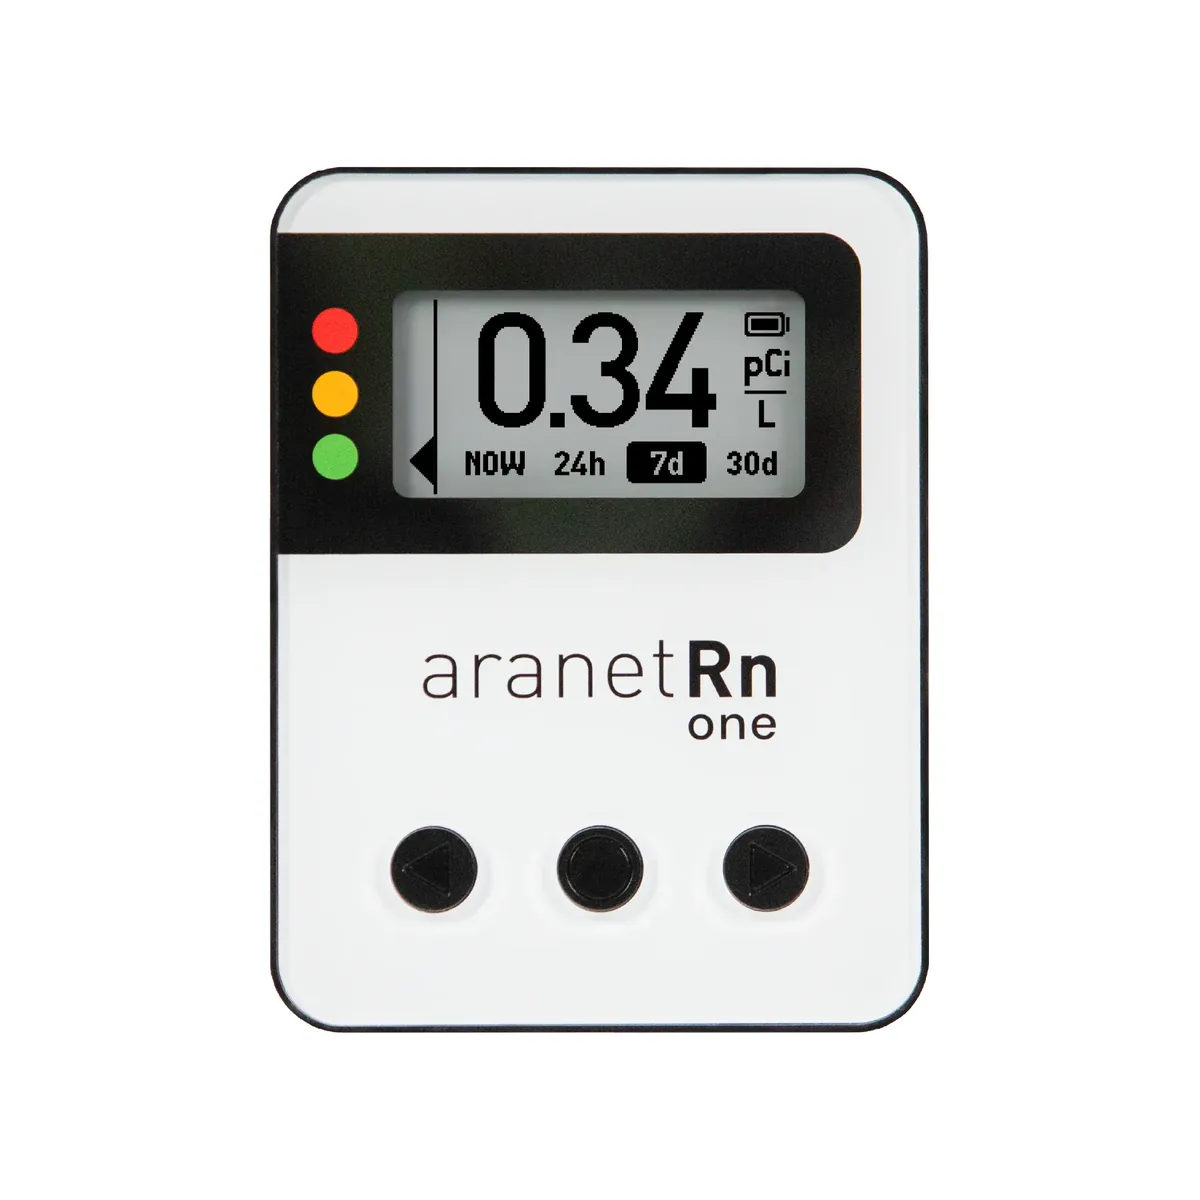
MonitorAranet
Method: Ion chamber
First reading: Within 10 minutes
Test kits and monitors: 1 of 3
Best radon monitors for Isle of Wight County homes, compared
Explore
Isle of Wight County, Bordering counties
0.0%at or above 4 pCi/L
Median 1.5 pCi/L · 5 tests
0.0%at or above 4 pCi/L
Median 0.9 pCi/L · 2 tests
0.0%at or above 4 pCi/L
Median 1.1 pCi/L · 2 tests
No CDC figure for 2006 to 2015; its page reads it against its own neighbours.
Isle of Wight County, Cities and towns
Isle of Wight County is growing: the Census Bureau puts it at 41,321 residents on July 1, 2025, up 6.7% from 38,711 in 2020. That works out to 131 people per square mile of land. Its largest town, Smithfield, has 9,112 residents, 22.1% of the total. Together its 2 incorporated places hold 29.2% of those residents; the other 70.8% live outside any of them. Reported testing is thin here: 3 tests over 2008 to 2017, or 0.1 for every 1,000 residents (2025 estimate), where Virginia as a whole comes to 6.0.
From Smithfield to Windsor, CDC publishes no figure by town: each reads Isle of Wight County's.
| Place | Residents | Since 2020 | Share of residents |
|---|---|---|---|
| Smithfield | 9,112 | +6.5% | 22.1% |
| Windsor | 2,947 | +7.1% | 7.1% |
2 incorporated places, as listed in the U.S. Census Bureau’s 2020 place reference files. Residents: U.S. Census Bureau population estimates for July 1, 2025 (Vintage 2025).
Isle of Wight County, Homes
Isle of Wight County is a place of houses on their own lots: 78% of its 16,827 homes are detached single-family houses, against 61% across Virginia. Much of Isle of Wight County is recent building: 34% of its homes have gone up since 2000 and the middle year built is 1992, against 1984 for Virginia. Owners live in 81% of the occupied homes (Virginia: 67%), so for most households a test and a fix are their own to order.
| Homes | Isle of Wight County | Virginia |
|---|---|---|
| Housing units | 16,827 | 3,654,784 |
| Detached houses | 78% | 61% |
| In buildings of 5 or more | 7% | 19% |
| Mobile homes | 9% | 4% |
| Built before 1960 | 12% | 19% |
| Built since 2000 | 34% | 25% |
| Middle year built | 1992 | 1984 |
| Owner-occupied | 81% | 67% |
Census Bureau, American Community Survey, 2019 to 2023: estimates from a sample of homes, looser for a small place. Shares by Radon411.