Locations and reports
Radon Levels in Virginia
What this means for you
- Your area: EPA rates 62 of Virginia's 133 classified counties Zone 1, the highest of its three radon zones. Zones are predictions for whole counties, and homes with elevated levels occur in all three zones.
- Local tests: CDC publishes Virginia's radon test results by county. Open your county below to see its figures.
- Your home: The only way to know your home’s level is to test it.
pCi/L (picocuries per liter) is the unit radon is measured in. EPA recommends fixing a home at 4 pCi/L or above, its action level.
For Virginia, EPA's Map of Radon Zones places 62 of its 133 classified counties in Zone 1, highest predicted potential, a prediction for each county as a whole. Radon levels vary from home to home, so only a test measures the level in yours.
Predicted: EPA radon zone
133 of 133 counties classified
EPA classifies counties, not states. Of the 133 counties in Virginia with a zone, 62 are in Zone 1, 28 in Zone 2 and 43 in Zone 3.
- Zone 1: Highest predicted potentialgreater than 4 pCi/L62 of 133 counties · 46.6%
- Zone 2: Moderate predicted potential2 to 4 pCi/L28 of 133 counties · 21.1%
- Zone 3: Lower predicted potentialless than 2 pCi/L43 of 133 counties · 32.3%
An EPA radon zone describes predicted potential across a whole county. It is not intended to determine whether any individual home should be tested, and homes with elevated levels occur in all three zones. EPA recommends testing every home regardless of zone, and testing is the only way to know the radon level in a specific building.
This is a county-level geologic prediction. It is not a measurement of any address, and houses with elevated radon are found in all three zones.
Predicted: EPA Map of Radon Zones
Measured: tests reported to CDC
CDC publishes Virginia's radon test figures by county: 132 of its 133 counties have one. Each county's share is in the county list.
Virginia, In figures
Virginia in figures
What the published data says about Virginia, in words. A zone and a share of tests describe an area, never the level in any one home.
Predicted
PredictedEPA places 62 of Virginia's 133 counties in Zone 1, 28 in Zone 2 and 43 in Zone 3.
Zone 1 counties, A to Z, begin with Alleghany County, Amelia County and Appomattox County; the county section below lists all 62.
Compared
Calculated by Radon41147% of Virginia's counties with a zone on file are in Zone 1, a larger share than across all U.S. counties (34%). It is a share of counties, not of land, people or homes.
Reported tests
MeasuredCDC has no statewide testing figure for Virginia on file here.
132 of the 133 counties have a published county figure; the most tests in each one's latest year were reported for Fairfax County (6,272 in 2017), Prince William County (3,527 in 2017) and Loudoun County (3,455 in 2017).
Virginia's radon program is the VDH Radon Program, run by Virginia Department of Health; its contacts are under Local resources.
Virginia, Counties
Virginia counties by EPA zone
PredictedAll 133 counties, by the zone EPA predicts for each. Every county has its own report.
Zone 1: highest predicted potential62
- Alleghany County40.0% of reported tests at or above 4 pCi/L, 2017
- Amelia County27.3% of reported tests at or above 4 pCi/L, 2017
- Appomattox County10.0% of reported tests at or above 4 pCi/L, 2017
- Augusta County50.1% of reported tests at or above 4 pCi/L, 2017
- Bath County18.2% of reported tests at or above 4 pCi/L, 2017
- Bland County46.2% of reported tests at or above 4 pCi/L, 2017
- Botetourt County42.1% of reported tests at or above 4 pCi/L, 2017
- Bristol city50.9% of reported tests at or above 4 pCi/L, 2017
- Brunswick County39.5% of reported tests at or above 4 pCi/L, 2017
- Buckingham County13.8% of reported tests at or above 4 pCi/L, 2017
- Buena Vista city85.7% of reported tests at or above 4 pCi/L, 2017
- Campbell County39.7% of reported tests at or above 4 pCi/L, 2017
- Chesterfield County29.6% of reported tests at or above 4 pCi/L, 2017
- Clarke County47.7% of reported tests at or above 4 pCi/L, 2017
- Covington city40.0% of reported tests at or above 4 pCi/L, 2017
- Craig County46.2% of reported tests at or above 4 pCi/L, 2017
- Cumberland County16.7% of reported tests at or above 4 pCi/L, 2017
- Danville city35.1% of reported tests at or above 4 pCi/L, 2017
- Dinwiddie County35.0% of reported tests at or above 4 pCi/L, 2017
- Fairfax city14.3% of reported tests at or above 4 pCi/L, 2017
- Fairfax County18.7% of reported tests at or above 4 pCi/L, 2017
- Falls Church city18.1% of reported tests at or above 4 pCi/L, 2017
- Fluvanna County28.1% of reported tests at or above 4 pCi/L, 2017
- Frederick County44.1% of reported tests at or above 4 pCi/L, 2017
- Giles County56.9% of reported tests at or above 4 pCi/L, 2017
- Goochland County30.7% of reported tests at or above 4 pCi/L, 2017
- Harrisonburg city33.4% of reported tests at or above 4 pCi/L, 2017
- Henry County35.7% of reported tests at or above 4 pCi/L, 2017
- Highland County22.2% of reported tests at or above 4 pCi/L, 2017
- Lee County50.0% of reported tests at or above 4 pCi/L, 2017
- Lexington city18.8% of reported tests at or above 4 pCi/L, 2017
- Louisa County38.1% of reported tests at or above 4 pCi/L, 2017
- Manassas city15.9% of reported tests at or above 4 pCi/L, 2017
- Manassas Park city20.0% of reported tests at or above 4 pCi/L, 2017
- Montgomery County35.5% of reported tests at or above 4 pCi/L, 2017
- Nottoway County25.0% of reported tests at or above 4 pCi/L, 2017
- Orange County36.1% of reported tests at or above 4 pCi/L, 2017
- Page County38.3% of reported tests at or above 4 pCi/L, 2017
- Patrick County54.7% of reported tests at or above 4 pCi/L, 2017
- Petersburg city0.0% of reported tests at or above 4 pCi/L, 2017
- Pittsylvania County38.4% of reported tests at or above 4 pCi/L, 2017
- Powhatan County28.0% of reported tests at or above 4 pCi/L, 2017
- Pulaski County49.6% of reported tests at or above 4 pCi/L, 2017
- Radford city41.8% of reported tests at or above 4 pCi/L, 2017
- Roanoke city25.9% of reported tests at or above 4 pCi/L, 2017
- Roanoke County22.1% of reported tests at or above 4 pCi/L, 2017
- Rockbridge County50.9% of reported tests at or above 4 pCi/L, 2017
- Rockingham County43.9% of reported tests at or above 4 pCi/L, 2017
- Russell County67.3% of reported tests at or above 4 pCi/L, 2017
- Salem city33.6% of reported tests at or above 4 pCi/L, 2017
- Scott County50.7% of reported tests at or above 4 pCi/L, 2017
- Shenandoah County36.4% of reported tests at or above 4 pCi/L, 2017
- Smyth County61.0% of reported tests at or above 4 pCi/L, 2017
- Spotsylvania County34.2% of reported tests at or above 4 pCi/L, 2017
- Stafford County31.4% of reported tests at or above 4 pCi/L, 2017
- Staunton city52.7% of reported tests at or above 4 pCi/L, 2017
- Tazewell County40.3% of reported tests at or above 4 pCi/L, 2017
- Warren County36.9% of reported tests at or above 4 pCi/L, 2017
- Washington County58.1% of reported tests at or above 4 pCi/L, 2017
- Waynesboro city48.5% of reported tests at or above 4 pCi/L, 2017
- Winchester city44.8% of reported tests at or above 4 pCi/L, 2017
- Wythe County65.5% of reported tests at or above 4 pCi/L, 2017
Zone 2: moderate predicted potential28
- Albemarle County24.7% of reported tests at or above 4 pCi/L, 2017
- Amherst County36.8% of reported tests at or above 4 pCi/L, 2017
- Arlington County13.7% of reported tests at or above 4 pCi/L, 2017
- Bedford County23.5% of reported tests at or above 4 pCi/L, 2017
- Buchanan County25.0% of reported tests at or above 4 pCi/L, 2017
- Carroll County61.8% of reported tests at or above 4 pCi/L, 2017
- Charlotte County40.0% of reported tests at or above 4 pCi/L, 2017
- Charlottesville city21.0% of reported tests at or above 4 pCi/L, 2017
- Culpeper County40.1% of reported tests at or above 4 pCi/L, 2017
- Dickenson County40.0% of reported tests at or above 4 pCi/L, 2017
- Fauquier County30.2% of reported tests at or above 4 pCi/L, 2017
- Floyd County42.6% of reported tests at or above 4 pCi/L, 2017
- Franklin County21.2% of reported tests at or above 4 pCi/L, 2017
- Galax city38.9% of reported tests at or above 4 pCi/L, 2017
- Grayson County44.7% of reported tests at or above 4 pCi/L, 2017
- Greene County34.6% of reported tests at or above 4 pCi/L, 2017
- Halifax County18.9% of reported tests at or above 4 pCi/L, 2017
- Loudoun County27.4% of reported tests at or above 4 pCi/L, 2017
- Lunenburg County25.0% of reported tests at or above 4 pCi/L, 2017
- Lynchburg city25.9% of reported tests at or above 4 pCi/L, 2017
- Madison County44.0% of reported tests at or above 4 pCi/L, 2017
- Mecklenburg County37.9% of reported tests at or above 4 pCi/L, 2017
- Nelson County28.7% of reported tests at or above 4 pCi/L, 2017
- Norton city0.0% of reported tests at or above 4 pCi/L, 2017
- Prince Edward County40.0% of reported tests at or above 4 pCi/L, 2017
- Prince William County31.7% of reported tests at or above 4 pCi/L, 2017
- Rappahannock County41.6% of reported tests at or above 4 pCi/L, 2017
- Wise County28.3% of reported tests at or above 4 pCi/L, 2017
Zone 3: lower predicted potential43
- Accomack County0.0% of reported tests at or above 4 pCi/L, 2017
- Alexandria city7.3% of reported tests at or above 4 pCi/L, 2017
- Caroline County32.7% of reported tests at or above 4 pCi/L, 2017
- Charles City0.0% of reported tests at or above 4 pCi/L, 2017
- Chesapeake city7.0% of reported tests at or above 4 pCi/L, 2017
- Colonial Heights city30.0% of reported tests at or above 4 pCi/L, 2017
- Emporia city50.0% of reported tests at or above 4 pCi/L, 2017
- Essex County7.7% of reported tests at or above 4 pCi/L, 2017
- Franklin city0.0% of reported tests at or above 4 pCi/L, 2017
- Fredericksburg city26.1% of reported tests at or above 4 pCi/L, 2017
- Gloucester County25.0% of reported tests at or above 4 pCi/L, 2017
- Greensville County0.0% of reported tests at or above 4 pCi/L, 2017
- Hampton city10.5% of reported tests at or above 4 pCi/L, 2017
- Hanover County23.0% of reported tests at or above 4 pCi/L, 2017
- Henrico County27.0% of reported tests at or above 4 pCi/L, 2017
- Hopewell city25.0% of reported tests at or above 4 pCi/L, 2017
- Isle of Wight County33.3% of reported tests at or above 4 pCi/L, 2017
- James City37.3% of reported tests at or above 4 pCi/L, 2017
- King and Queen County28.6% of reported tests at or above 4 pCi/L, 2017
- King George County45.5% of reported tests at or above 4 pCi/L, 2017
- King William County14.3% of reported tests at or above 4 pCi/L, 2017
- Lancaster County12.5% of reported tests at or above 4 pCi/L, 2017
- Martinsville city27.3% of reported tests at or above 4 pCi/L, 2017
- Mathews County66.7% of reported tests at or above 4 pCi/L, 2017
- Middlesex County0.0% of reported tests at or above 4 pCi/L, 2017
- New Kent County30.8% of reported tests at or above 4 pCi/L, 2017
- Newport News city6.7% of reported tests at or above 4 pCi/L, 2017
- Norfolk city2.7% of reported tests at or above 4 pCi/L, 2017
- Northampton County0.0% of reported tests at or above 4 pCi/L, 2017
- Northumberland County13.3% of reported tests at or above 4 pCi/L, 2017
- Poquoson city0.0% of reported tests at or above 4 pCi/L, 2015
- Portsmouth city0.0% of reported tests at or above 4 pCi/L, 2017
- Prince George County18.2% of reported tests at or above 4 pCi/L, 2017
- Richmond city27.7% of reported tests at or above 4 pCi/L, 2017
- Richmond County24.1% of reported tests at or above 4 pCi/L, 2017
- Southampton County0.0% of reported tests at or above 4 pCi/L, 2017
- Suffolk city0.0% of reported tests at or above 4 pCi/L, 2017
- Surry CountyReported testing not yet available
- Sussex County0.0% of reported tests at or above 4 pCi/L, 2017
- Virginia Beach city4.3% of reported tests at or above 4 pCi/L, 2017
- Westmoreland County10.7% of reported tests at or above 4 pCi/L, 2017
- Williamsburg city10.5% of reported tests at or above 4 pCi/L, 2017
- York County26.1% of reported tests at or above 4 pCi/L, 2017
Virginia, Local resources
Local resources in Virginia
Who to ask in Virginia: the state's radon program, test kits and professionals.
VDH Radon Program
Virginia Department of Health
Virginia’s radon program answers questions about testing, mitigation and the rules where you live.
- Phone
- (804) 864-8161
- Radon@vdh.virginia.gov
- Licensing of radon professionals
The Code of Virginia requires that Radon testers and mitigators be currently certified by either the National Radon Proficiency Program (NRPP) or the National Radon Safety Board (NRSB).
Test kits
The program says: Virginia Department of Health is offering a limited supply of short-term, do-it-yourself radon test kits available for only a $4 shipping fee.
Radon professionals
4 professionals are listed in Virginia.
Professionals in VirginiaVirginia, Questions
Questions about radon in Virginia
Common questions9 questions, answered from the figures above
Is radon a problem in Virginia?
EPA's Map of Radon Zones places 62 of the 133 Virginia counties it classifies in Zone 1, the highest predicted potential, 28 in Zone 2 and 43 in Zone 3. An EPA radon zone describes predicted potential across a whole county. It is not intended to determine whether any individual home should be tested, and homes with elevated levels occur in all three zones. EPA recommends testing every home regardless of zone, and testing is the only way to know the radon level in a specific building.
Who does radon mitigation in Virginia?
Radon411's Virginia directory lists 4 certified radon companies. EPA recommends having a qualified contractor fix a home with a radon problem, because lowering high radon levels takes technical knowledge and special skills, and some states require the work to be done by a licensed or certified professional.
How radon mitigation worksWhat mitigation costsRadon professionals in Virginia
How do I get a radon test in Virginia?
EPA says you can test your home yourself or hire a qualified radon test company, and that either approach takes only a small amount of time and effort. The Virginia radon program is the place to ask about certified testers and any test kit offer it runs.
How to test a homeFree and low-cost kits by stateVirginia radon program
Which Virginia counties are in EPA radon Zone 1?
62 counties are in Zone 1: Alleghany County, Amelia County, Appomattox County, Augusta County, Bath County, Bland County, Botetourt County, Bristol city, and 54 more in the county table on this page. Zone 1 is EPA's class for highest predicted potential, a predicted average indoor screening level greater than 4 pCi/L. A zone is a prediction for a county, not a measurement of any home.
Radon in Alleghany CountyRadon in Amelia CountyRadon in Appomattox County
Which Virginia counties have the highest radon?
133 of Virginia's 133 counties have an EPA radon zone published here. Radon411 will not rank counties on data it does not hold, and a zone is a prediction for an area rather than a measurement of any building.
What share of radon tests in Virginia are high?
CDC has published no statewide radon testing statistics for Virginia, so we cannot give a figure. Where CDC does publish one, the percentage describes radon tests reported to CDC, not homes.
Which EPA region is Virginia in?
Virginia is in EPA Region 3: Mid-Atlantic.
Do I need to test my home in Virginia?
Yes, wherever you live in the state. Testing is the only way to know the radon level in a specific building. EPA recommends fixing a home when the radon level is 4 pCi/L or higher. EPA recommends considering a fix when the level is between 2 and 4 pCi/L.
Why does this page show coverage rather than one radon level for Virginia?
A statewide figure averages counties with very different geology and very different numbers of reported tests, so it hides more than it shows. The county report is the level at which the EPA zone, the geologic potential and the reported testing statistics are actually published, which is why the county table above links to every one of them.
What these figures mean if you own, buy, sell or rent
The zone counts on this page describe counties across Virginia. They are predictions for areas, and none of them measures your building.
- How to test a home
If you own your home
Test the lowest lived-in level; a short-term kit screens in days, a long-term kit reflects the year.
- Buying a house: radon guide
If you are buying
Ask for past results and any system's post-mitigation test, and test during the sale.
- Selling a house: radon guide
If you are selling
Testing before you list puts the timing in your hands; disclosure rules differ by state.
- Radon in rental homes
If you rent, or rent out a home
A tenant can test; a fix is the owner's to make, and duties differ by state.
How long a test has to run, under what conditions, and what EPA says a result means: the testing standard, in full.
Virginia, Products
Testing and mitigation products
Whatever the figures for Virginia show, only a test tells you about one home.
Testing
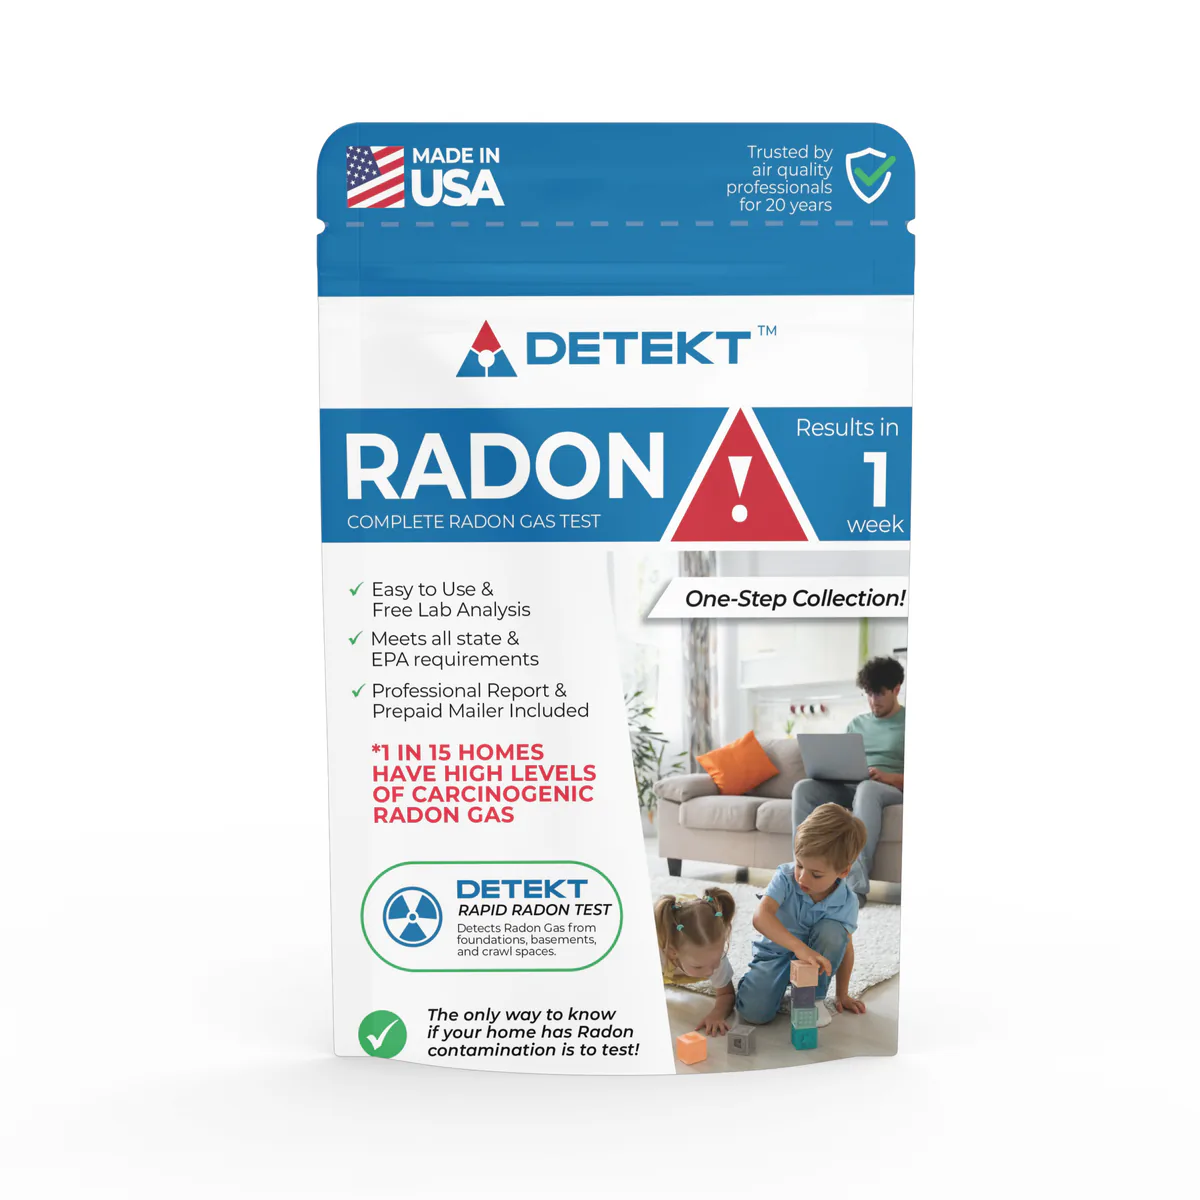
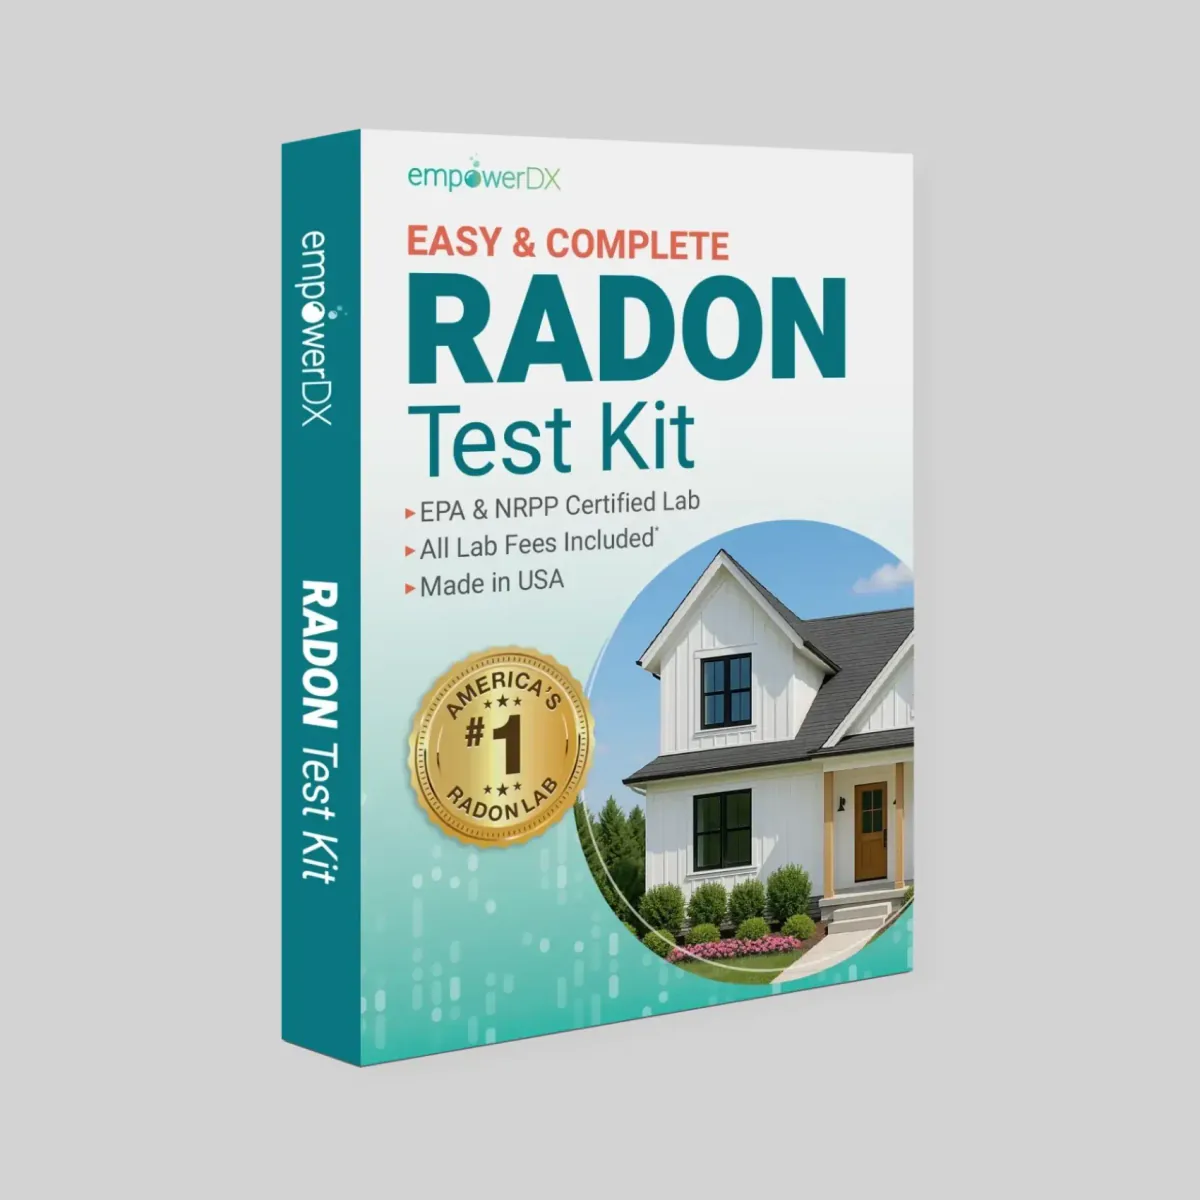
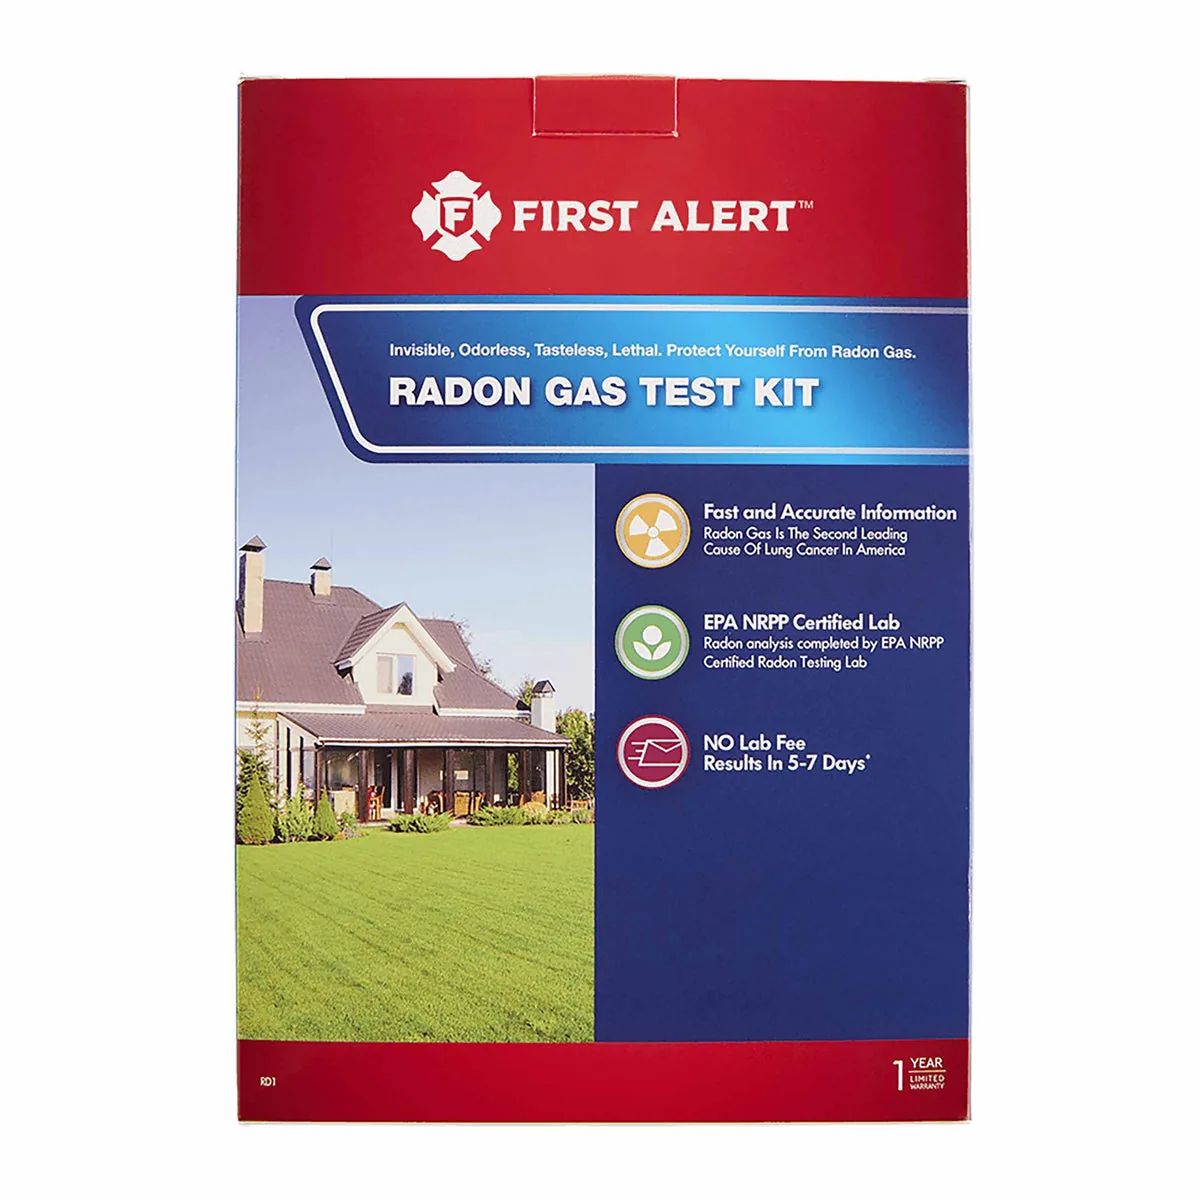
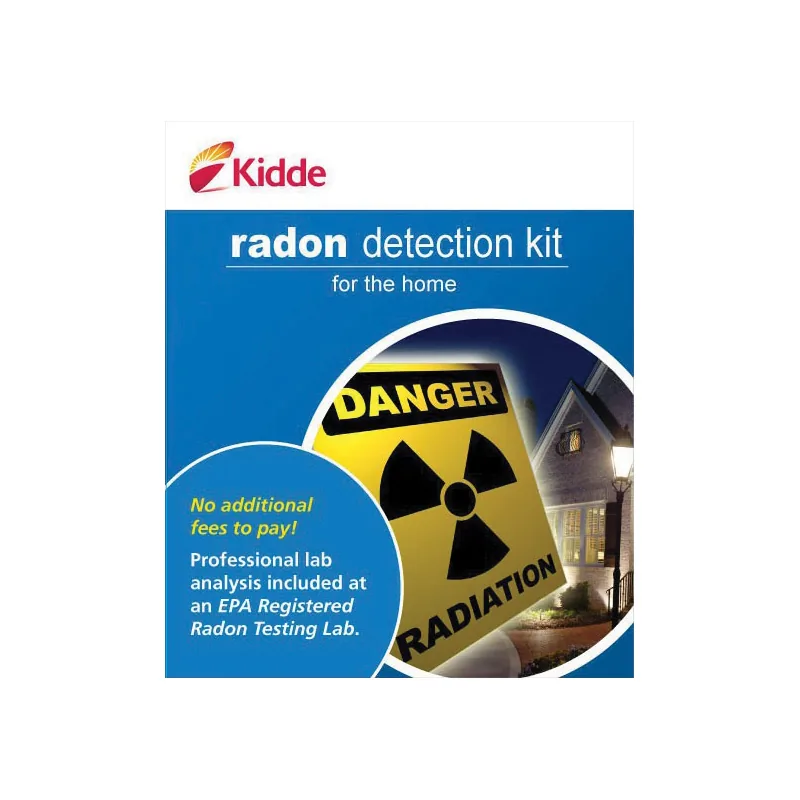
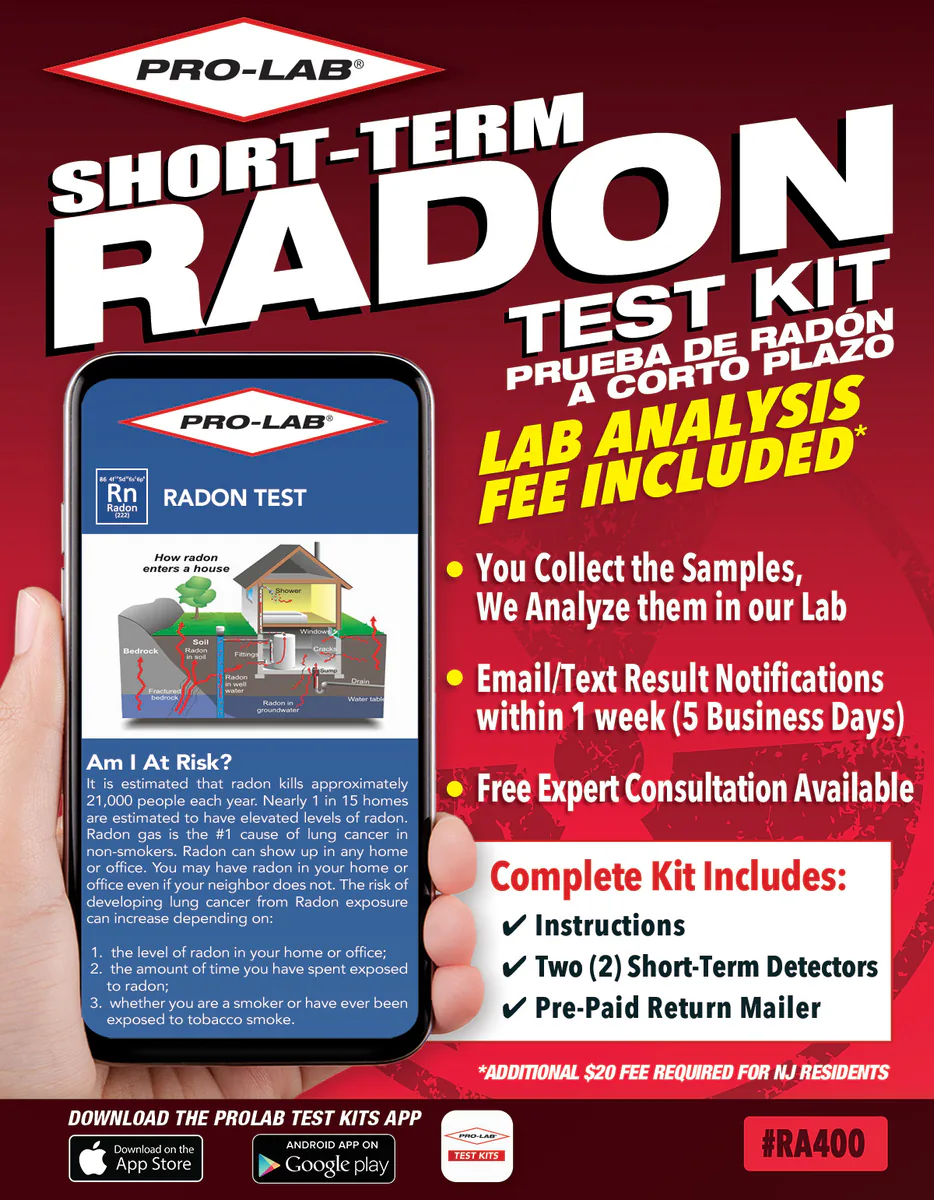
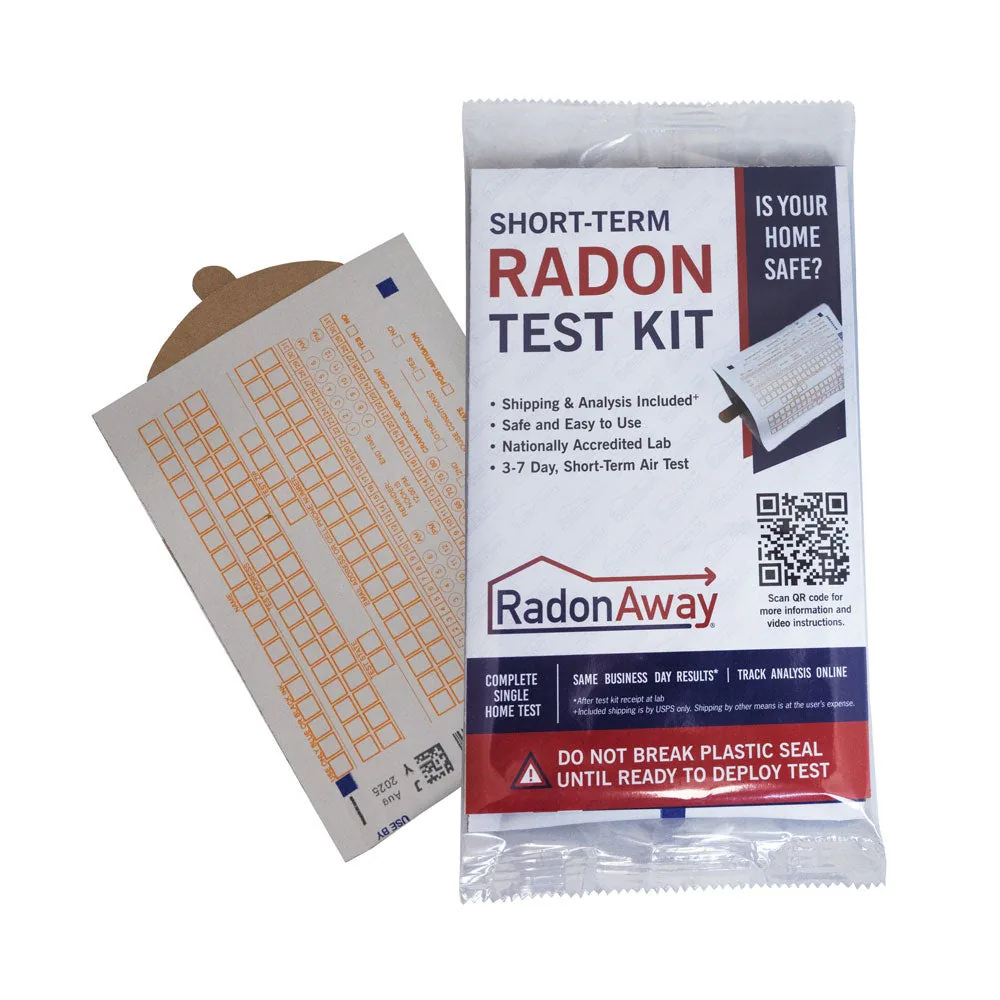
- Short-term test kitsPassive detectors exposed for a few days under closed-building conditions, then analyzed by a lab.
- Long-term test kitsDetectors exposed for more than 90 days, for a closer picture of the annual average.
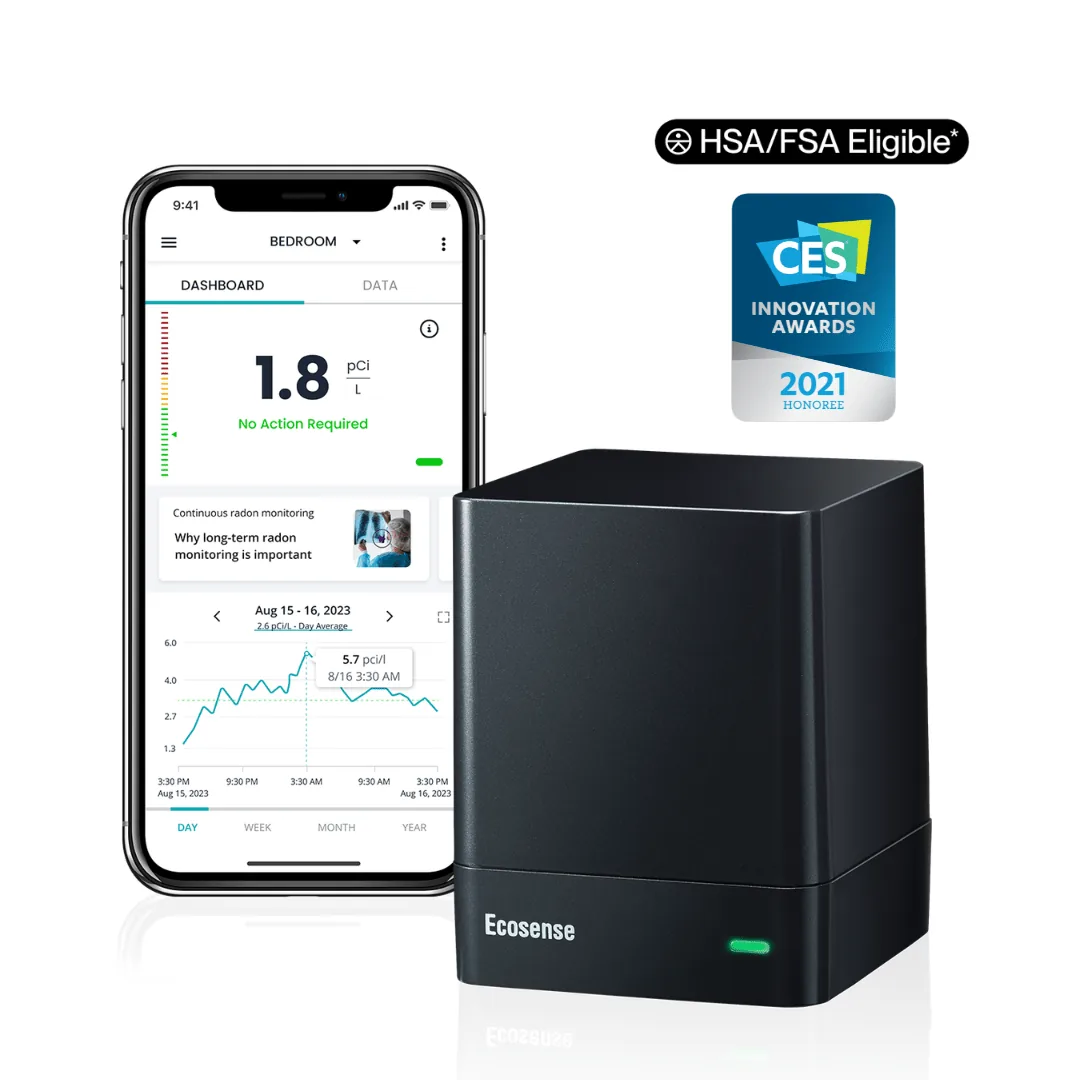
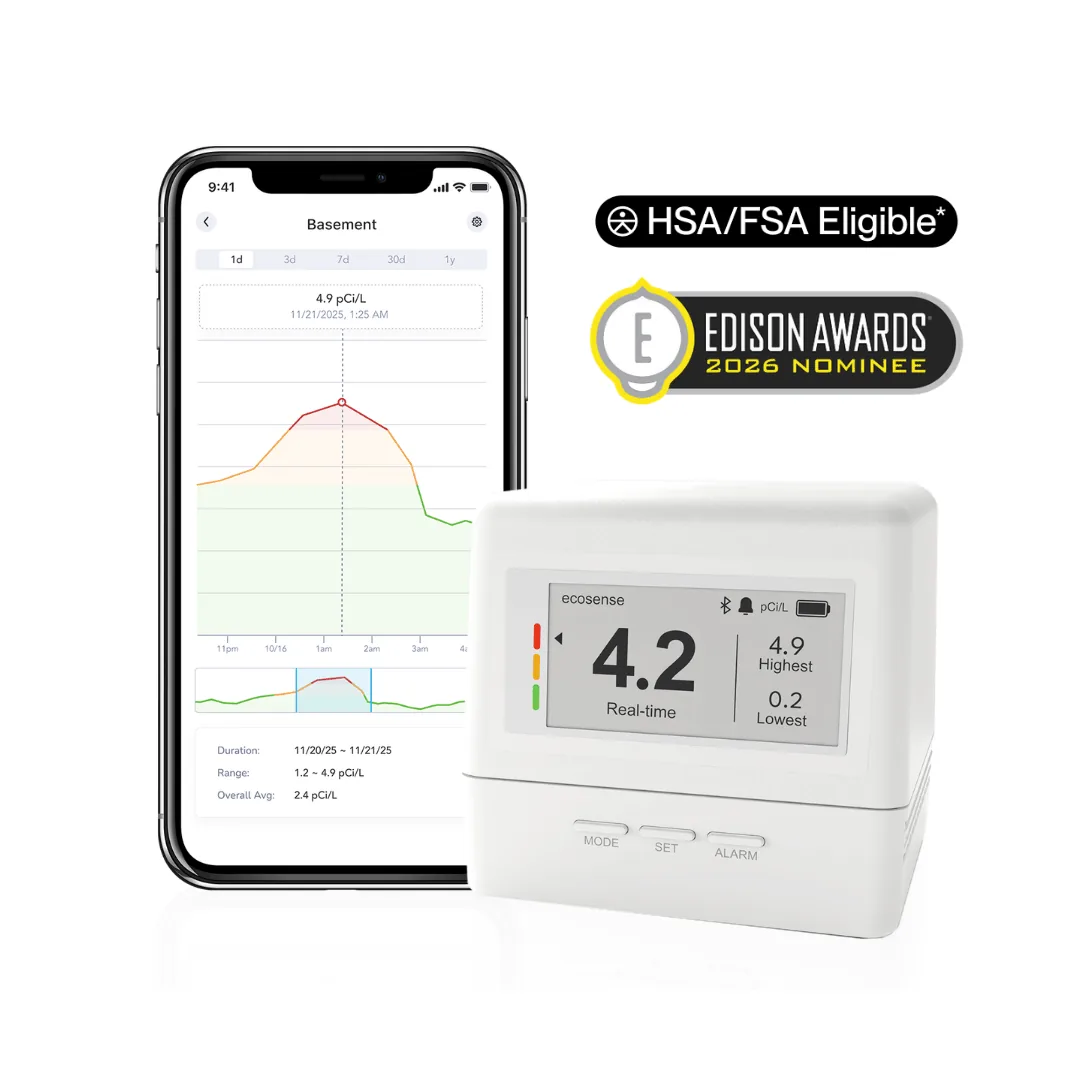
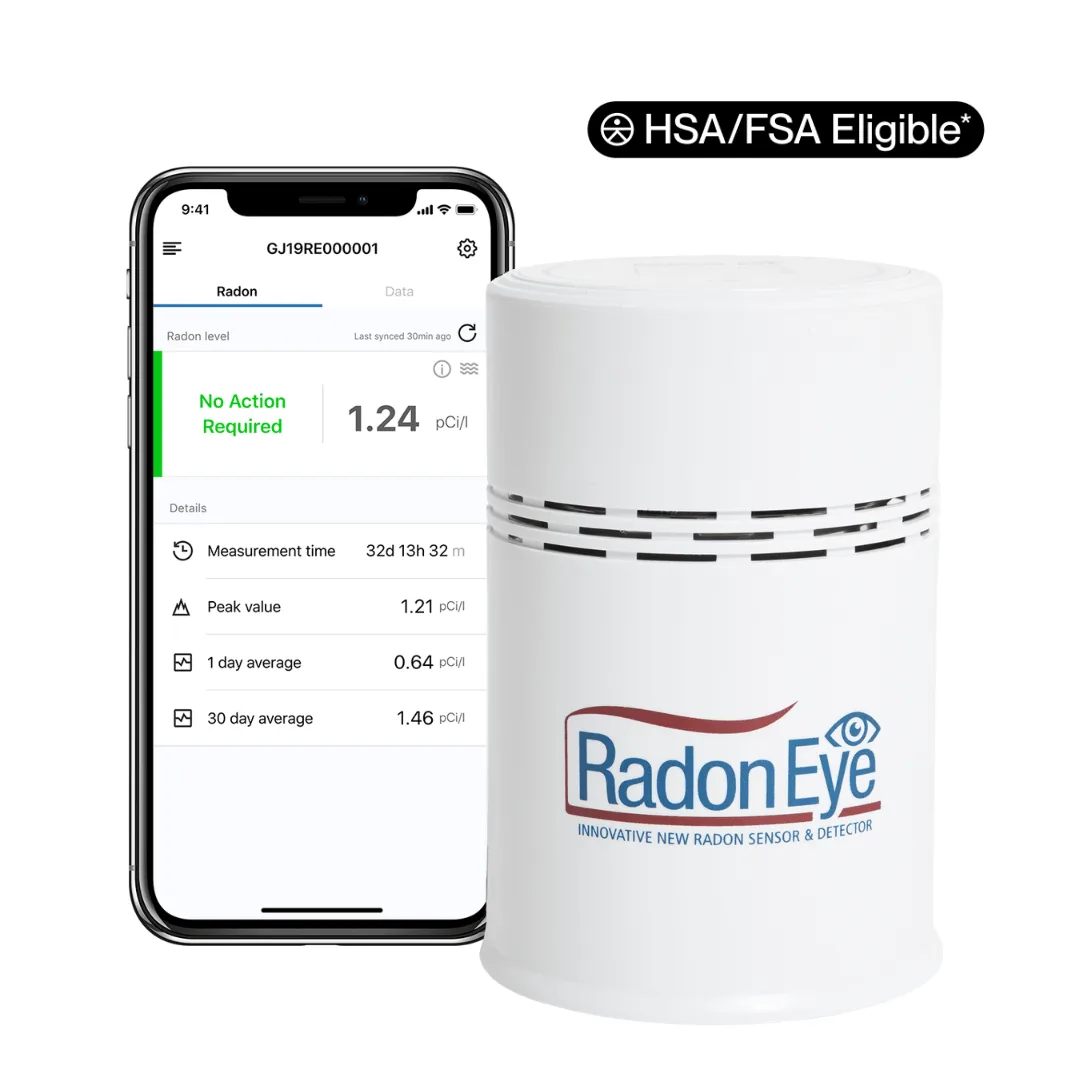
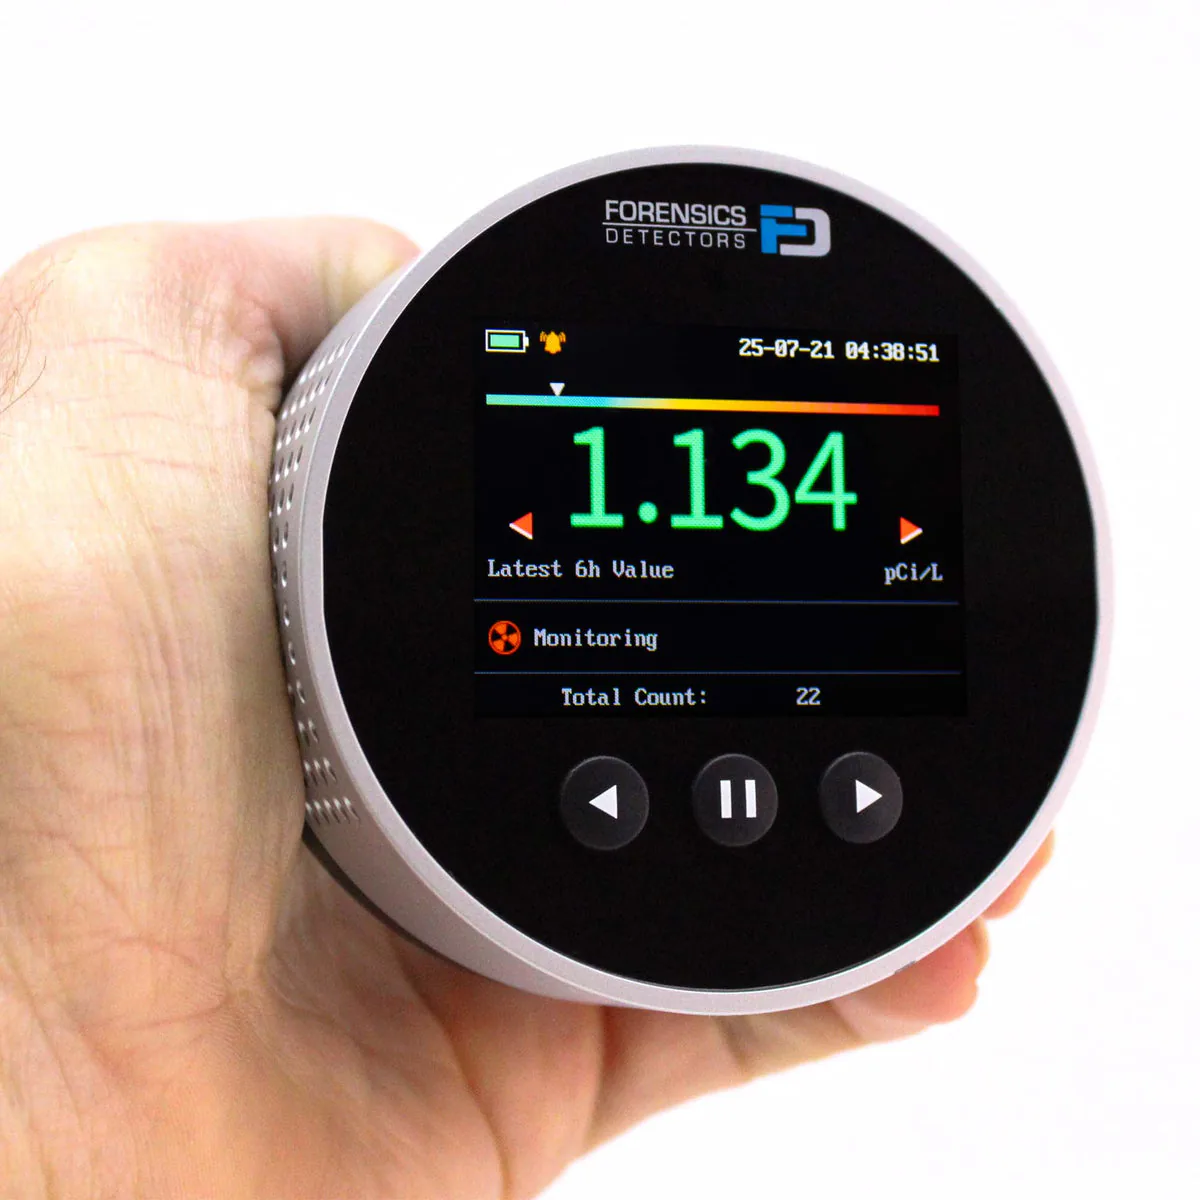
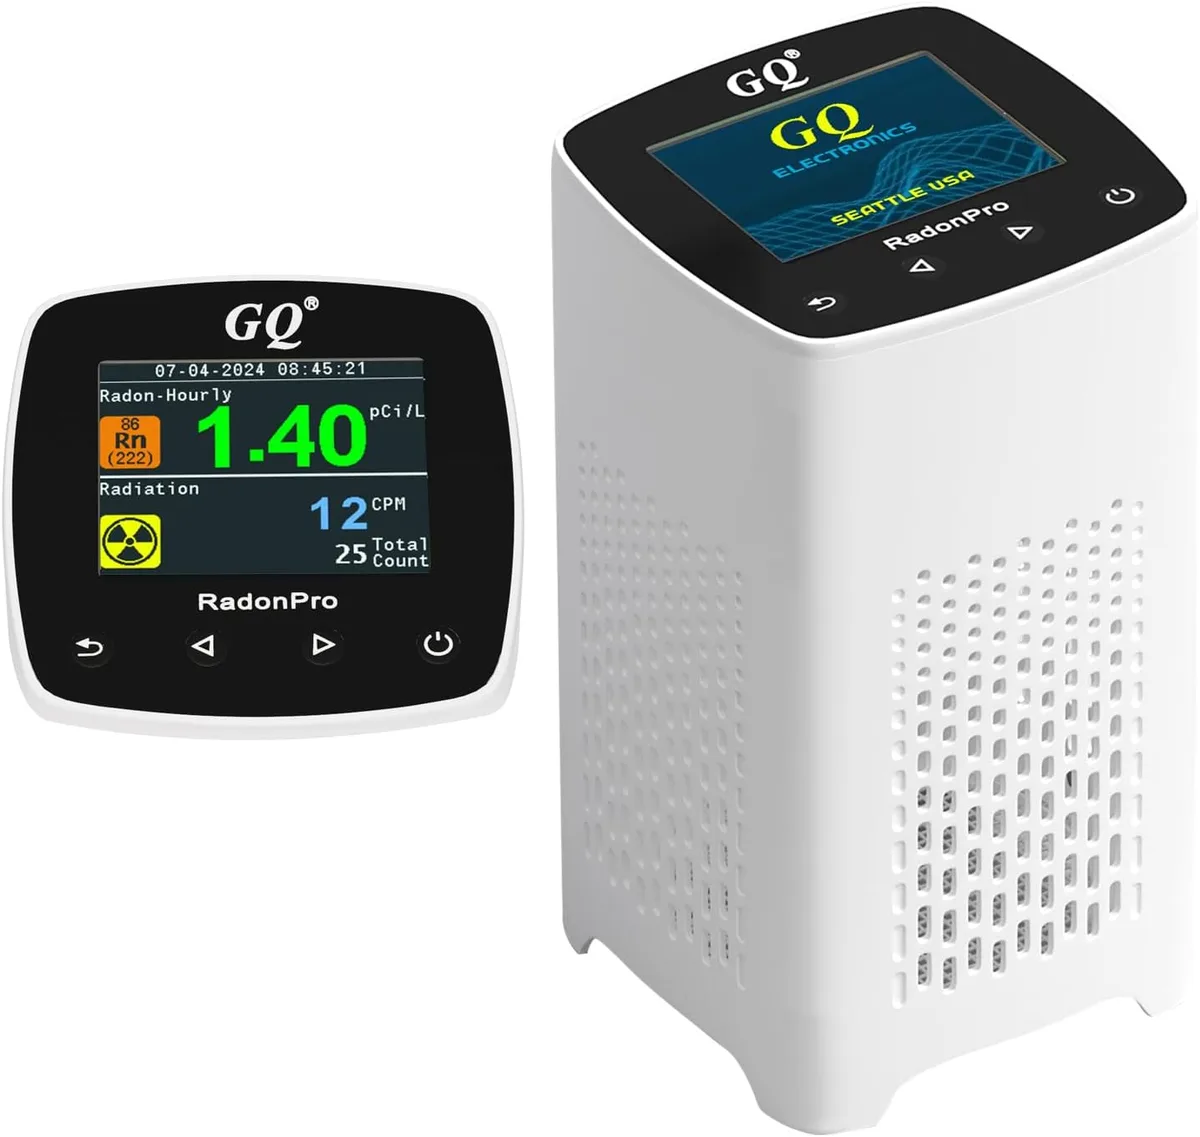
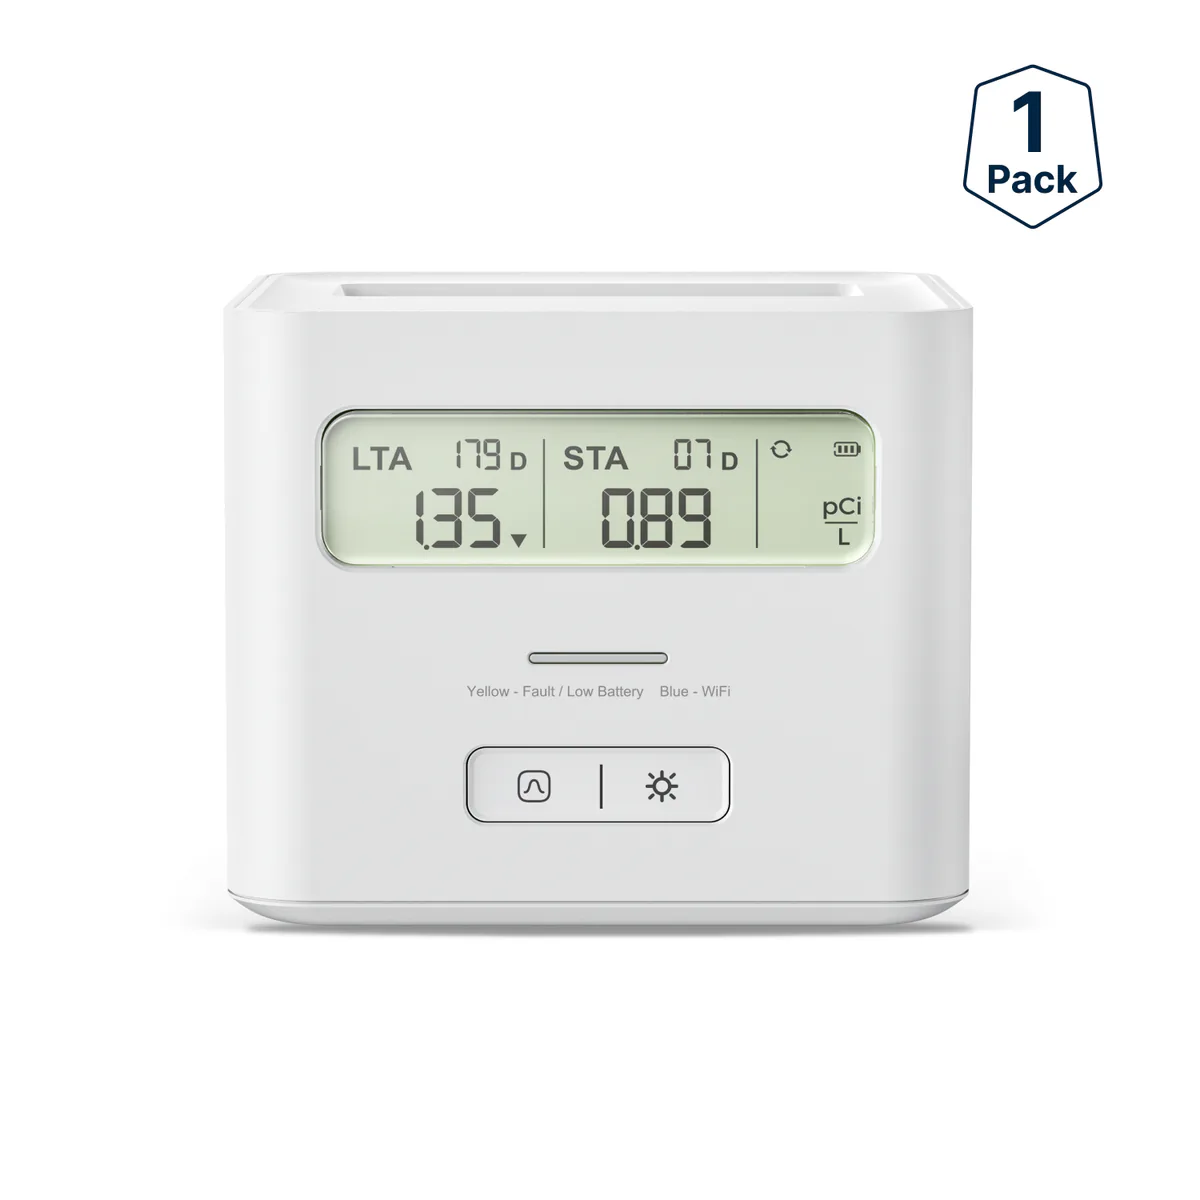
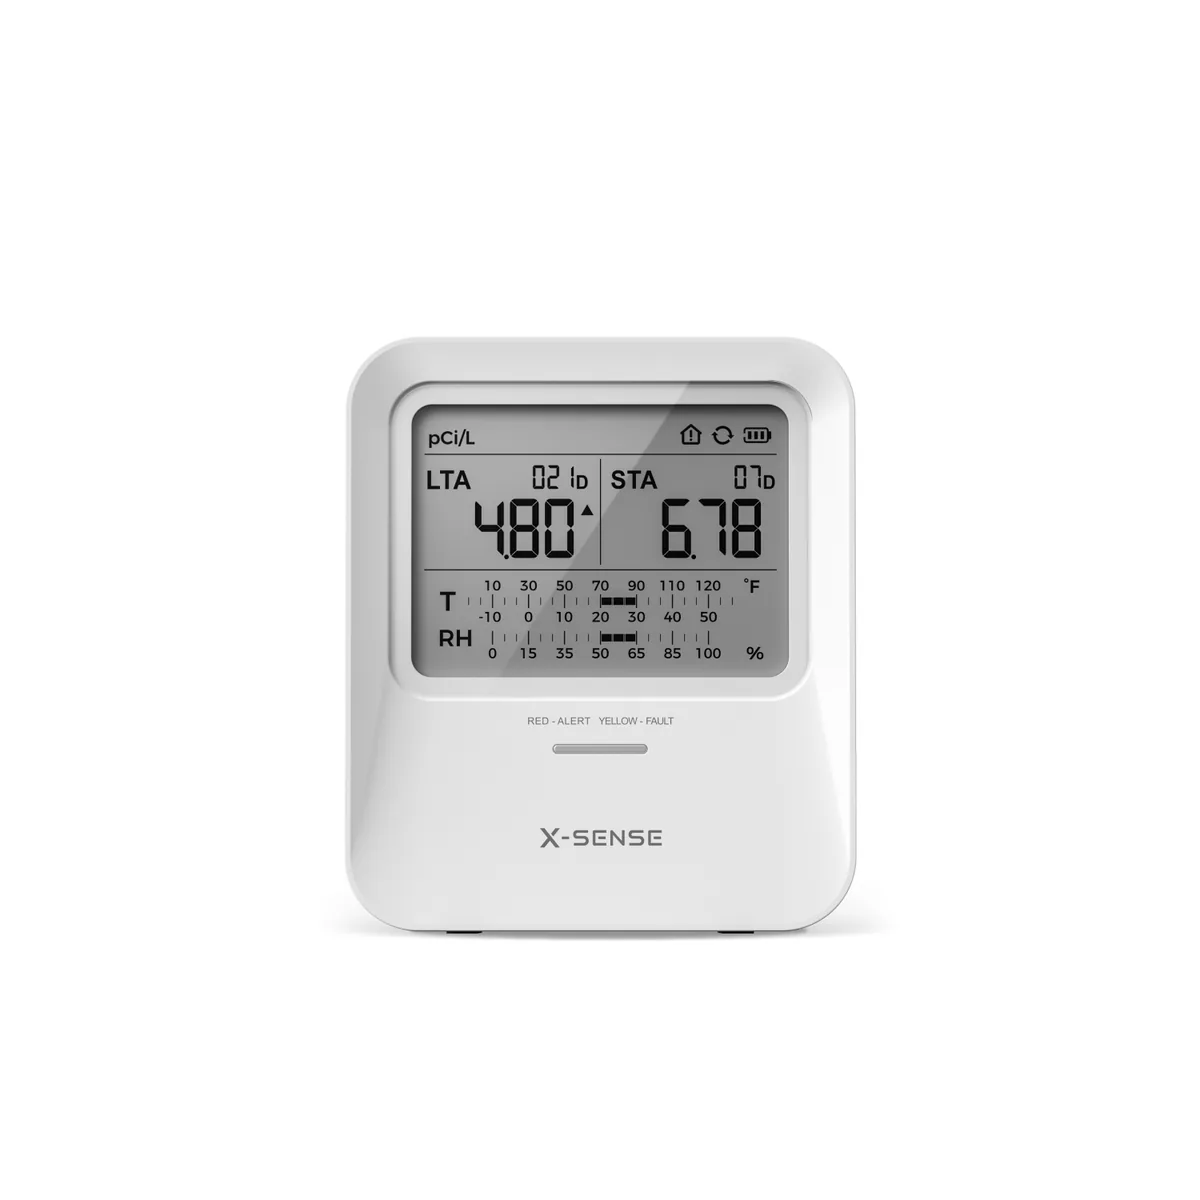
- Continuous monitorsPowered devices that log radon on a repeating cycle, often used for transaction tests.
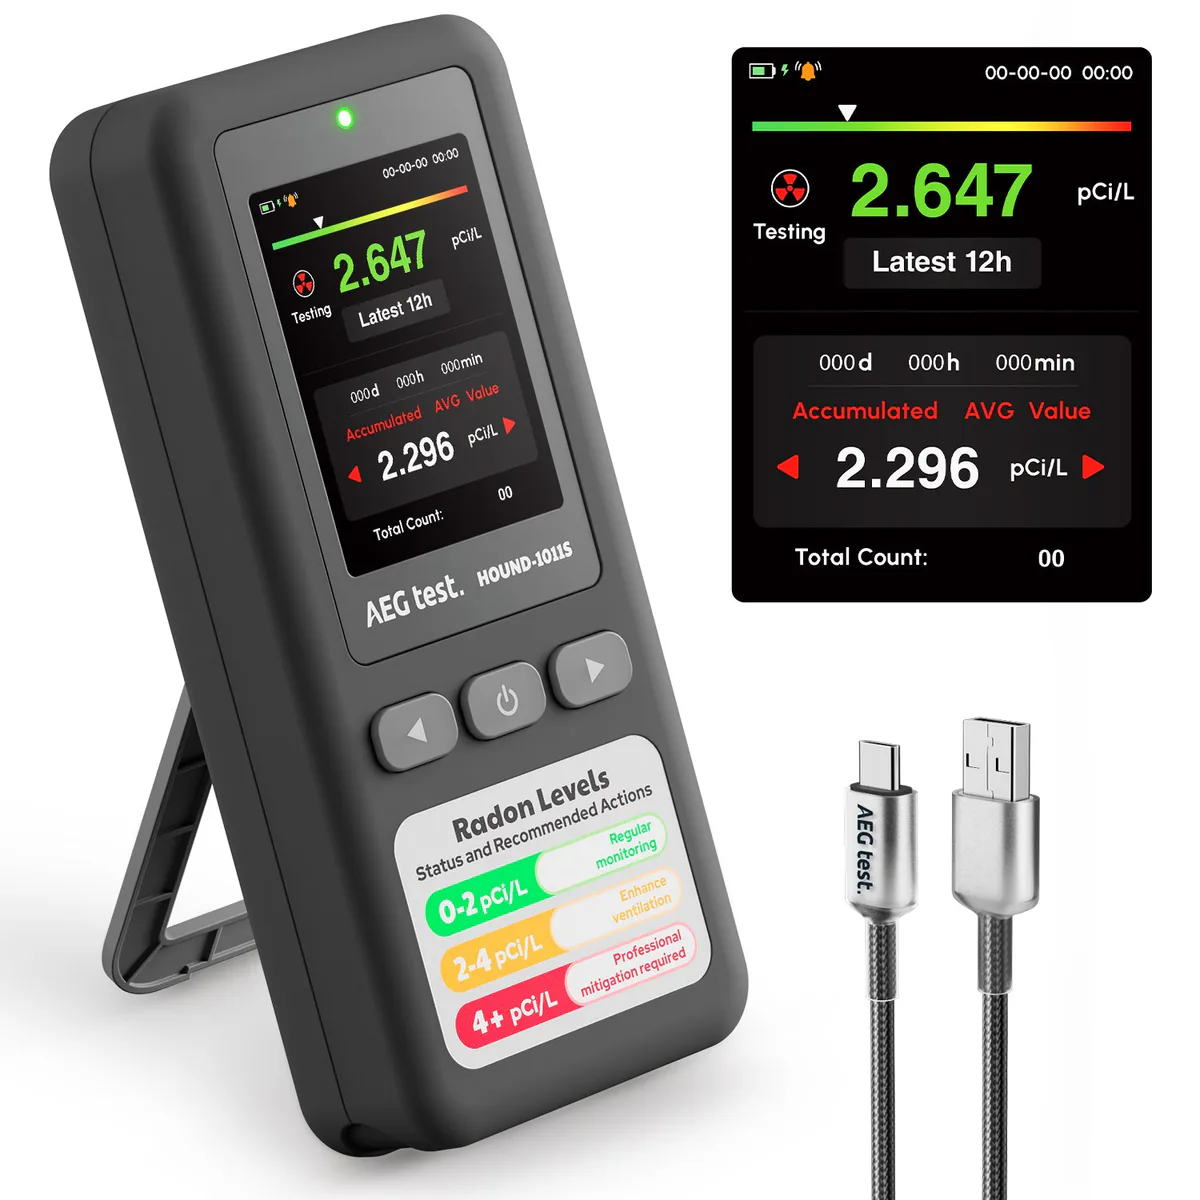
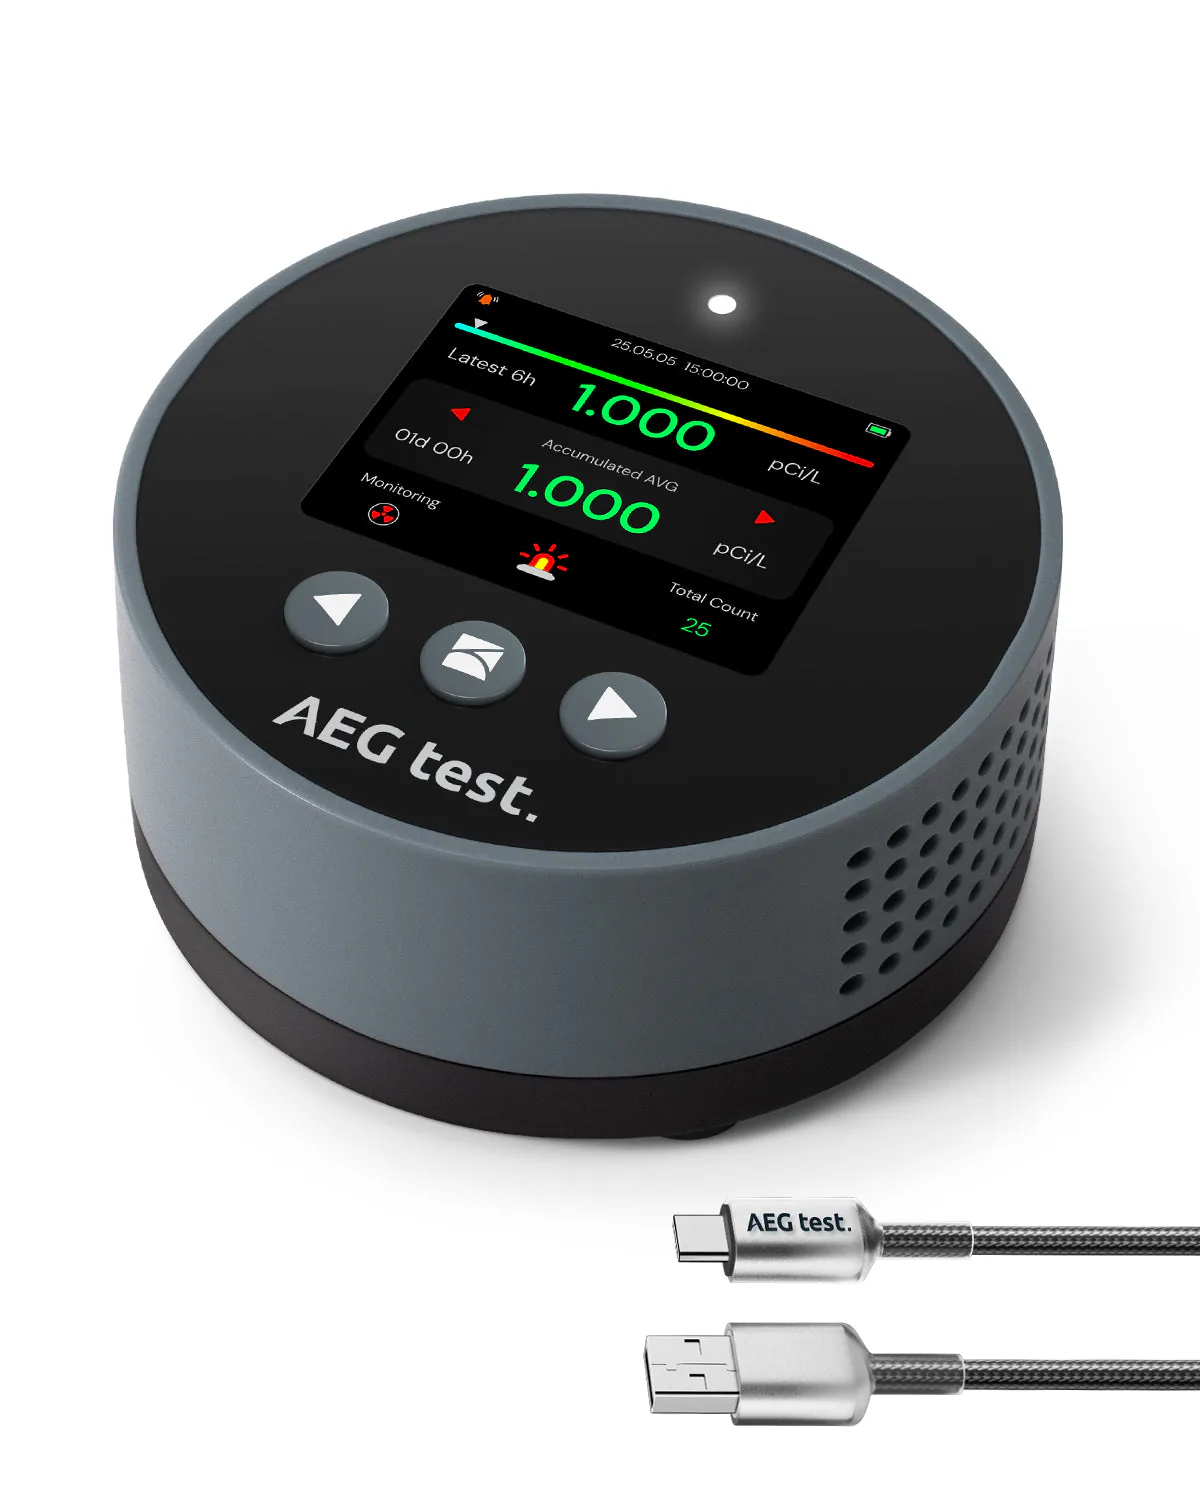
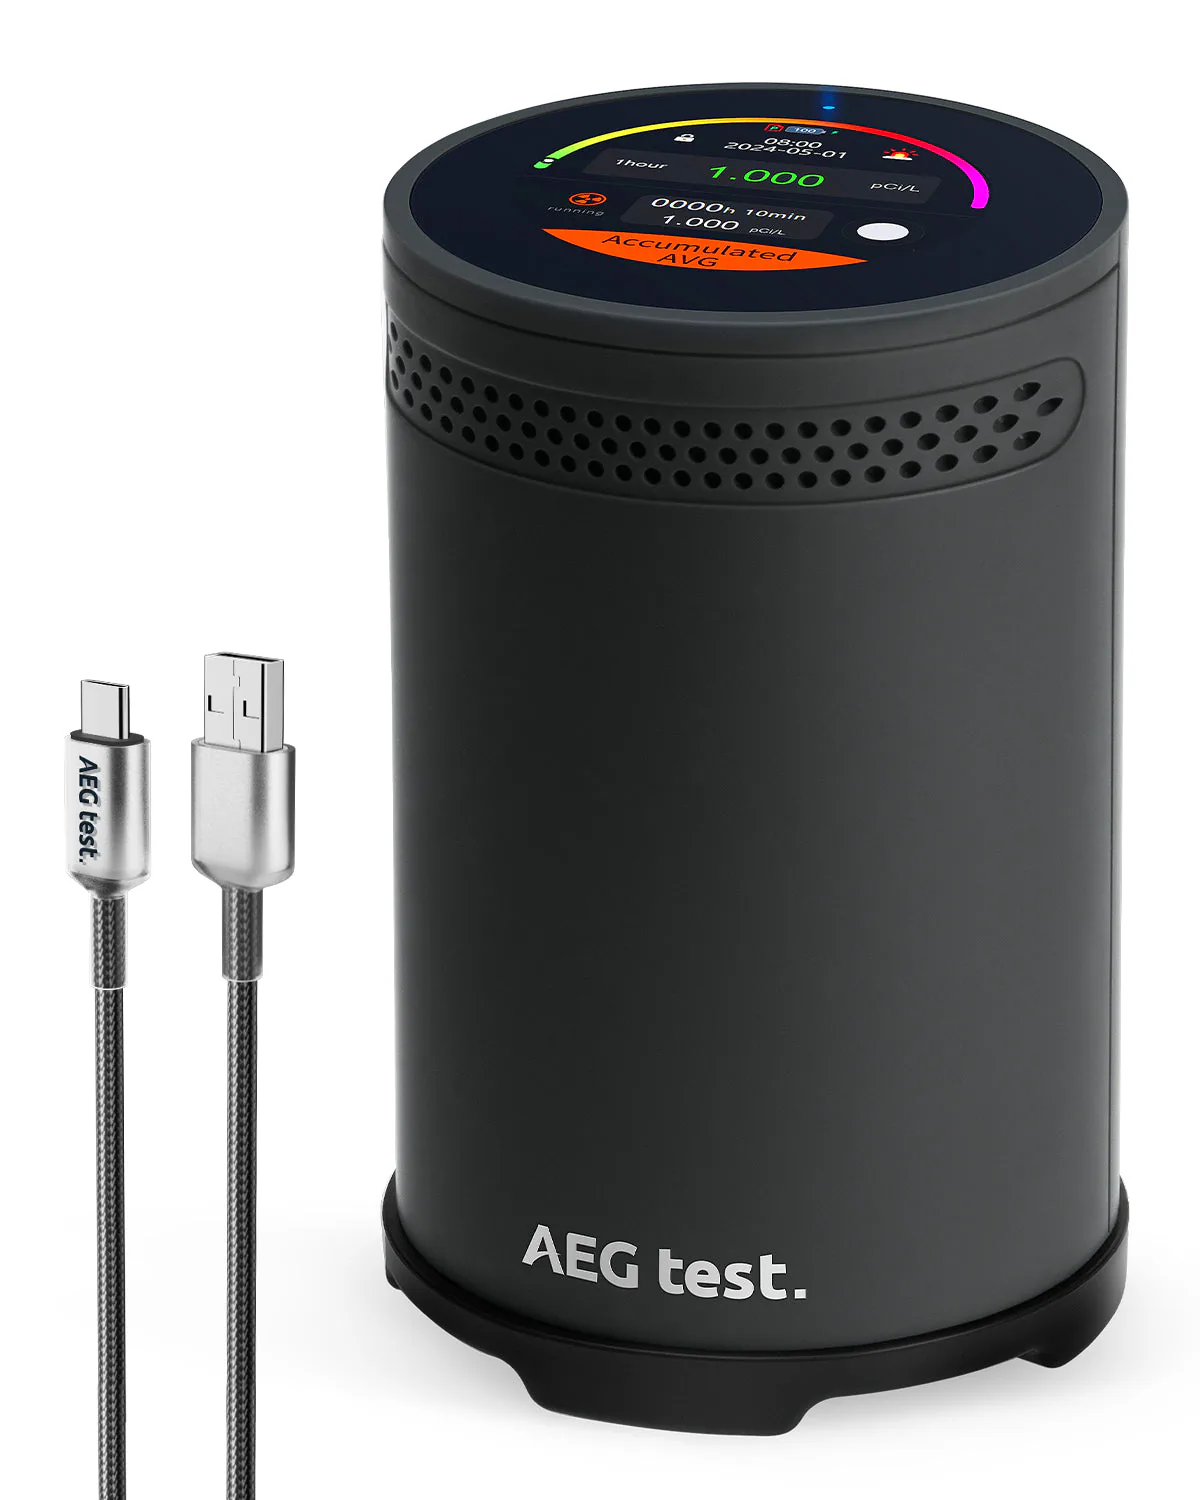
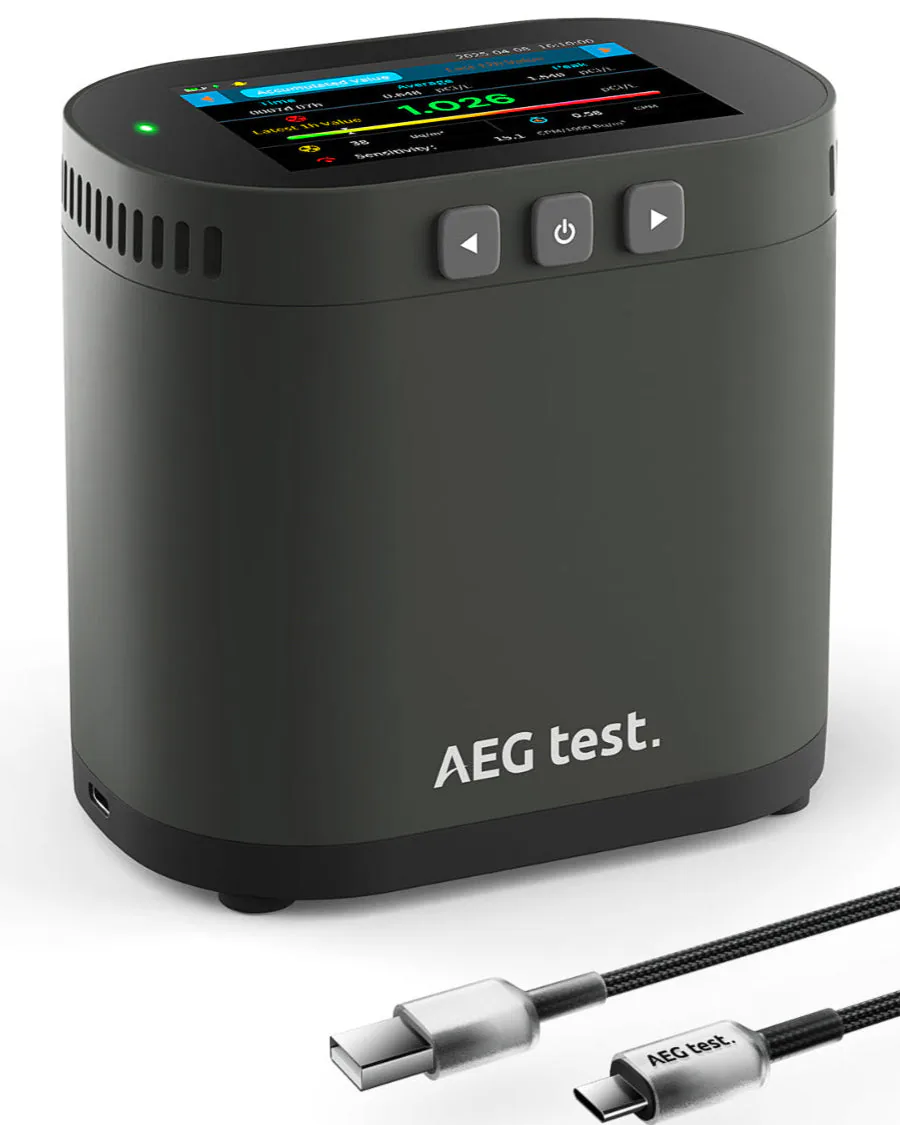
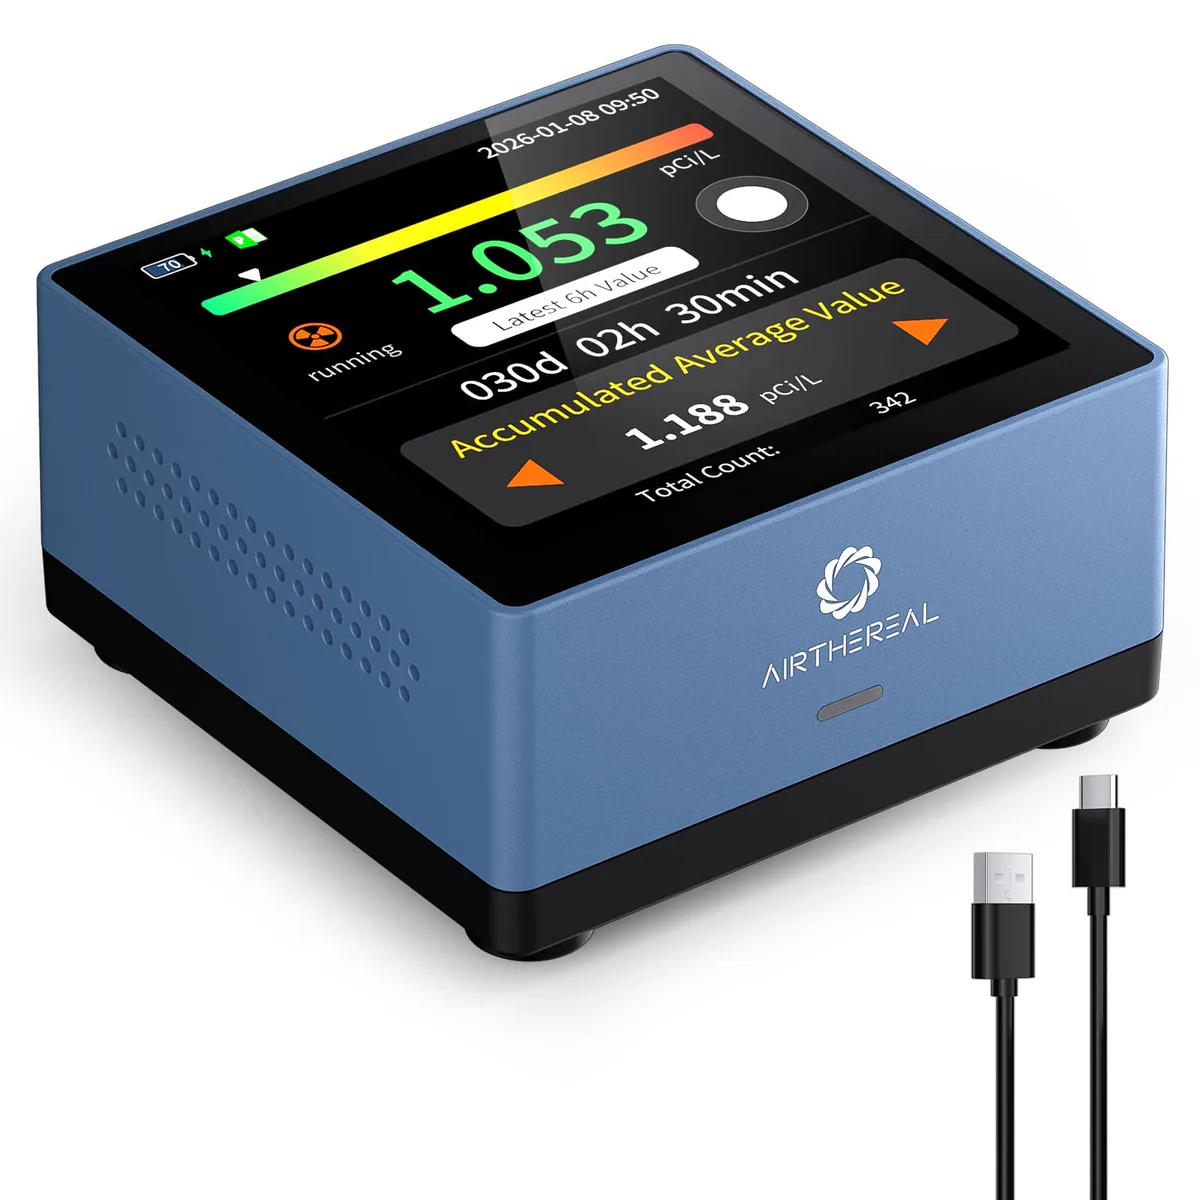
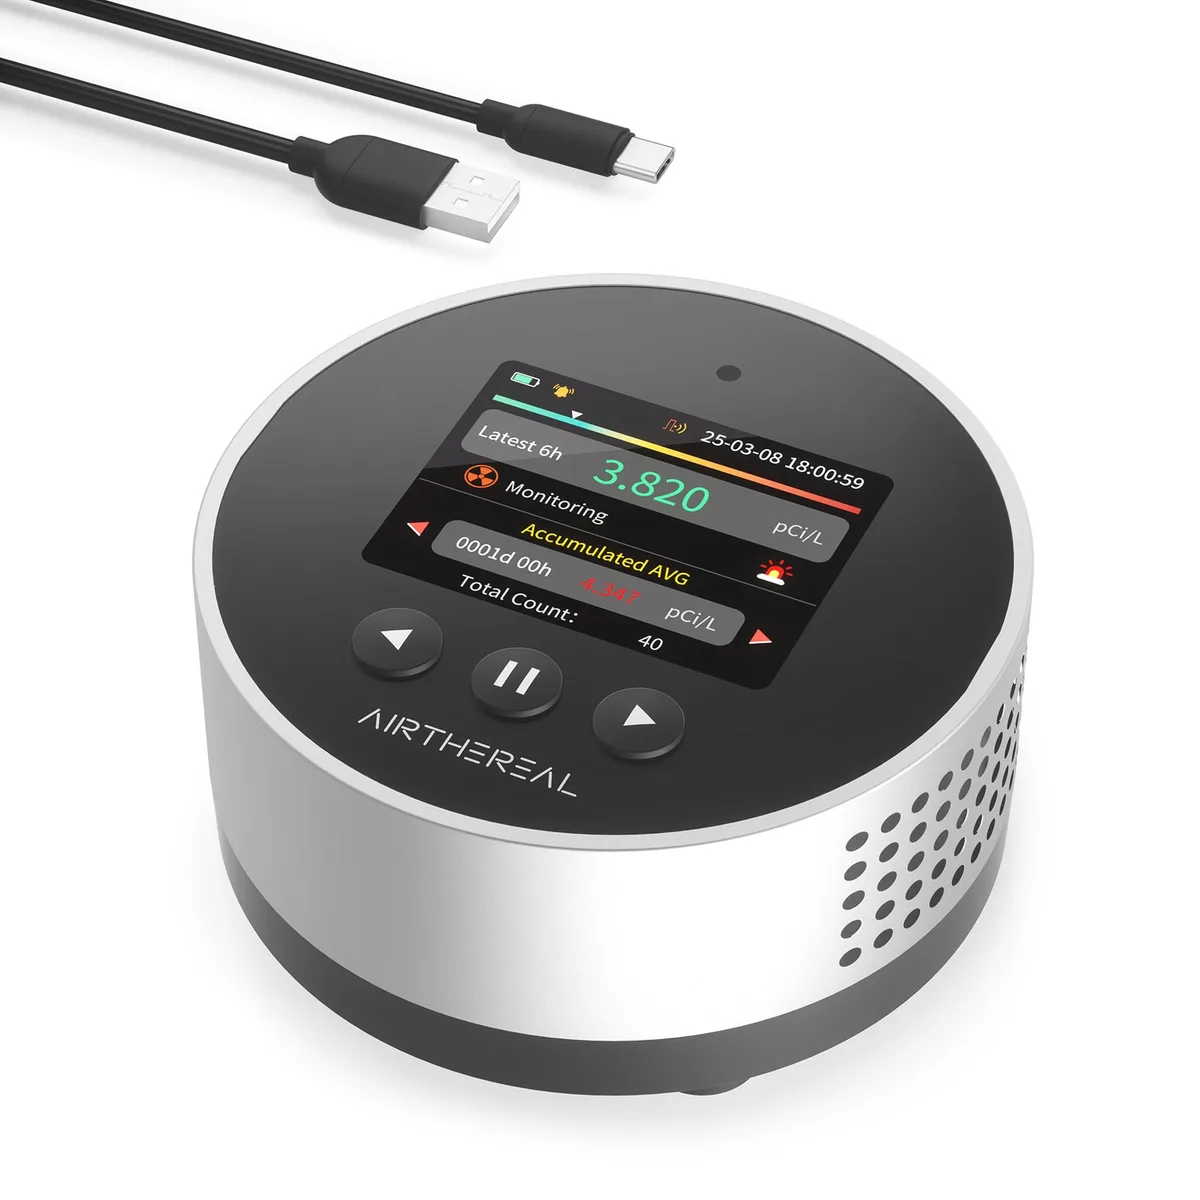
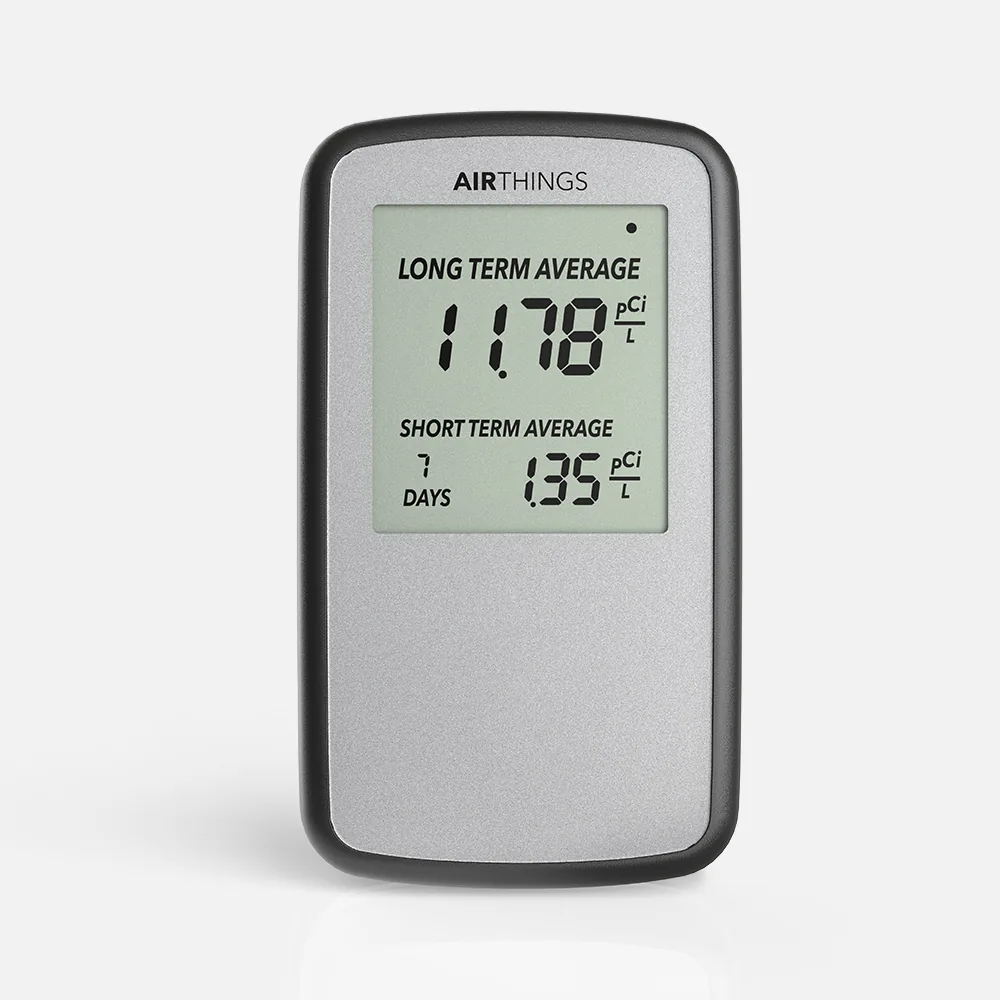
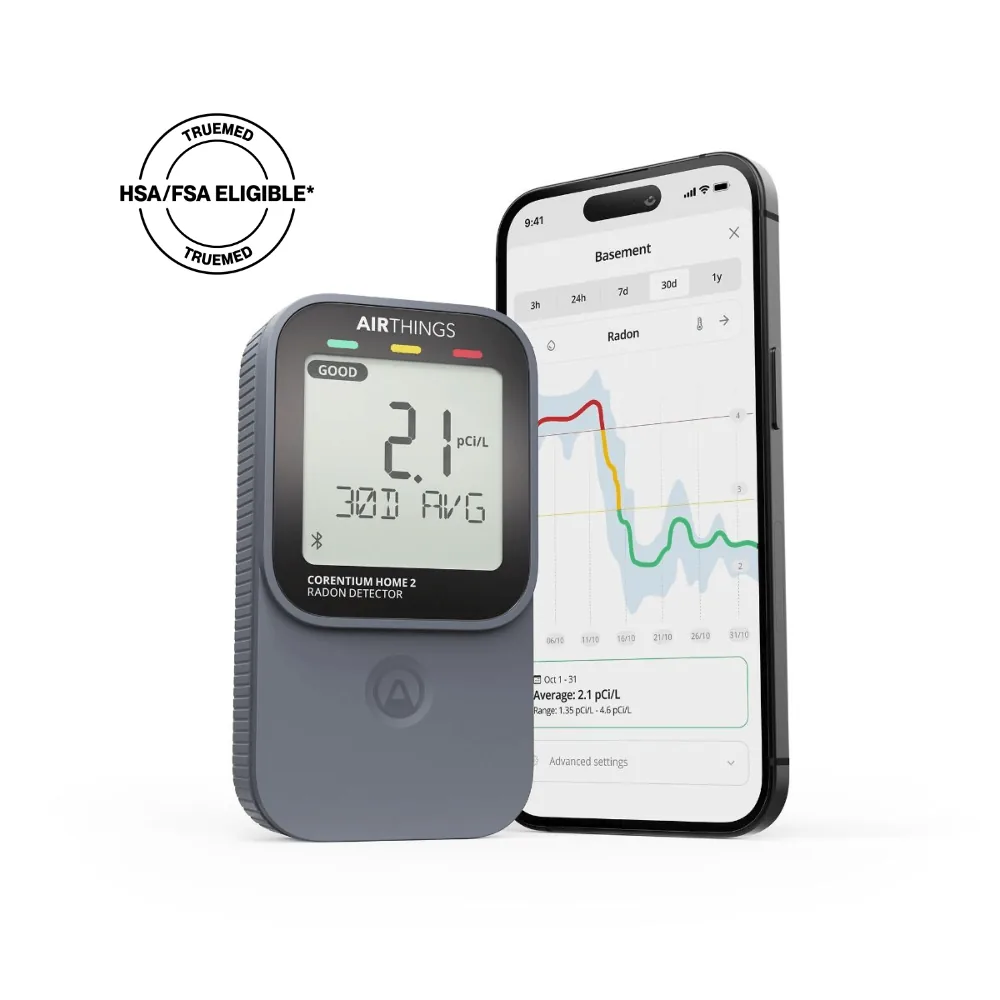
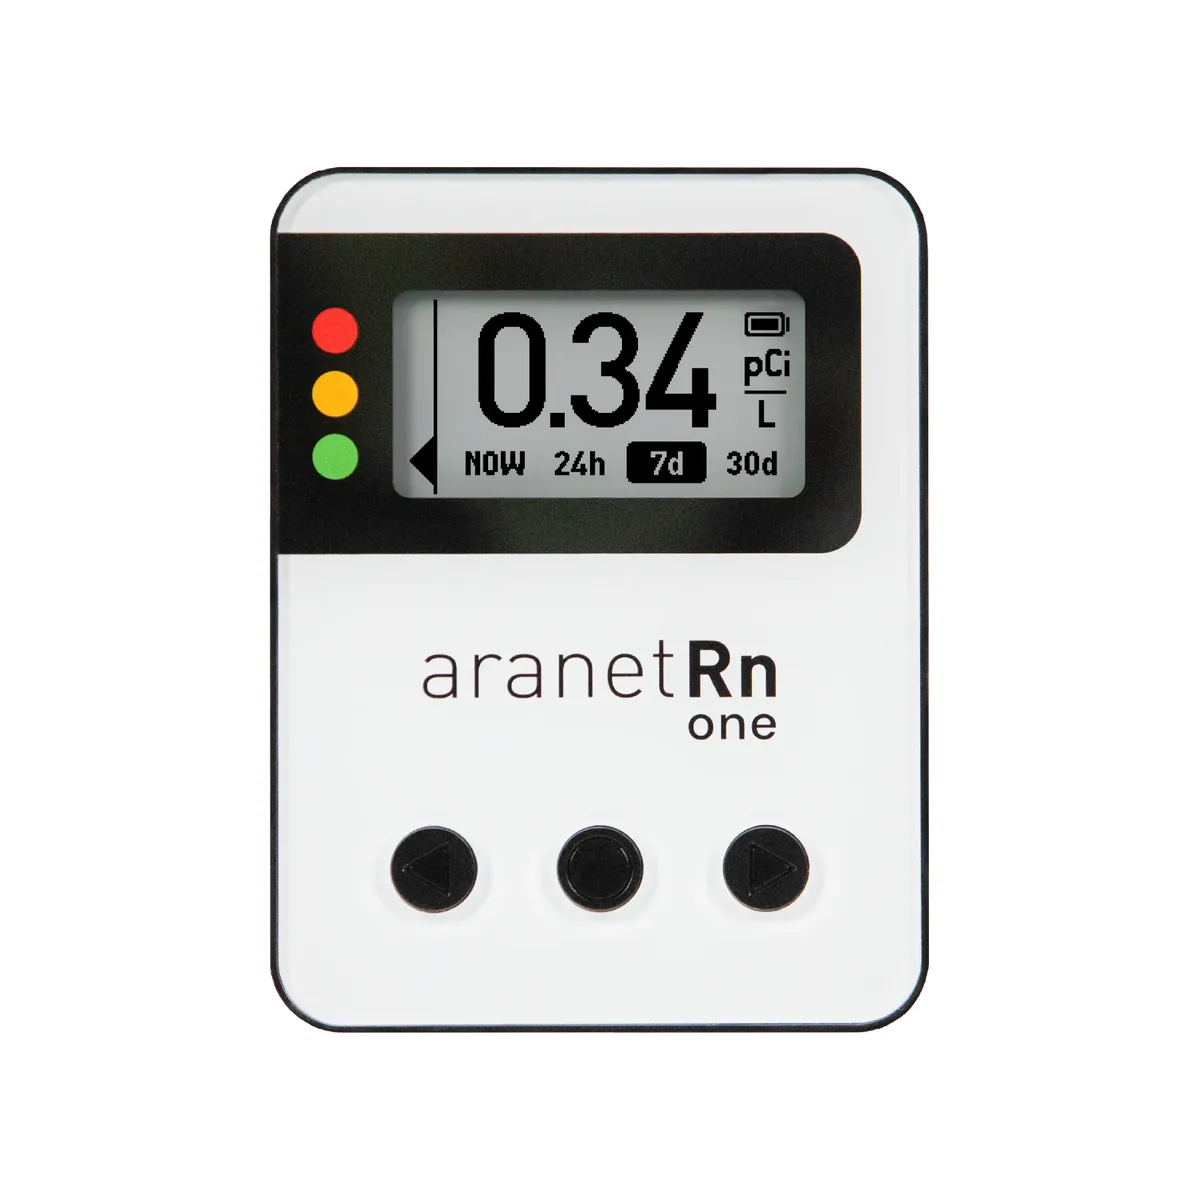
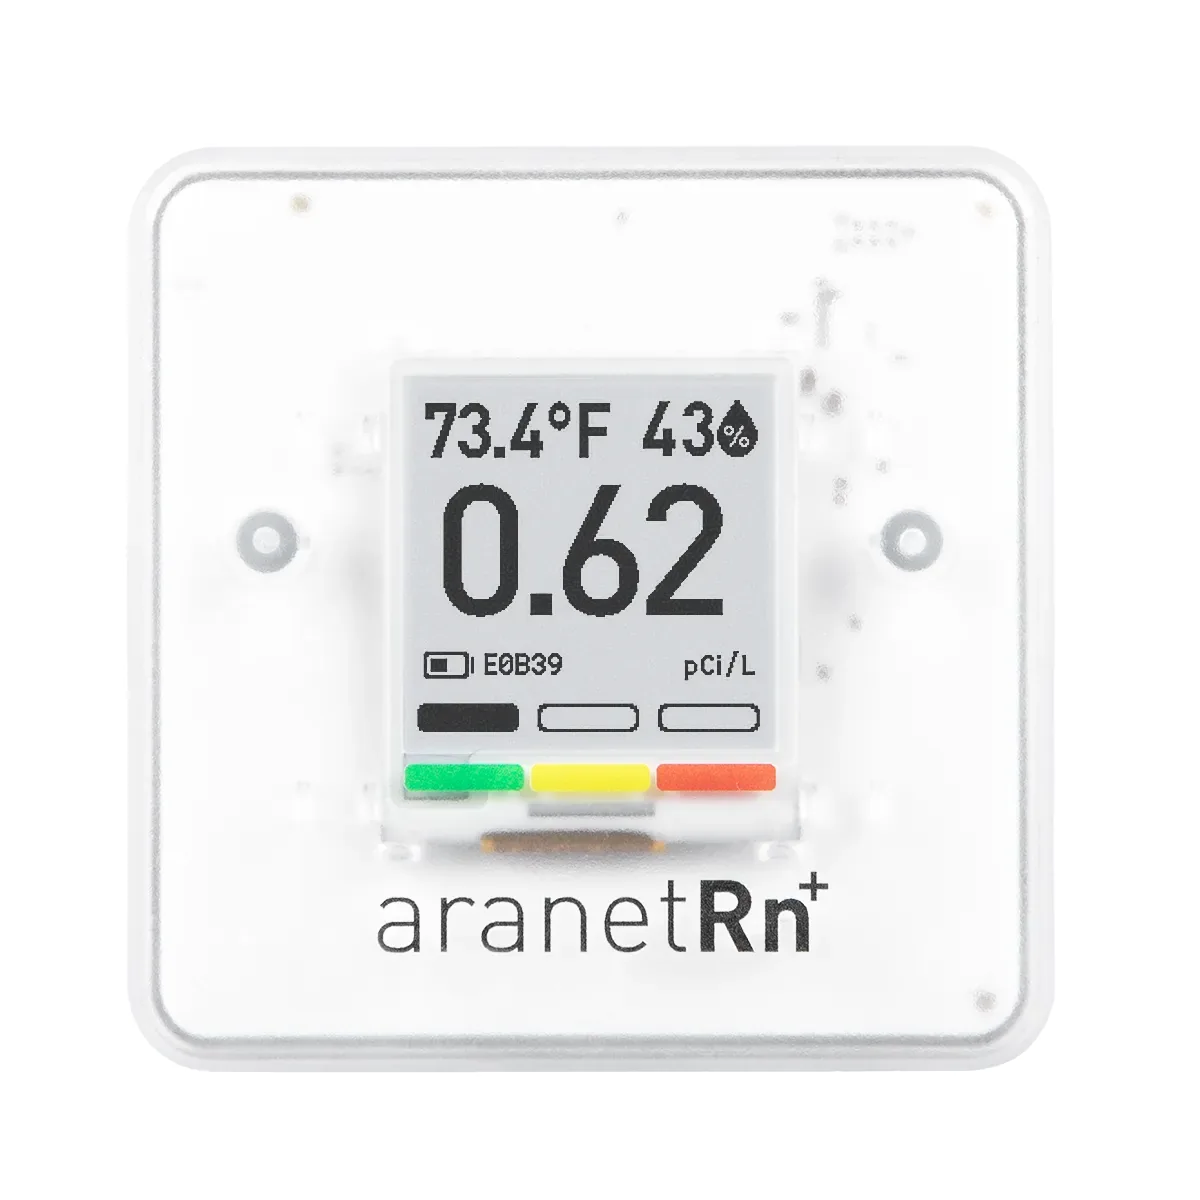
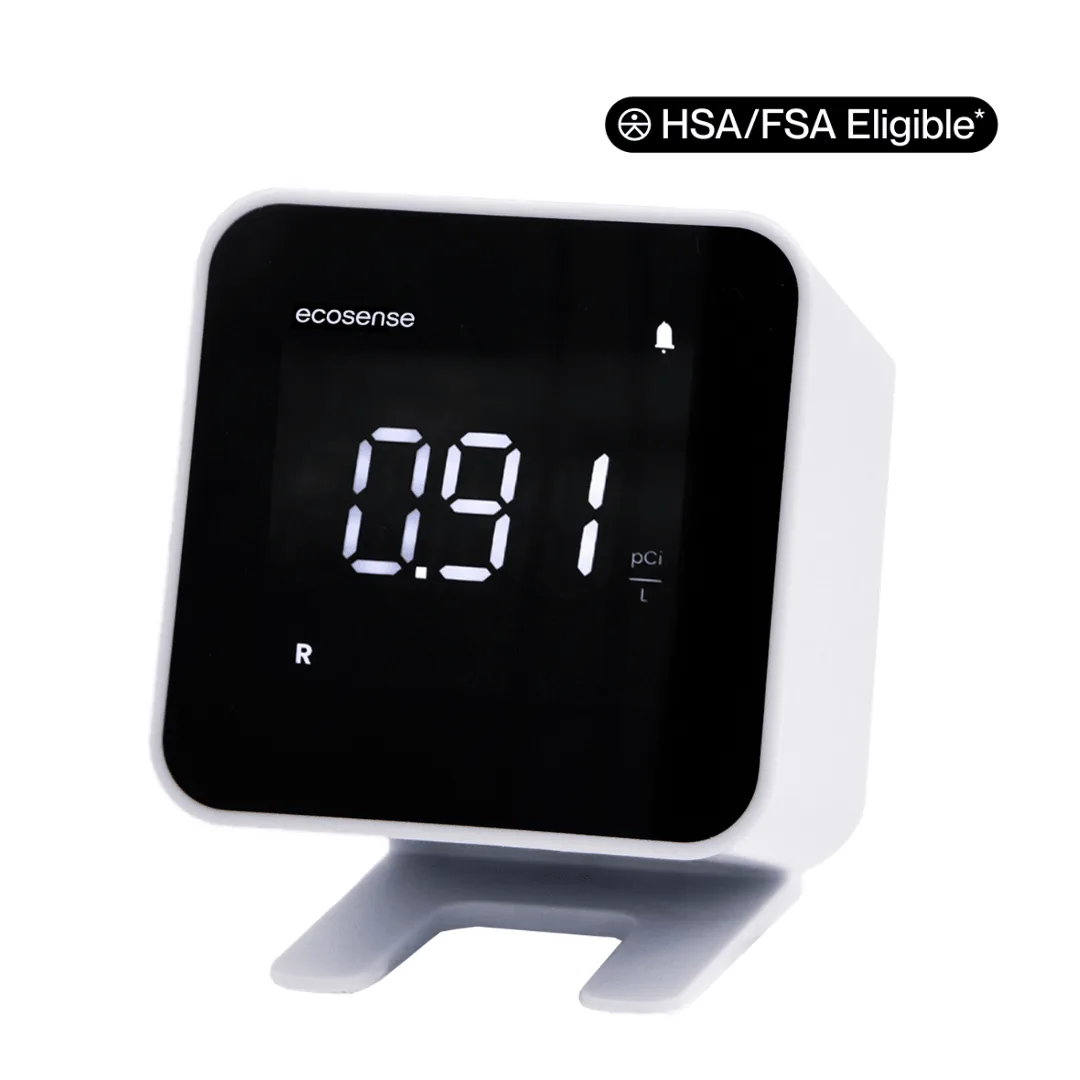
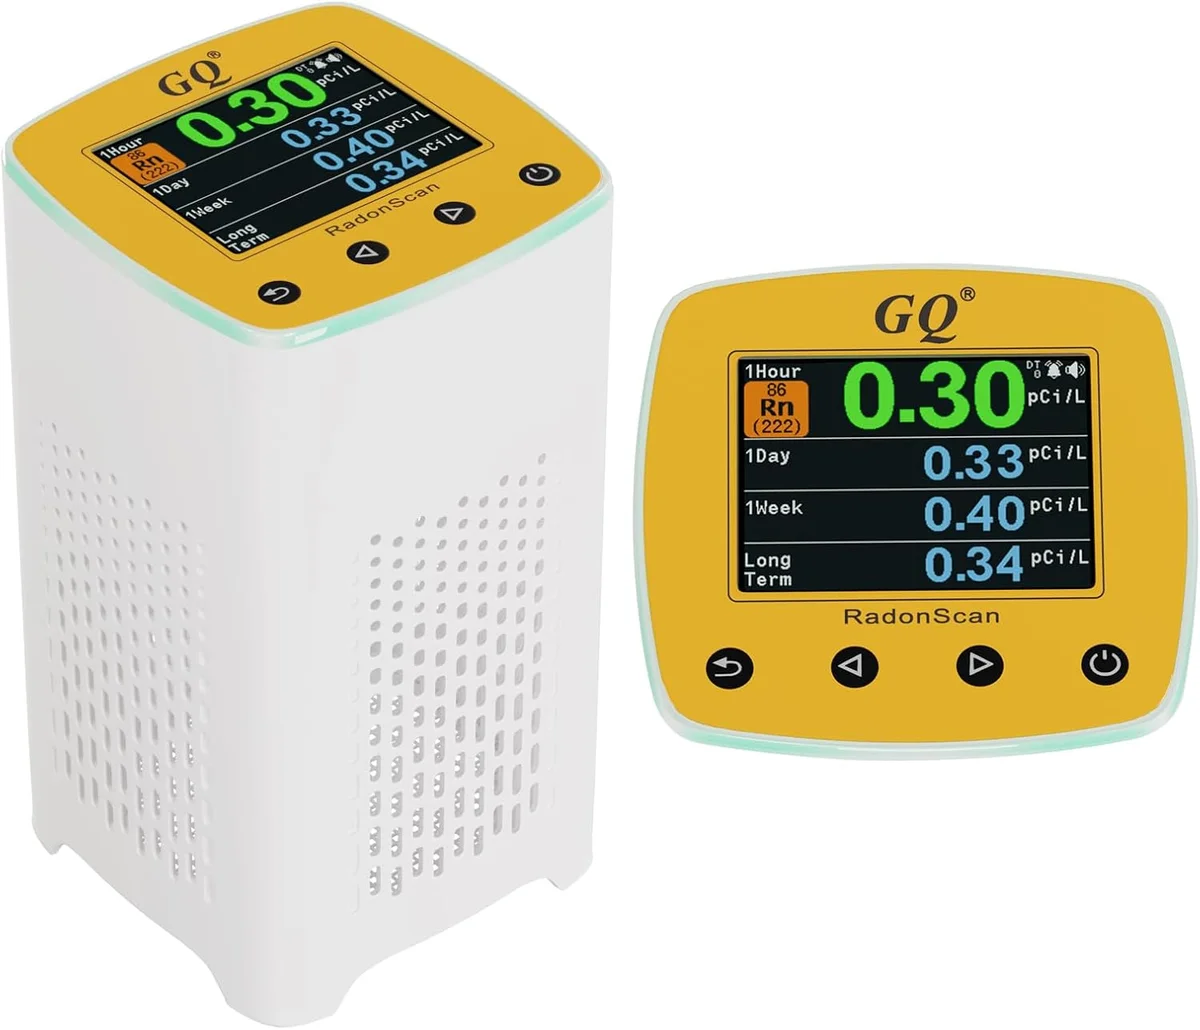
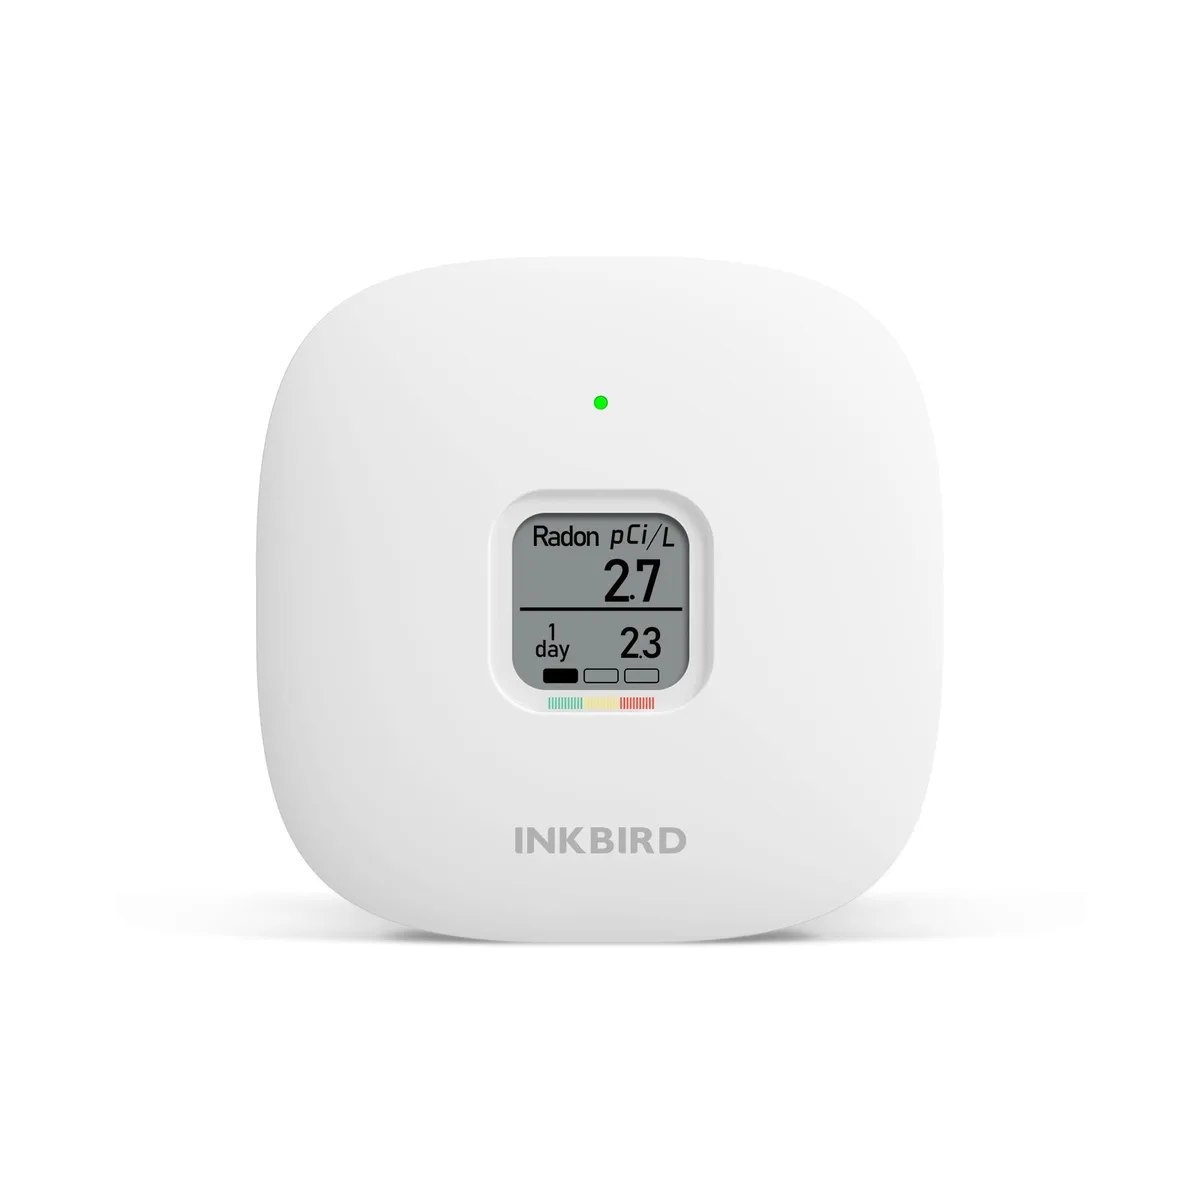
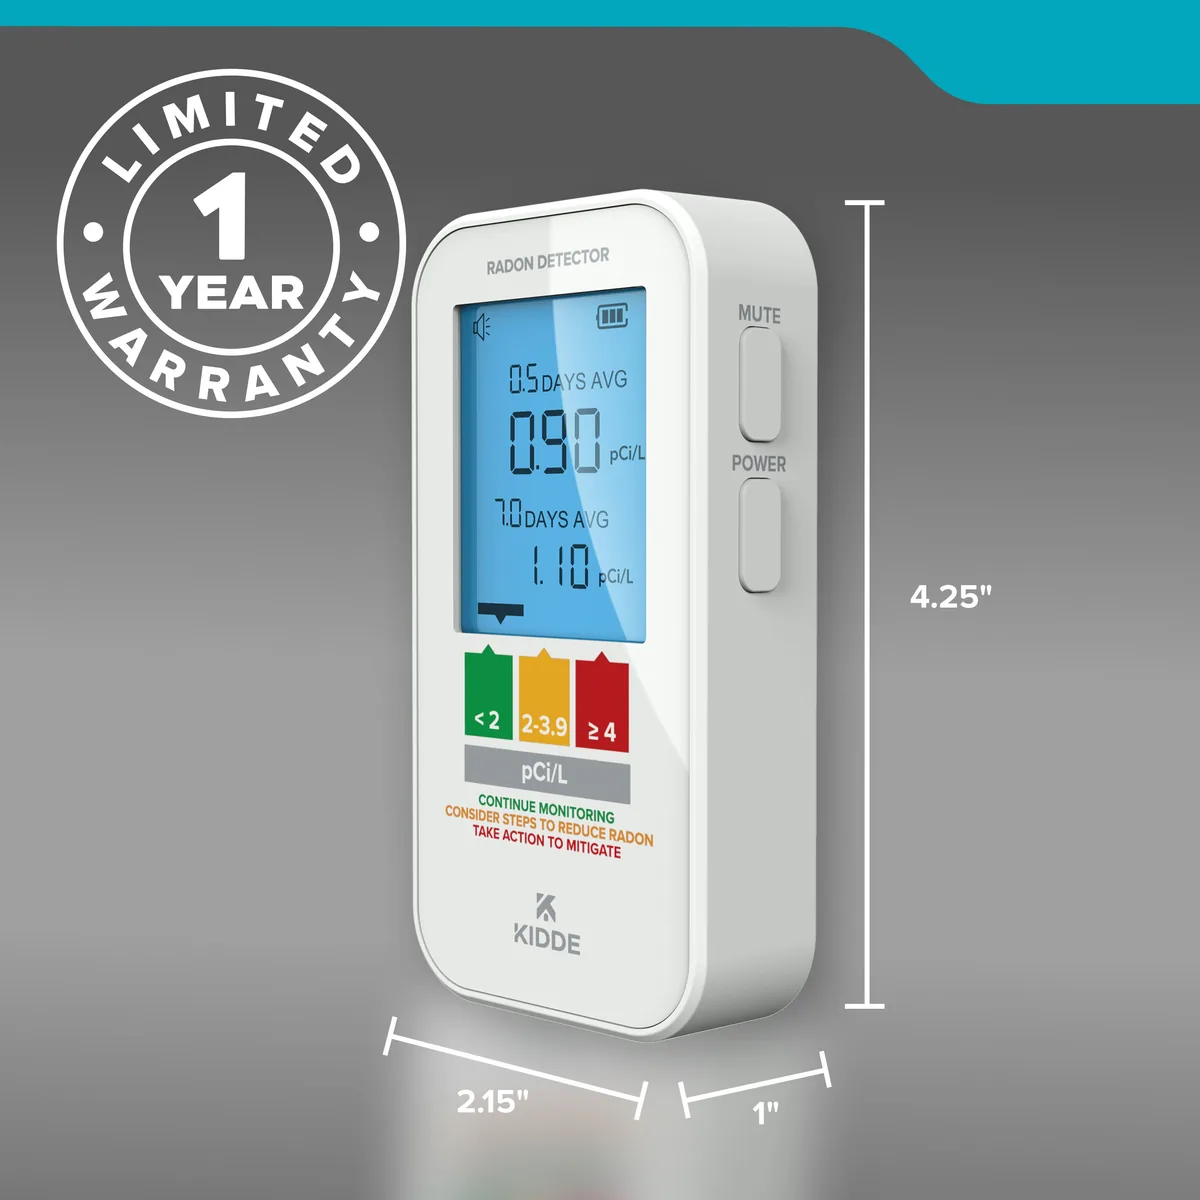
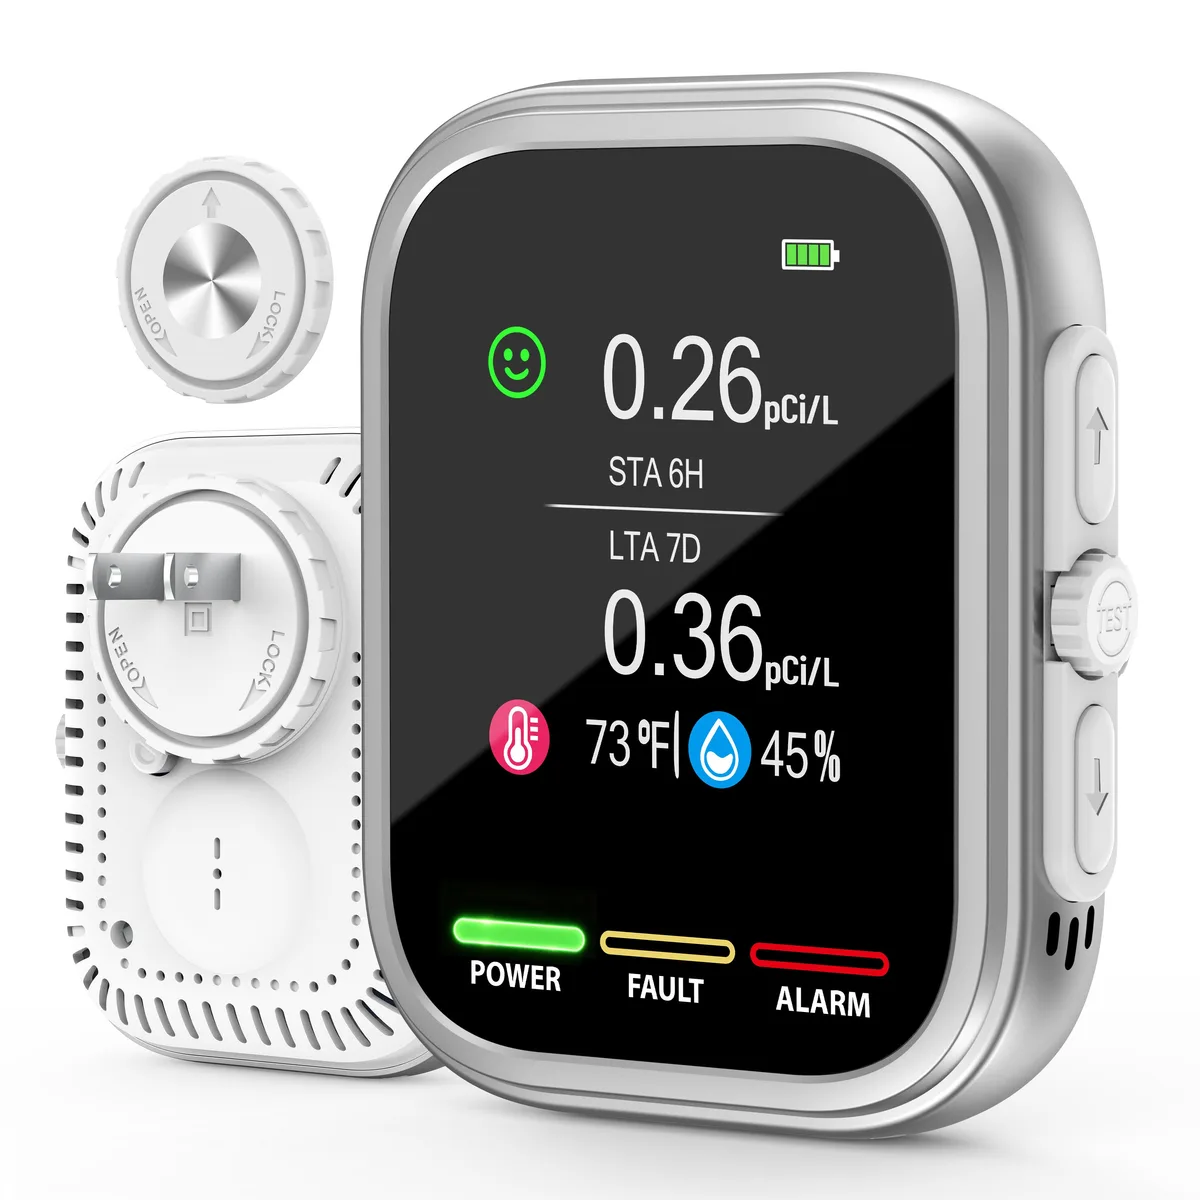
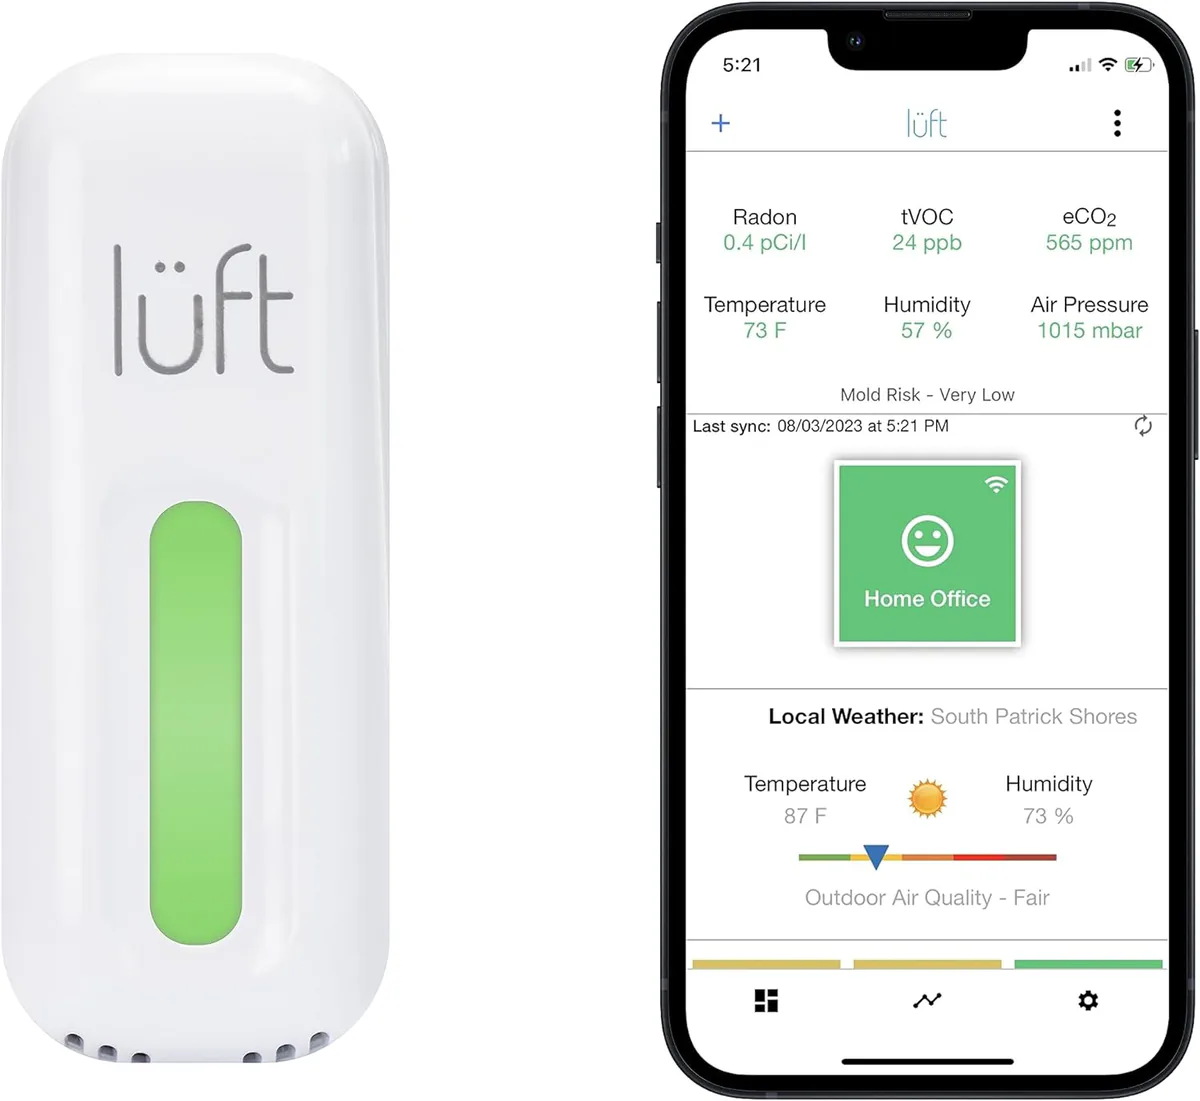
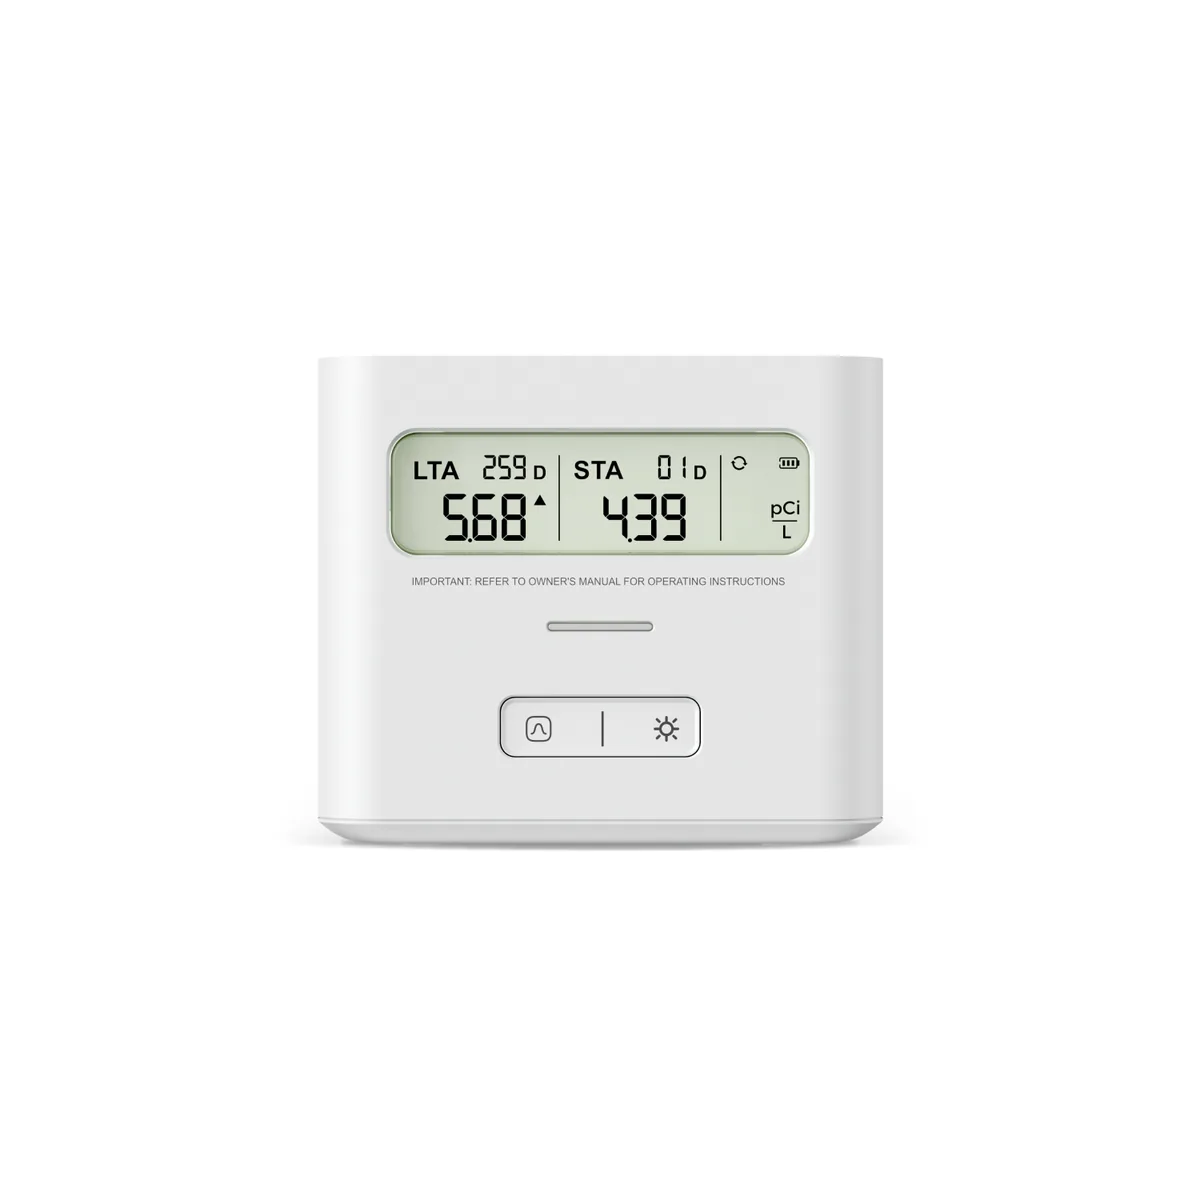
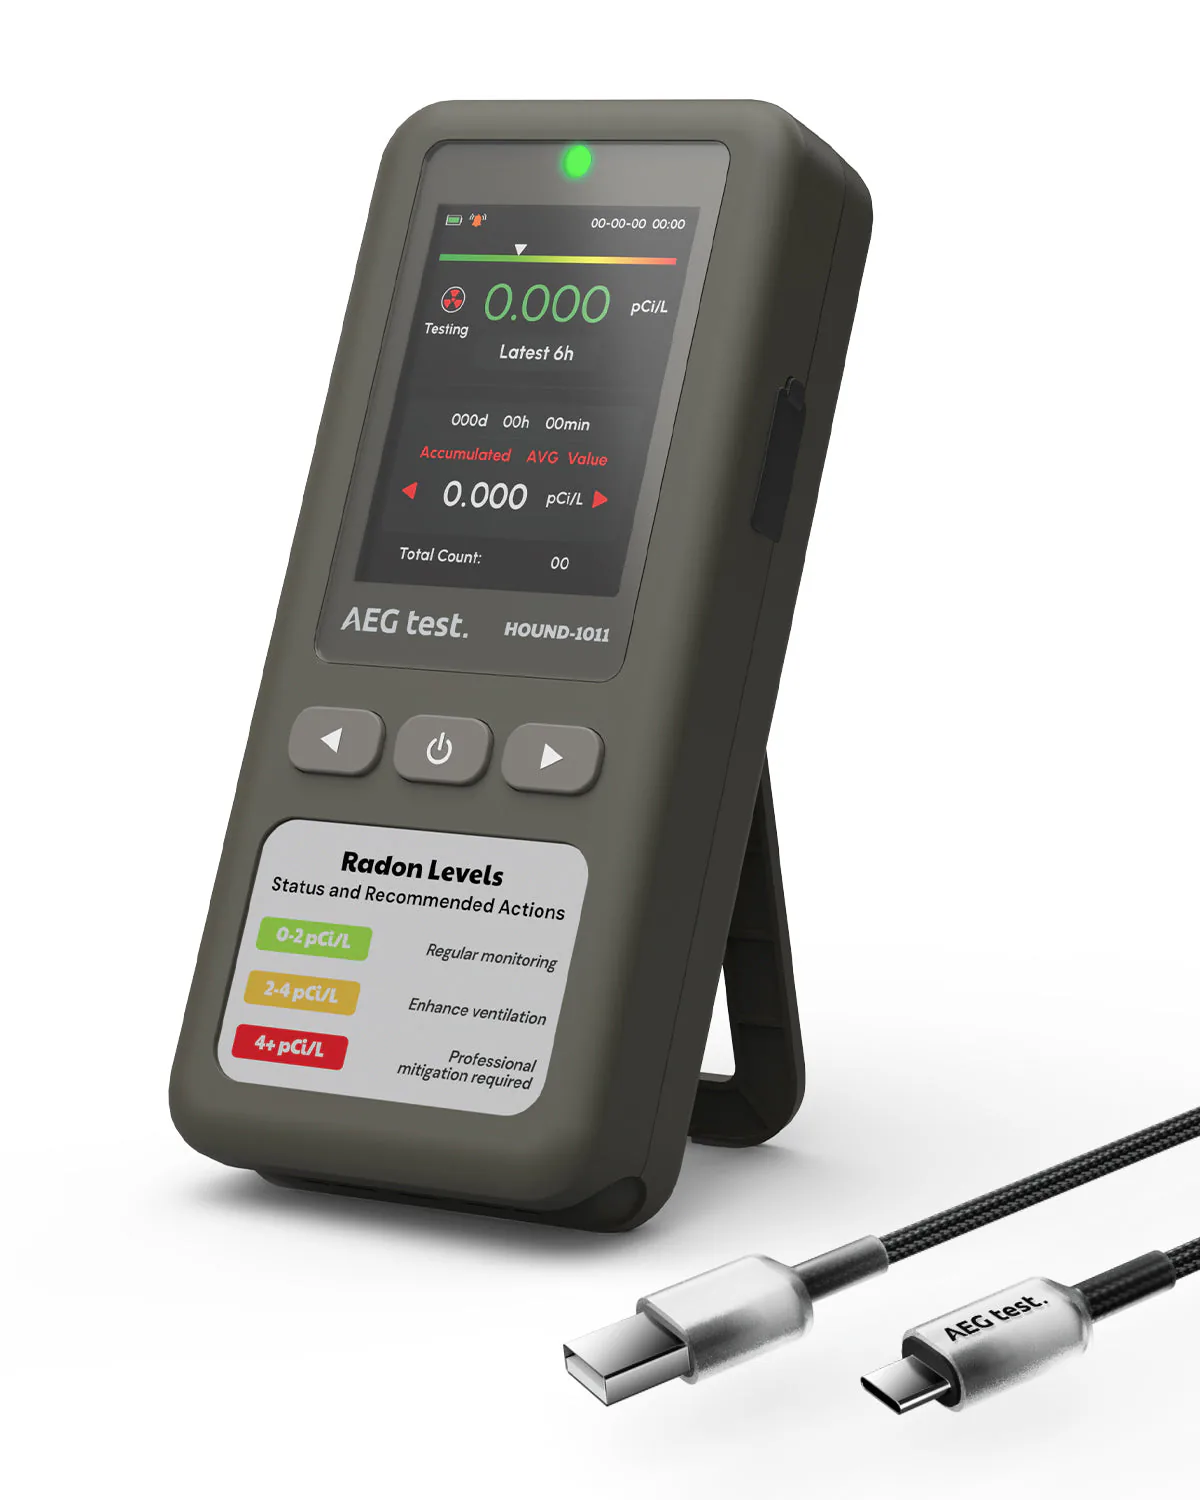
- Digital detectorsConsumer devices that display a running radon reading without a lab.
- Water radon testsKits for radon dissolved in well water, analyzed by a lab.
Mitigation
- Mitigation fansThe inline fan that keeps a soil depressurization system running, sized by the installer.
- System indicatorsU-tube manometers and fan alarms that show whether a mitigation system is still working.
- Sealing materialsCrack, joint and sump sealing used alongside a mitigation system, not instead of one.
Virginia / Next steps
What to do next
Learn
Know what radon is
What radon is, how it gets indoors, and why a county zone is not a reading for your home.
Learn about radonTest
Test the building you live in
Short-term or long-term, where the device goes, and closed-house conditions.
How to testFix
Bring a high level down
How a mitigation system works, and the retest that confirms it.
How mitigation worksFind a pro
Hire a certified professional
Measurement and mitigation professionals by state, with their certifications.
Find a professional
Informational. Follow EPA guidance. EPA says all radon tests should be taken for a minimum of 48 hours, with windows and doors closed from 12 hours before a short-term test.