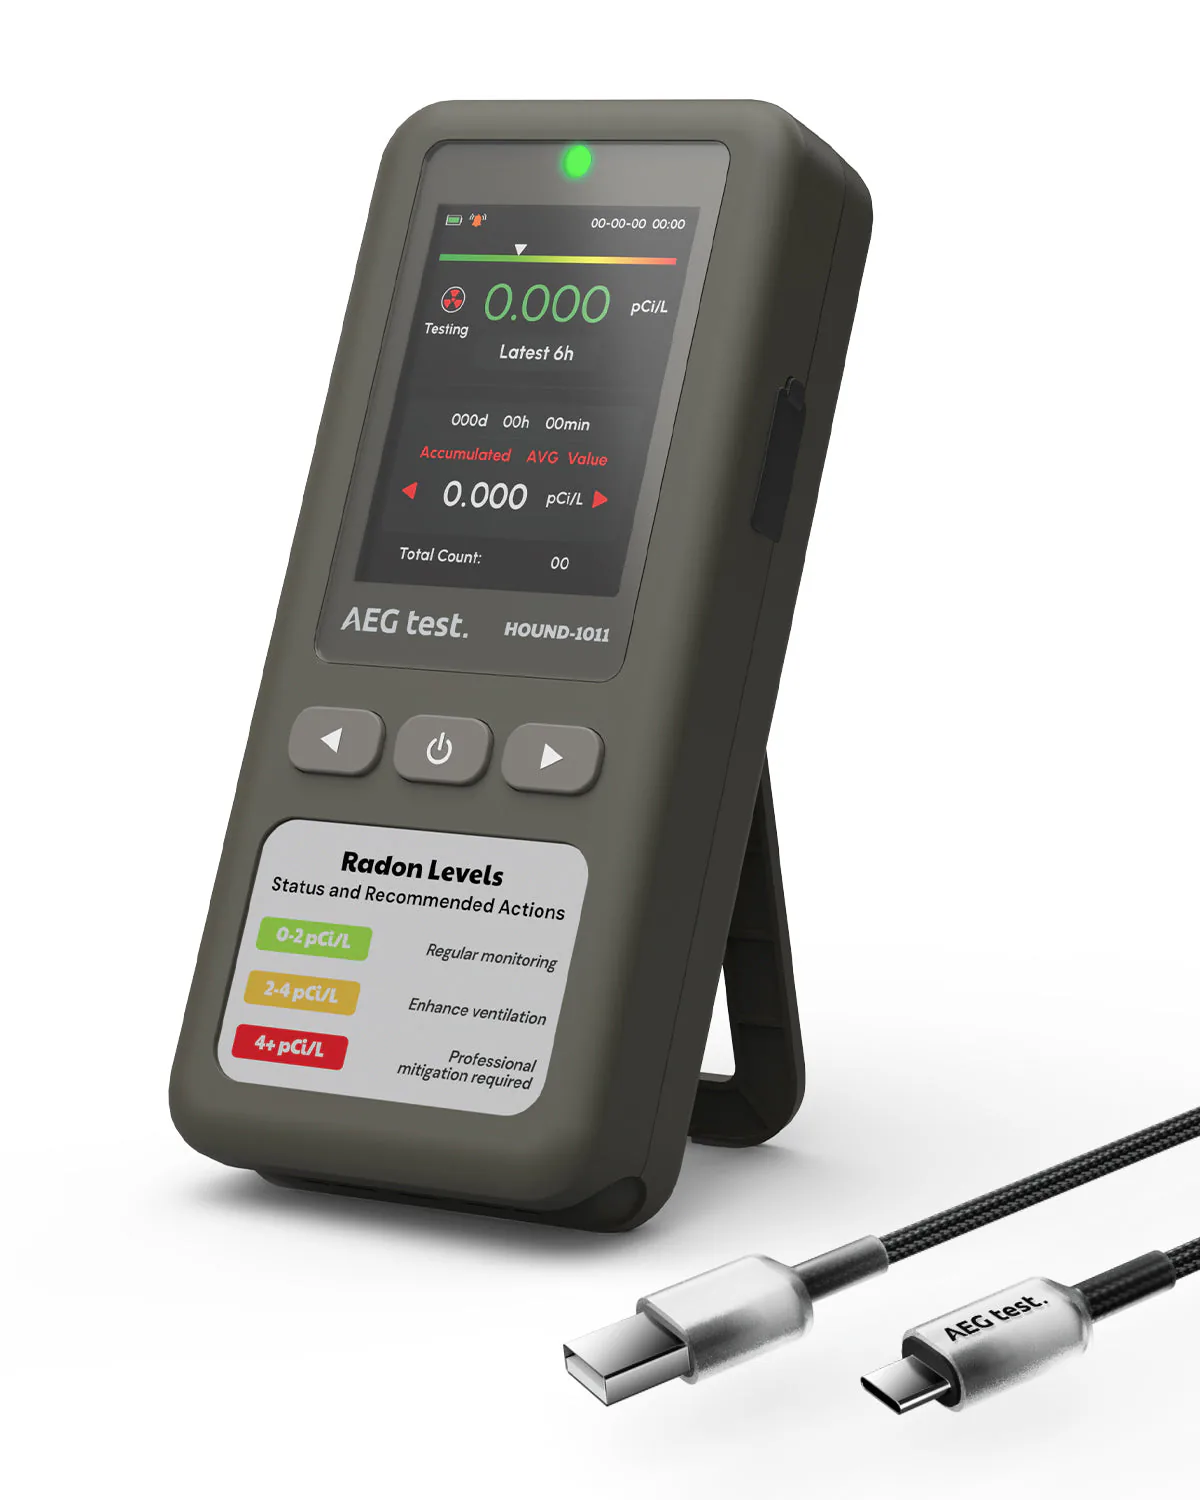
MonitorAEGTEST
HOUND-1011 rechargeable radon detector with a screen
- C-NRPP 2024/25: Not included
- Battery
- Alarm
- Screen
Method: Semiconductor sensor
First reading: Within 6 hours
Locations and reports
Indiana's counties span EPA Zones 1 and 2. Homes with elevated levels occur in all three zones, so only a test measures yours.
Data checked By Radon411Methodology
The data
Indiana, At a glance
Predicted: EPA radon zone
EPA classifies counties, not states. Of the 92 counties in Indiana with a zone, 57 are in Zone 1 and 35 in Zone 2.
An EPA radon zone describes predicted potential across a whole county. It is not intended to determine whether any individual home should be tested, and homes with elevated levels occur in all three zones. EPA recommends testing every home regardless of zone, and testing is the only way to know the radon level in a specific building.
Predicted: EPA Map of Radon Zones
Measured: tests reported to CDC
CDC publishes Indiana's radon test figures by county: 92 of its 92 counties have one. Each one's share is in the county list.
Indiana, Counties
Indiana's radon map, then all 92 counties by the zone EPA predicts for each, highest reported share of tests at or above 4 pCi/L first. Each has its own report.

Local help
Indiana, Local resources
Who to ask in Indiana: its radon program, test kits and professionals.
To purchase a low-cost radon short term or long term test kit, please visit the American Lung Association
According to the Indiana Radon Rule, 410 IAC 5.1, everyone who is serving Indiana by doing radon testing, analysis and mitigation (radon reduction) in residential structures must be certified by the Indiana State Department of Health.
Radon Action Brief
National Radon Action MonthPre-sale
Save 64%Sale price: $8.99Price after the sale: $25Ends Jan 31Then $25Sale ends January 31, then $25
What it means
Indiana, Questions
EPA's Map of Radon Zones places 57 of the 92 Indiana counties it classifies in Zone 1, the highest predicted potential, 35 in Zone 2 and 0 in Zone 3. An EPA radon zone describes predicted potential across a whole county. It is not intended to determine whether any individual home should be tested, and homes with elevated levels occur in all three zones. EPA recommends testing every home regardless of zone, and testing is the only way to know the radon level in a specific building.
Radon411's Indiana directory lists 13 radon businesses for testing, mitigation or both, each with the licensing list it was read from. EPA recommends having a qualified contractor fix a home with a radon problem, because lowering high radon levels takes technical knowledge and special skills, and some states require the work to be done by a licensed or certified professional.
How radon mitigation worksWhat mitigation costsRadon professionals in Indiana
57 counties are in Zone 1: Adams County, Allen County, Bartholomew County, Benton County, Blackford County, Boone County, Carroll County, Cass County, and 49 more in the county table on this page. Zone 1 is EPA's class for highest predicted potential, a predicted average indoor screening level greater than 4 pCi/L. A zone is a prediction for a county, not a measurement of any home.
Radon in Adams CountyRadon in Allen CountyRadon in Bartholomew County
EPA says you can test your home yourself or hire a qualified radon test company, and that either approach takes only a small amount of time and effort. The Indiana radon program is the place to ask about certified testers and any test kit offer it runs.
How to test a homeFree and low-cost kits by stateIndiana radon program
92 of Indiana's 92 counties have an EPA radon zone published here. Radon411 will not rank counties on data it does not hold, and a zone is a prediction for an area rather than a measurement of any building.
CDC has published no statewide radon testing statistics for Indiana, so we cannot give a figure. Where CDC does publish one, the percentage describes radon tests reported to CDC, not homes.
Indiana is in EPA Region 5: Great Lakes.
Yes, wherever you live in the state. Testing is the only way to know the radon level in a specific building. EPA recommends fixing a home when the radon level is 4 pCi/L or higher. EPA recommends considering a fix when the level is between 2 and 4 pCi/L.
A statewide figure averages counties with very different geology and very different numbers of reported tests, so it hides more than it shows. The county report is the level at which the EPA zone, the geologic potential and the reported testing statistics are actually published, which is why the county table above links to every one of them.
The zone counts on this page describe counties across Indiana. They are predictions for areas, and none of them measures your building.
What the published data says about Indiana, in words. A zone and a share of tests describe an area, never the level in any one home.
EPA places 57 of Indiana's 92 counties in Zone 1 and 35 in Zone 2.
Zone 1 counties, A to Z, begin with Adams County, Allen County and Bartholomew County; the county section below lists all 57.
62% of Indiana's counties with a zone on file are in Zone 1, a larger share than across all U.S. counties (34%). It is a share of counties, not of land, people or homes.
CDC has no statewide testing figure for Indiana on file here.
92 of the 92 counties have a published county figure; the most tests in each one's latest year were reported for St. Joseph County (7,346 tests over 2008 to 2017, laboratory), Allen County (3,990 tests over 2008 to 2017, laboratory) and Marion County (3,668 tests over 2008 to 2017, laboratory).
Indiana's radon program and its page are under Local resources.
2 cities have a page setting the figures of the counties it lies in side by side: Bloomington and Fort Wayne.
Products
Indiana, Products
Whatever the figures for Indiana show, only a test tells you about one home.
MonitorAEGTEST
Method: Semiconductor sensor
First reading: Within 6 hours
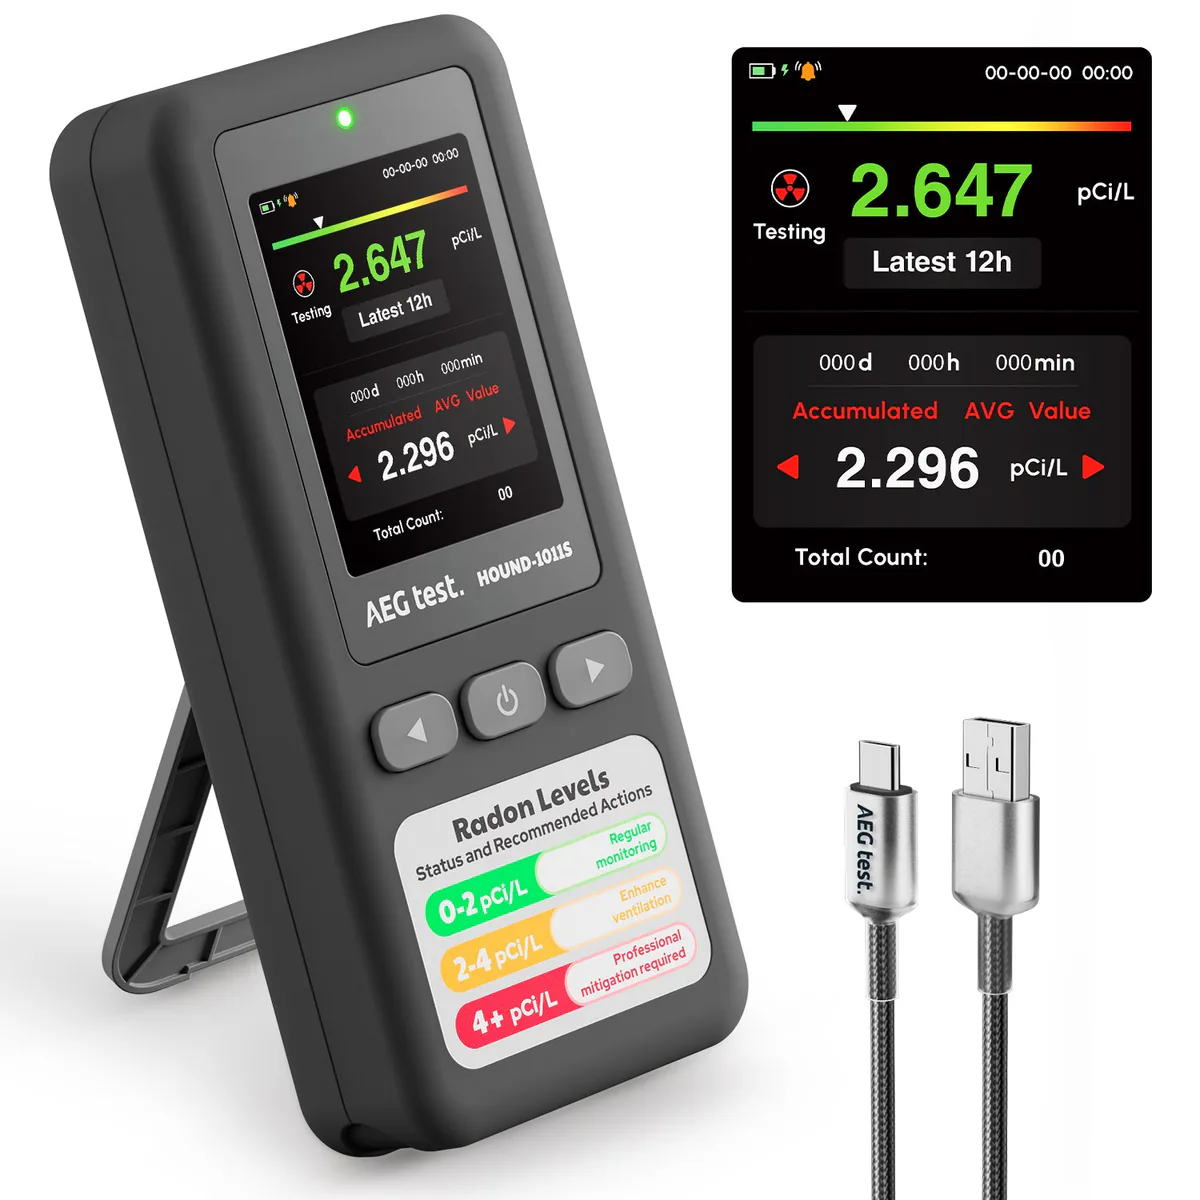
MonitorAEGTEST
Method: Semiconductor sensor
First reading: Within 12 hours
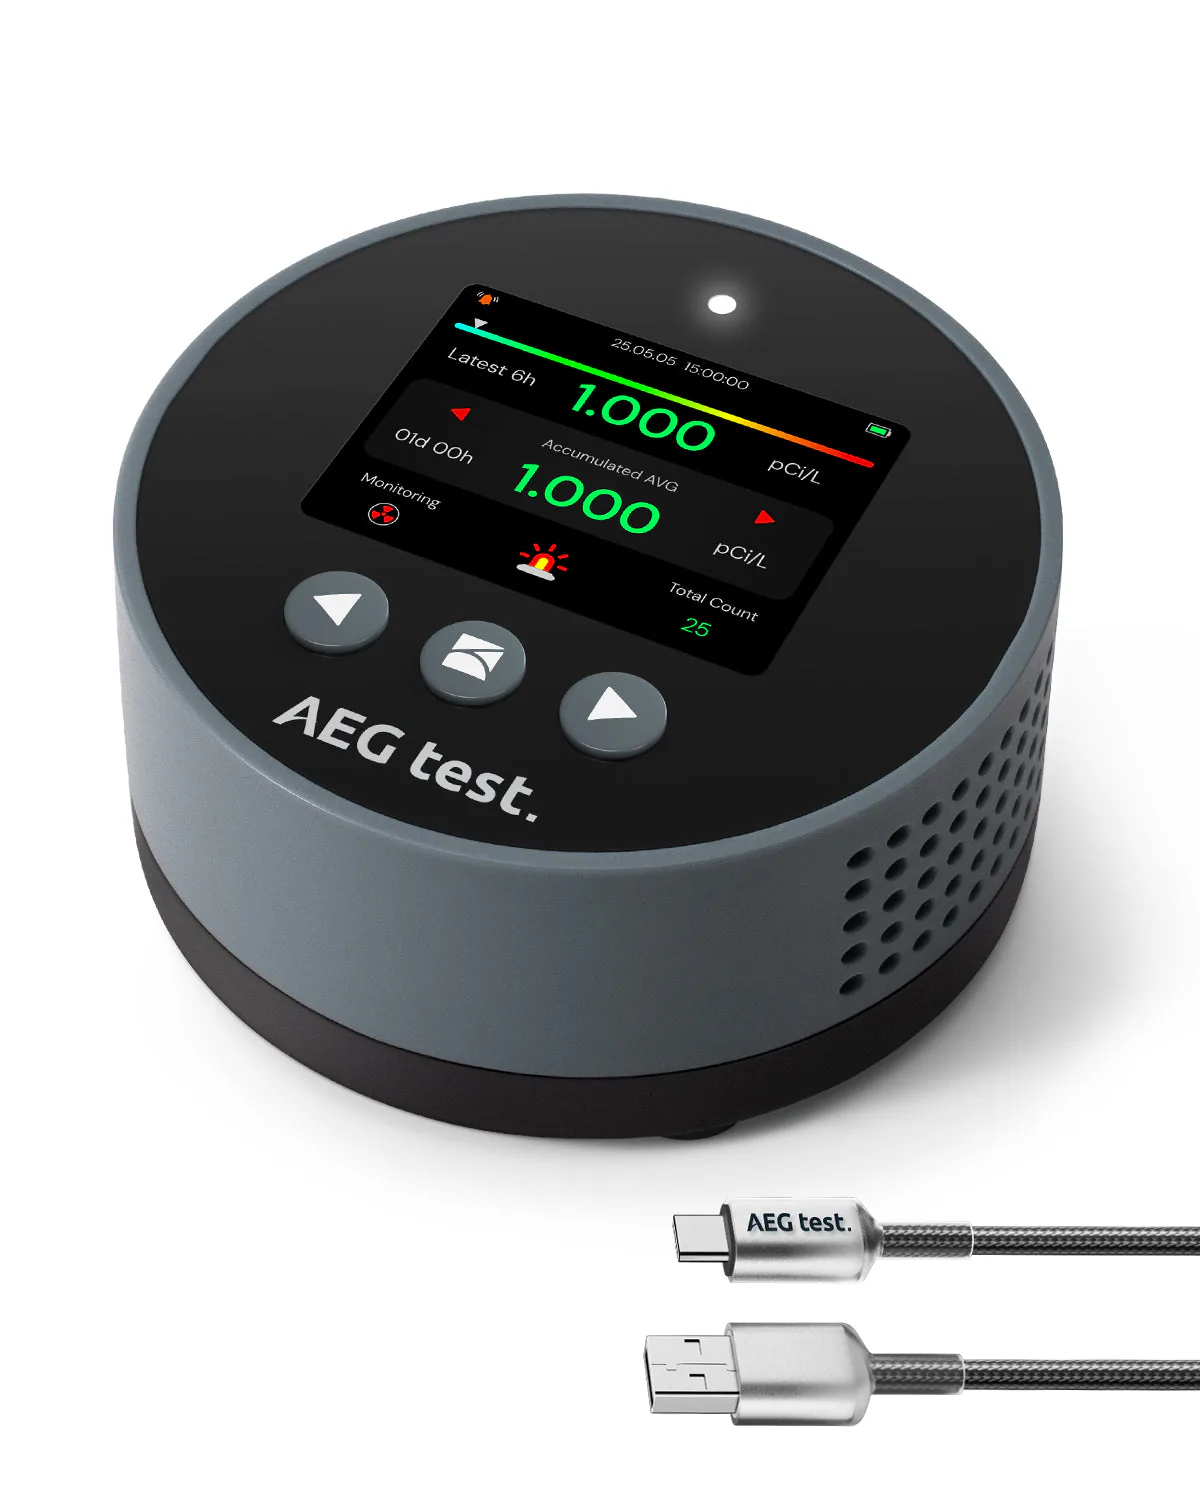
MonitorAEGTEST
Method: Semiconductor sensor
First reading: Within 6 hours
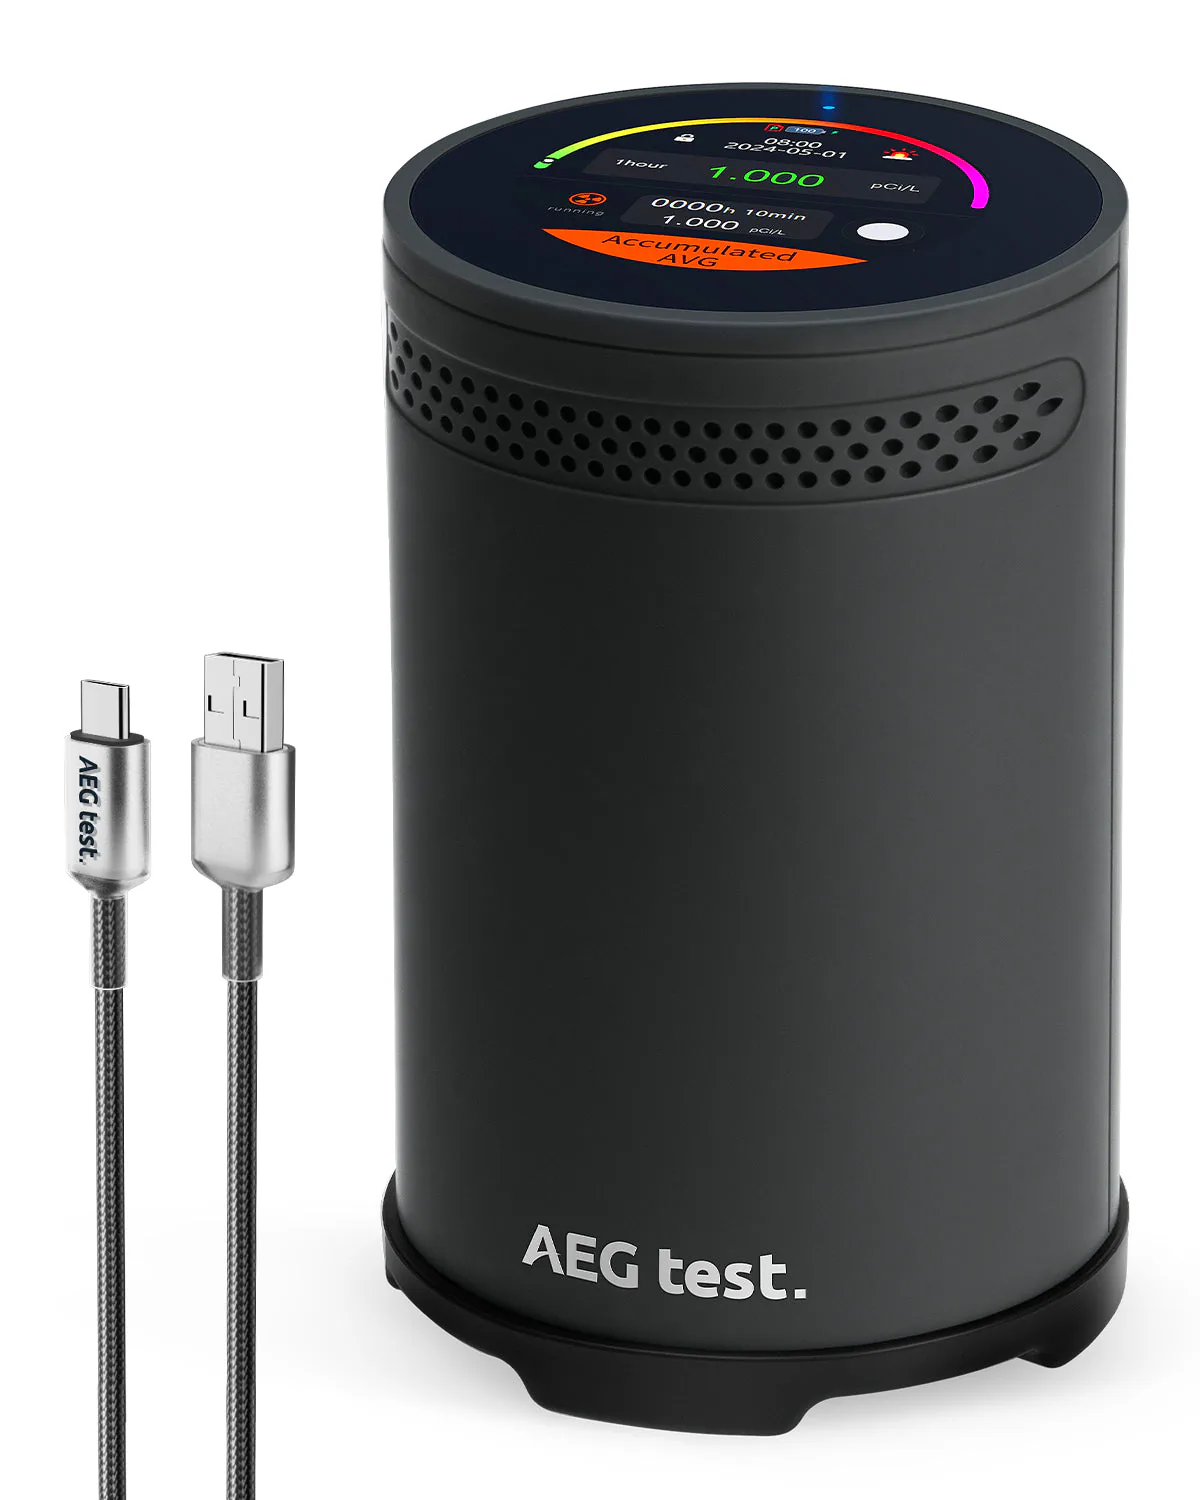
MonitorAEGTEST
First reading: Within 1 hour
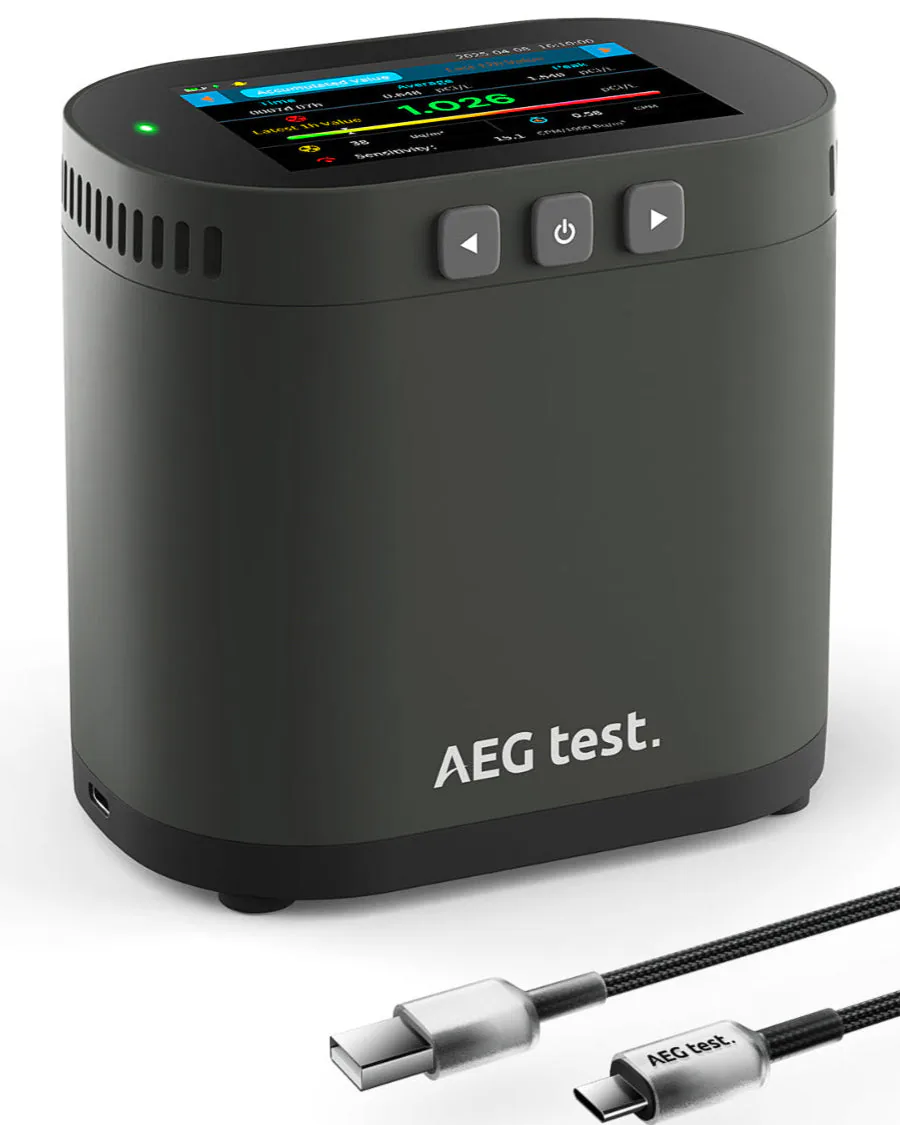
MonitorAEGTEST
Method: Ion chamber
First reading: Within 10 minutes
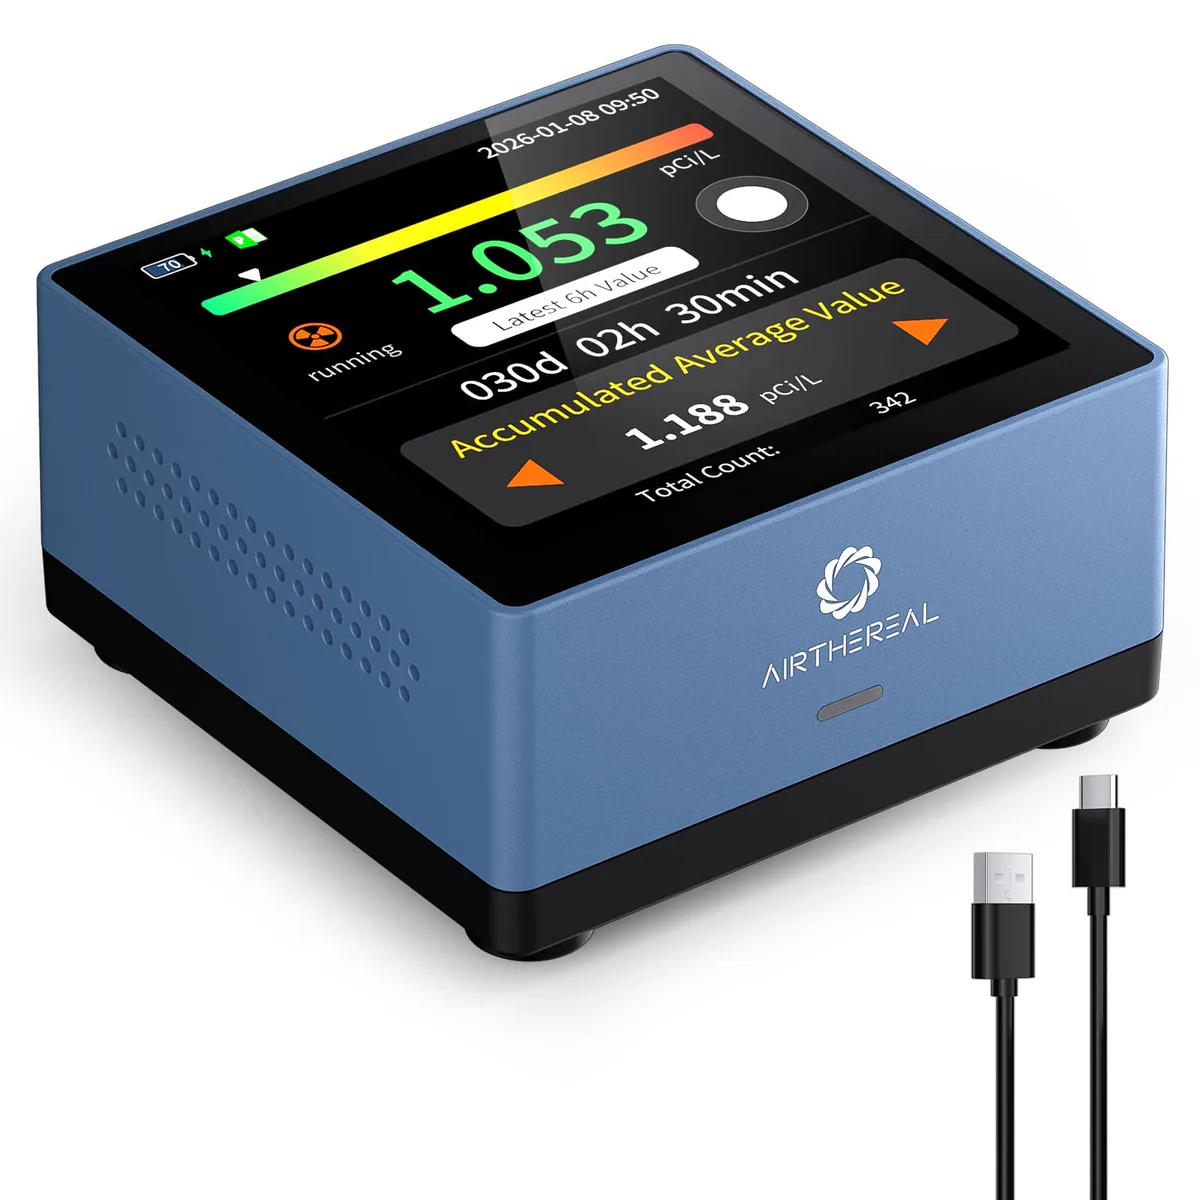
Monitor
Method: Semiconductor sensor
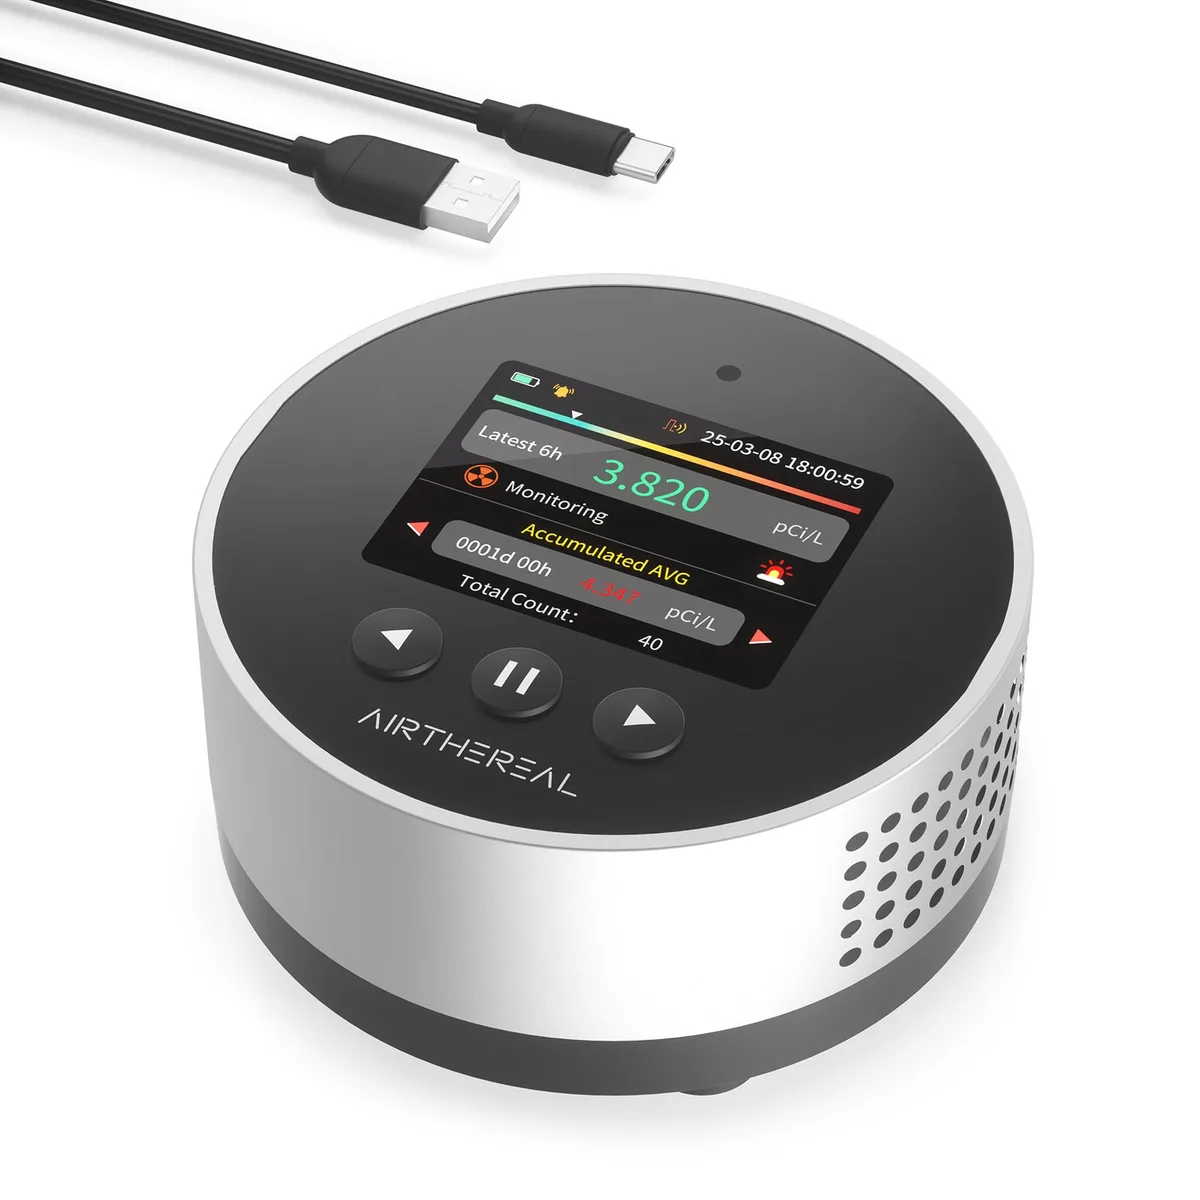
Monitor
Method: Semiconductor sensor
First reading: Within 6 hours
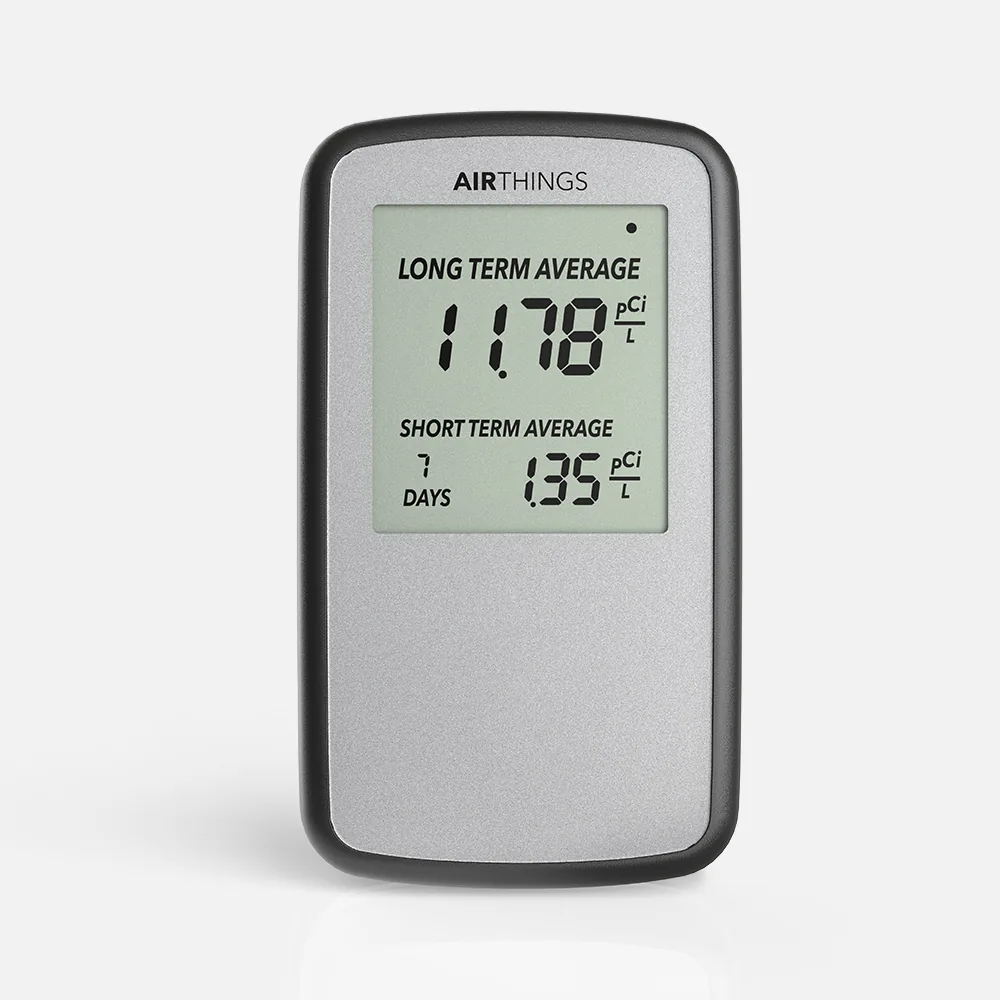
Monitor
Method: Alpha spectrometry
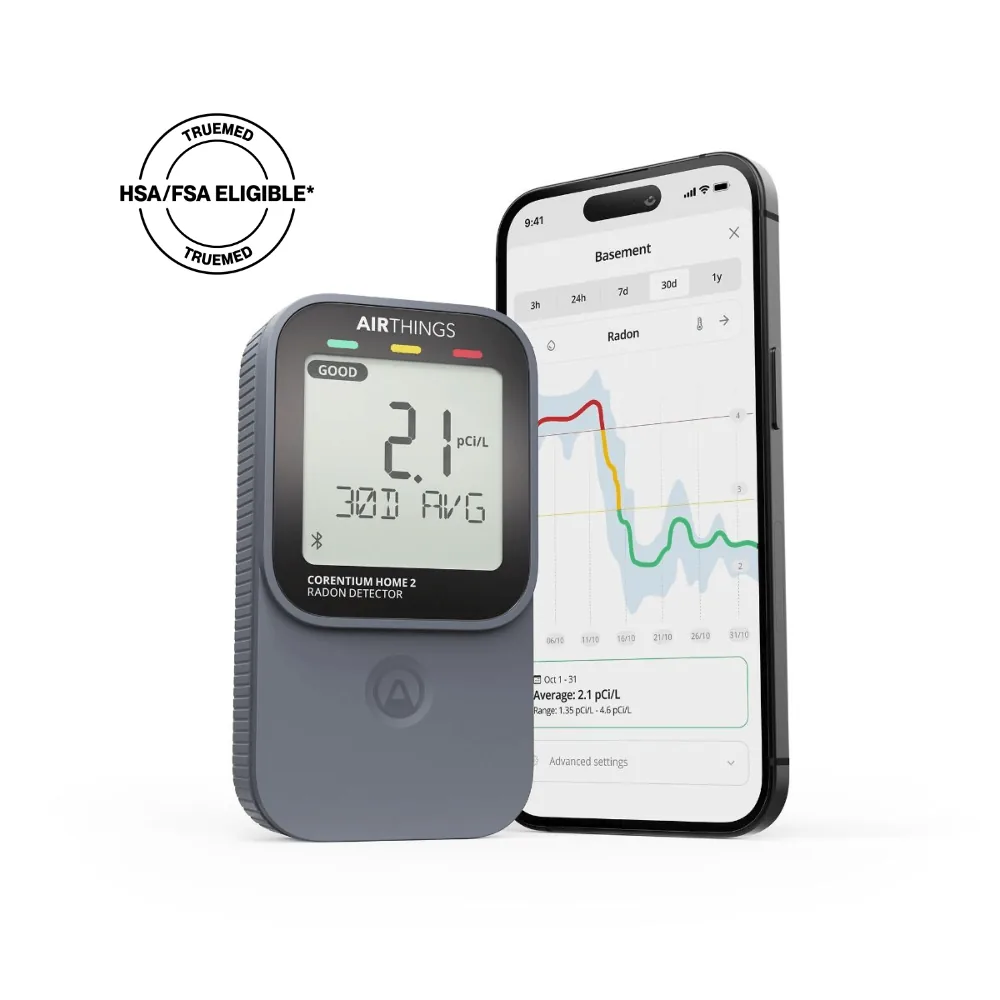
Monitor
Method: Alpha spectrometry
Readings: Every 60 minutes
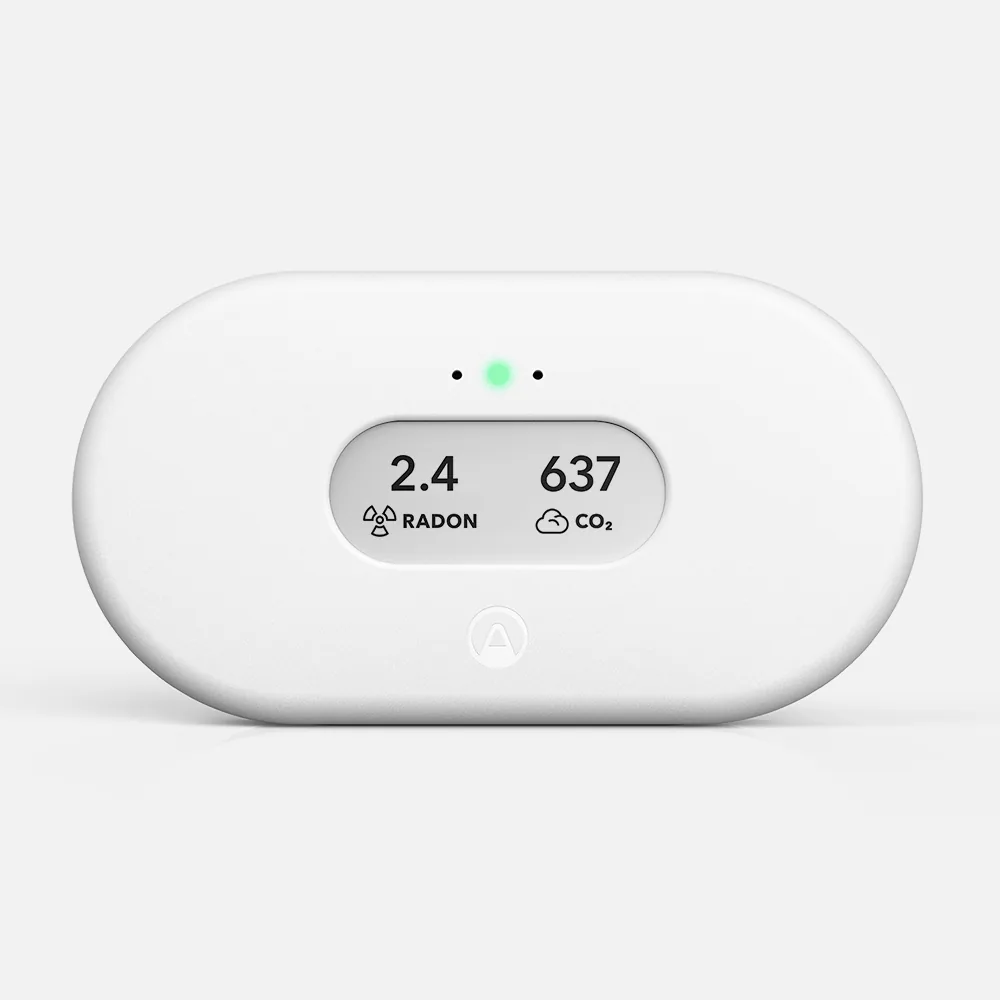
Monitor
Method: Alpha spectrometry
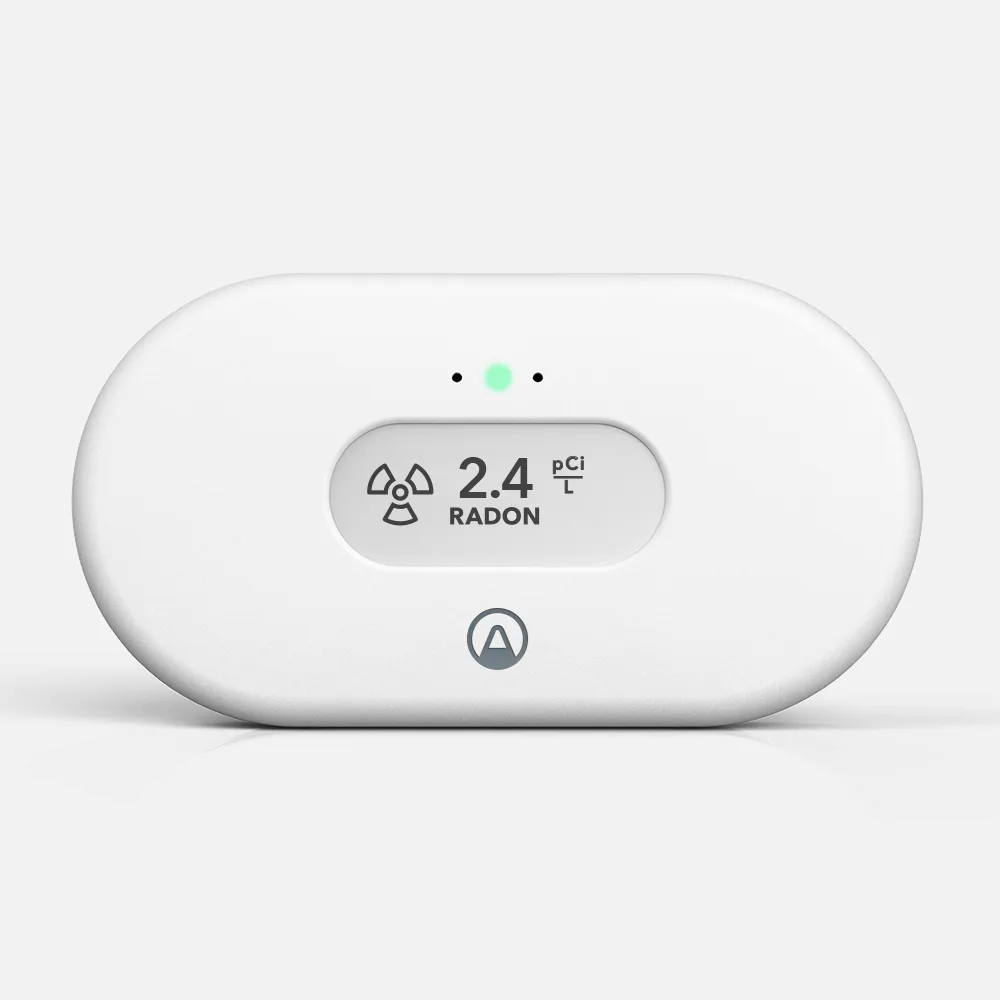
Monitor
Method: Alpha spectrometry
Readings: Every 60 minutes
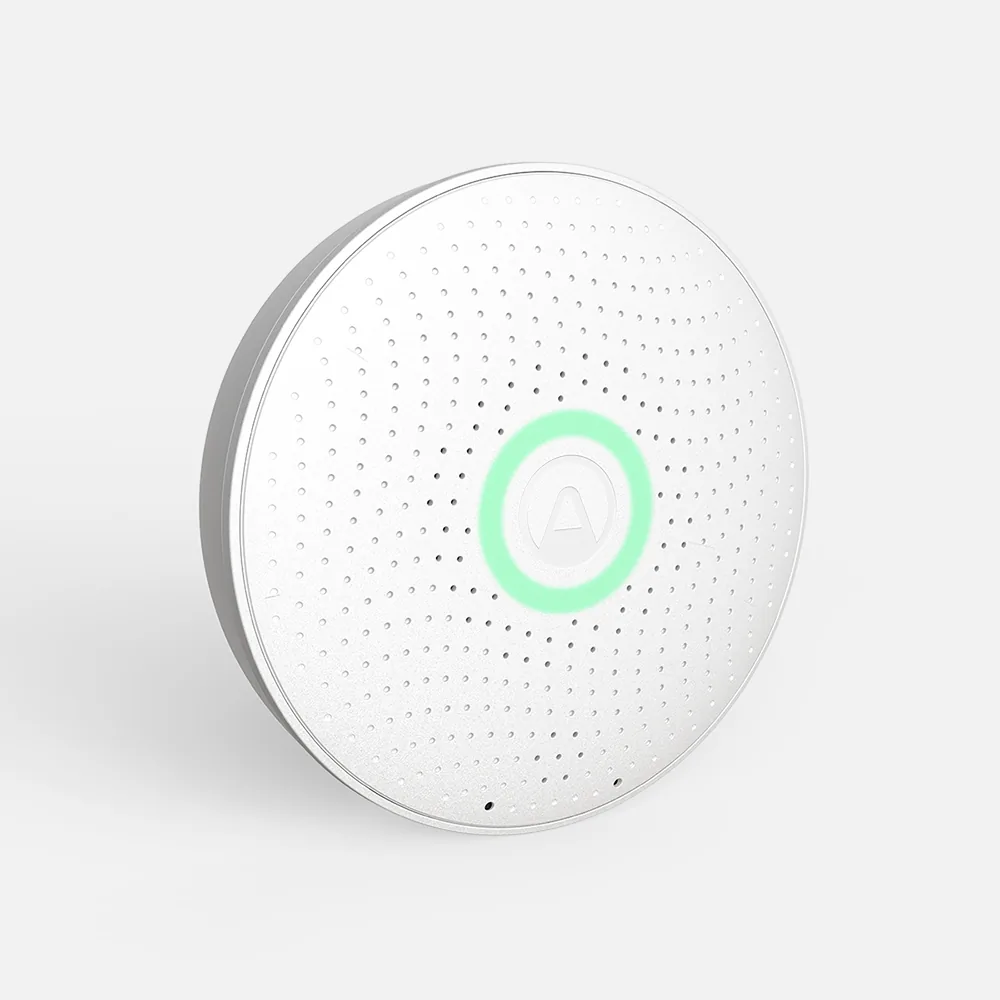
Monitor
Method: Alpha spectrometry
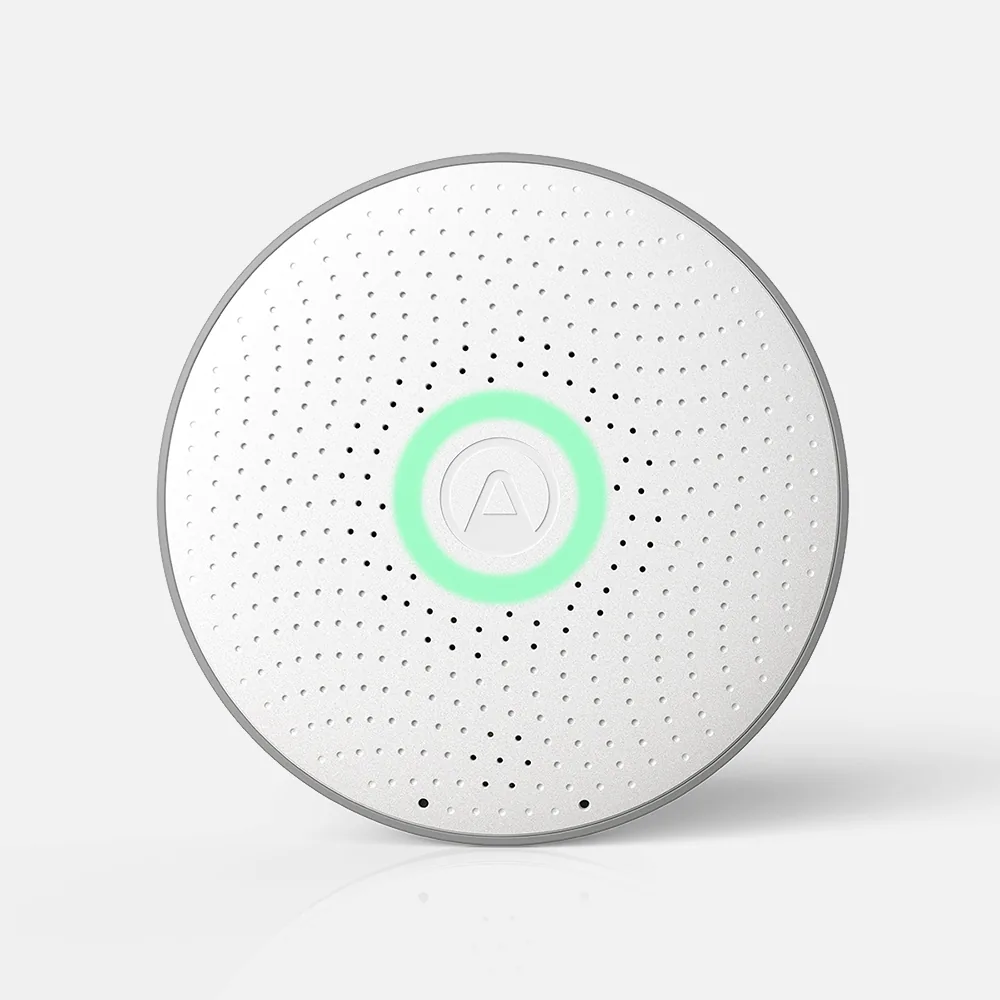
Monitor
Method: Alpha spectrometry
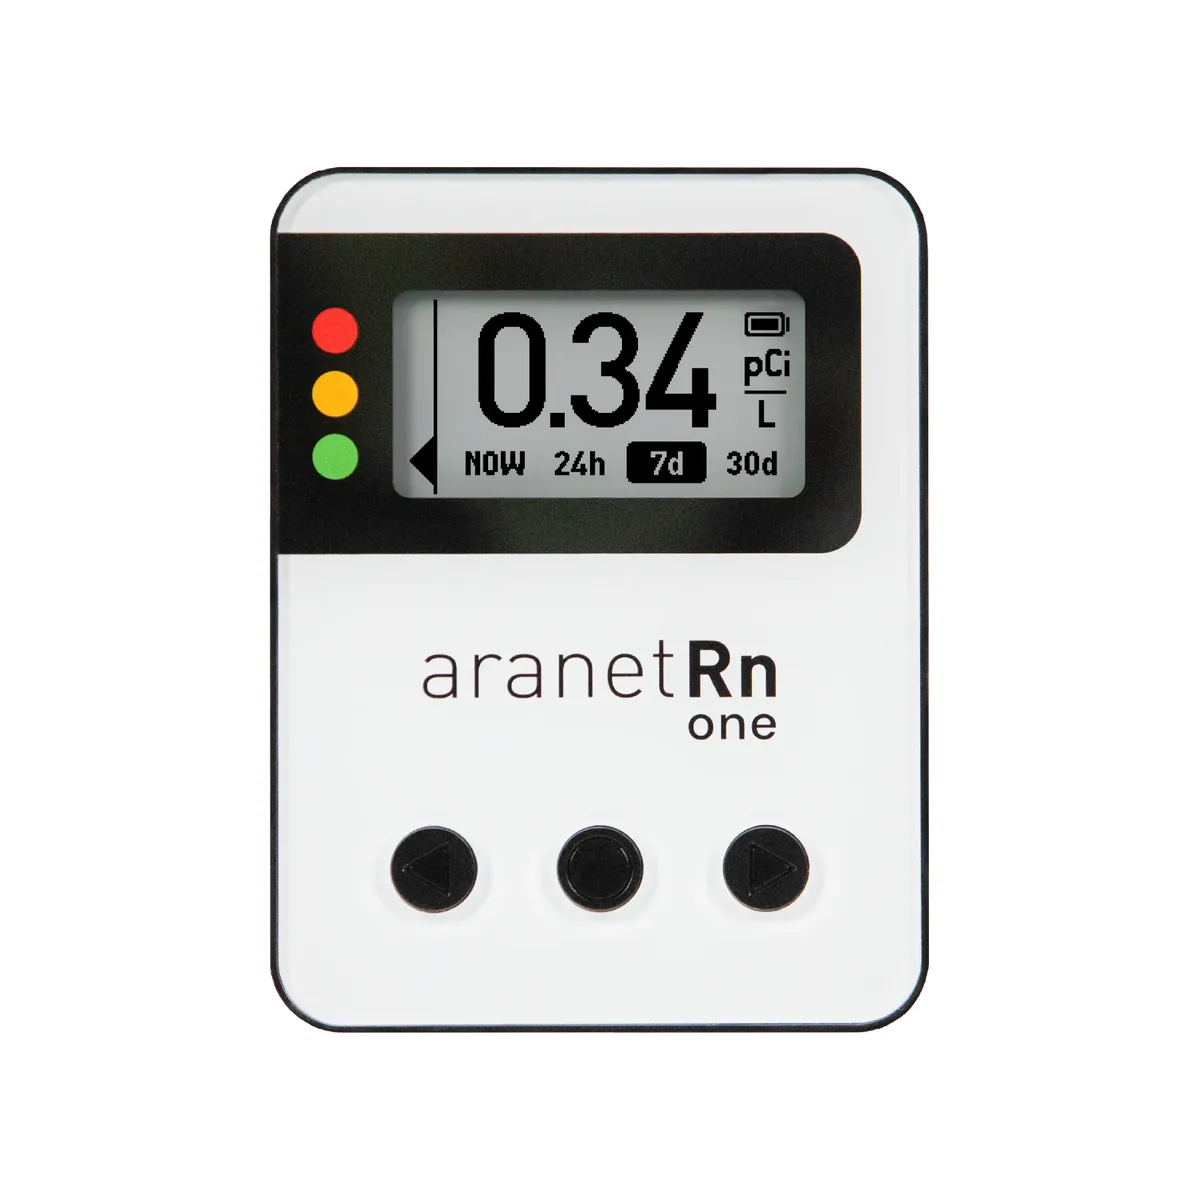
MonitorAranet
Method: Ion chamber
First reading: Within 10 minutes
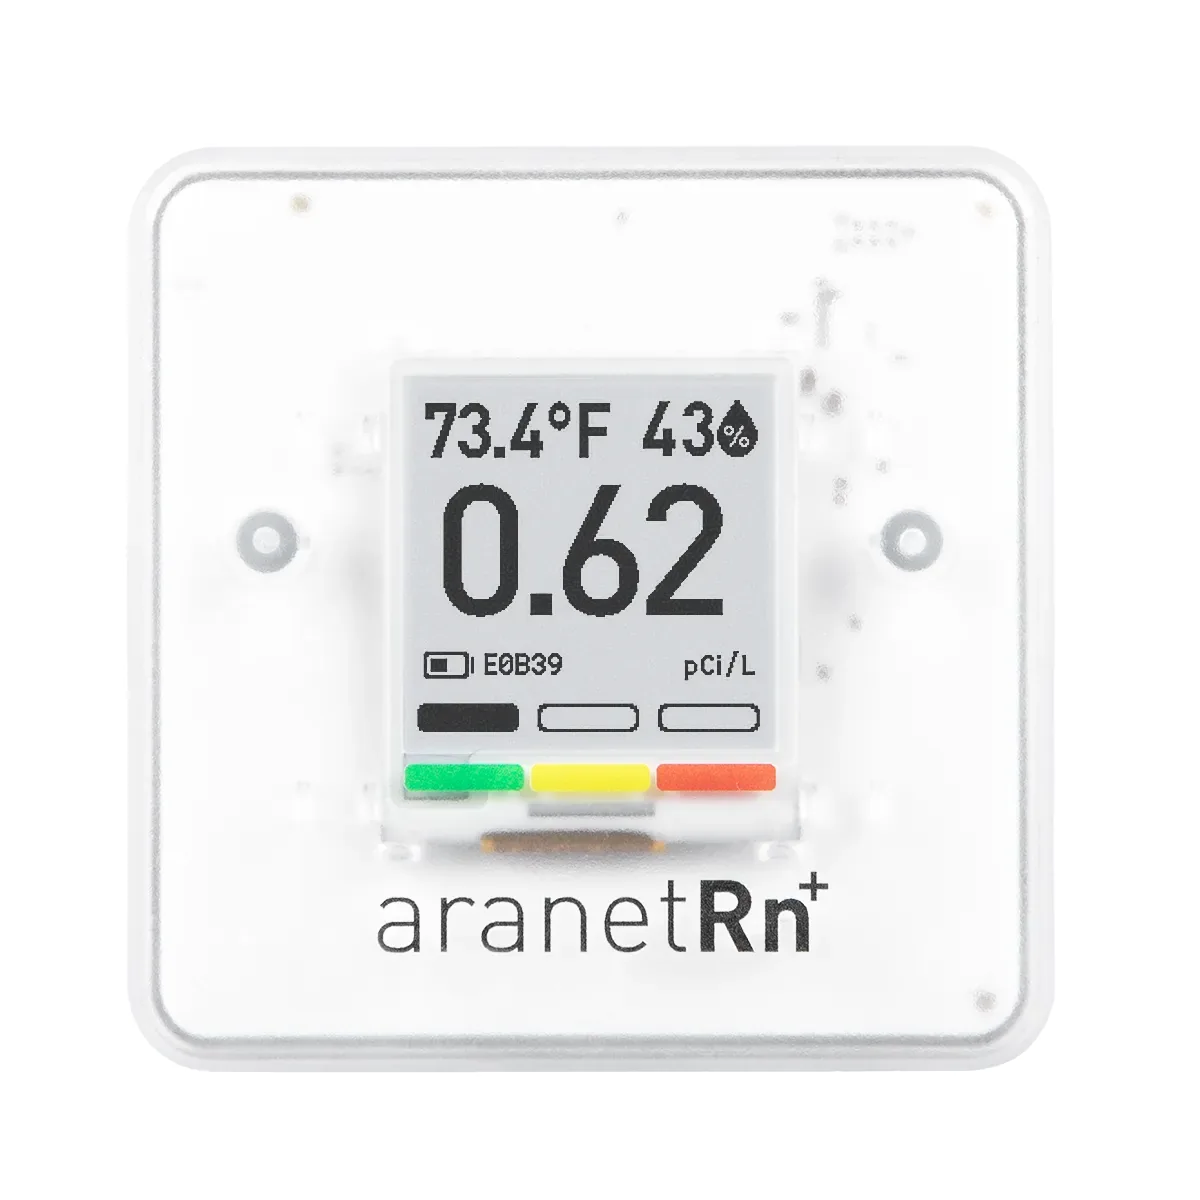
MonitorAranet
Method: Ion chamber
First reading: Within 10 minutes
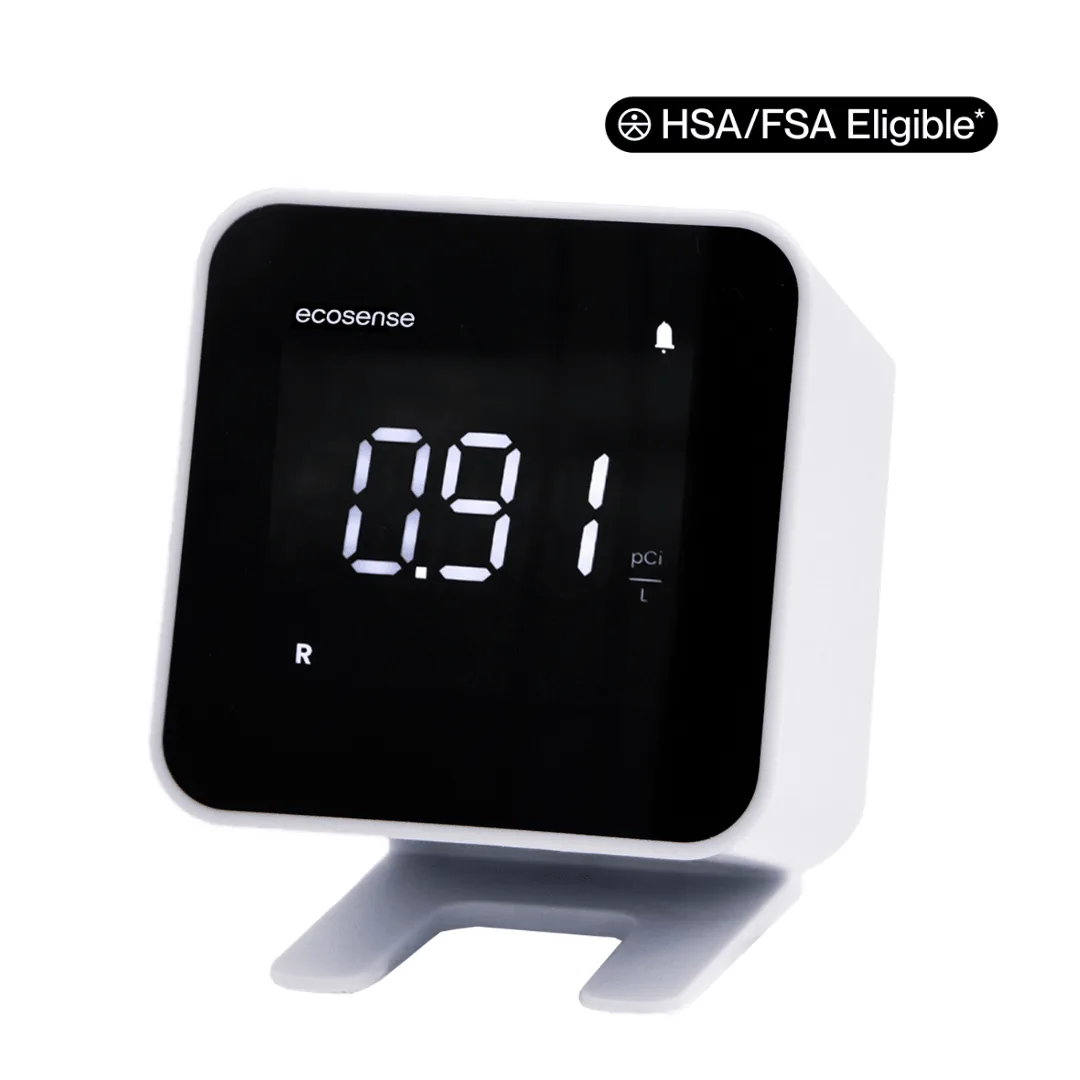
Monitor
Method: Ion chamber
First reading: Within 10 minutes
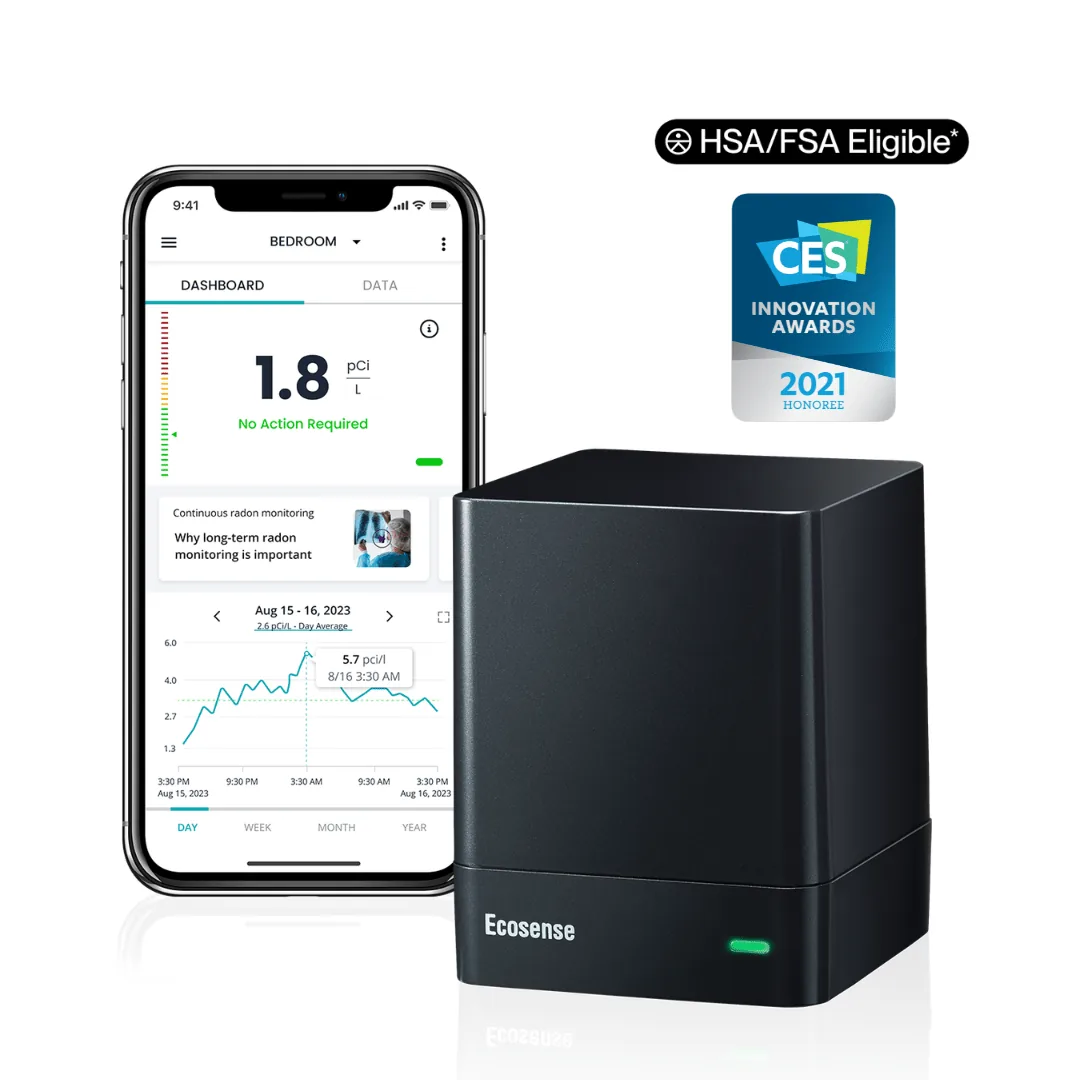
Monitor
Method: Ion chamber
First reading: Within 10 minutes
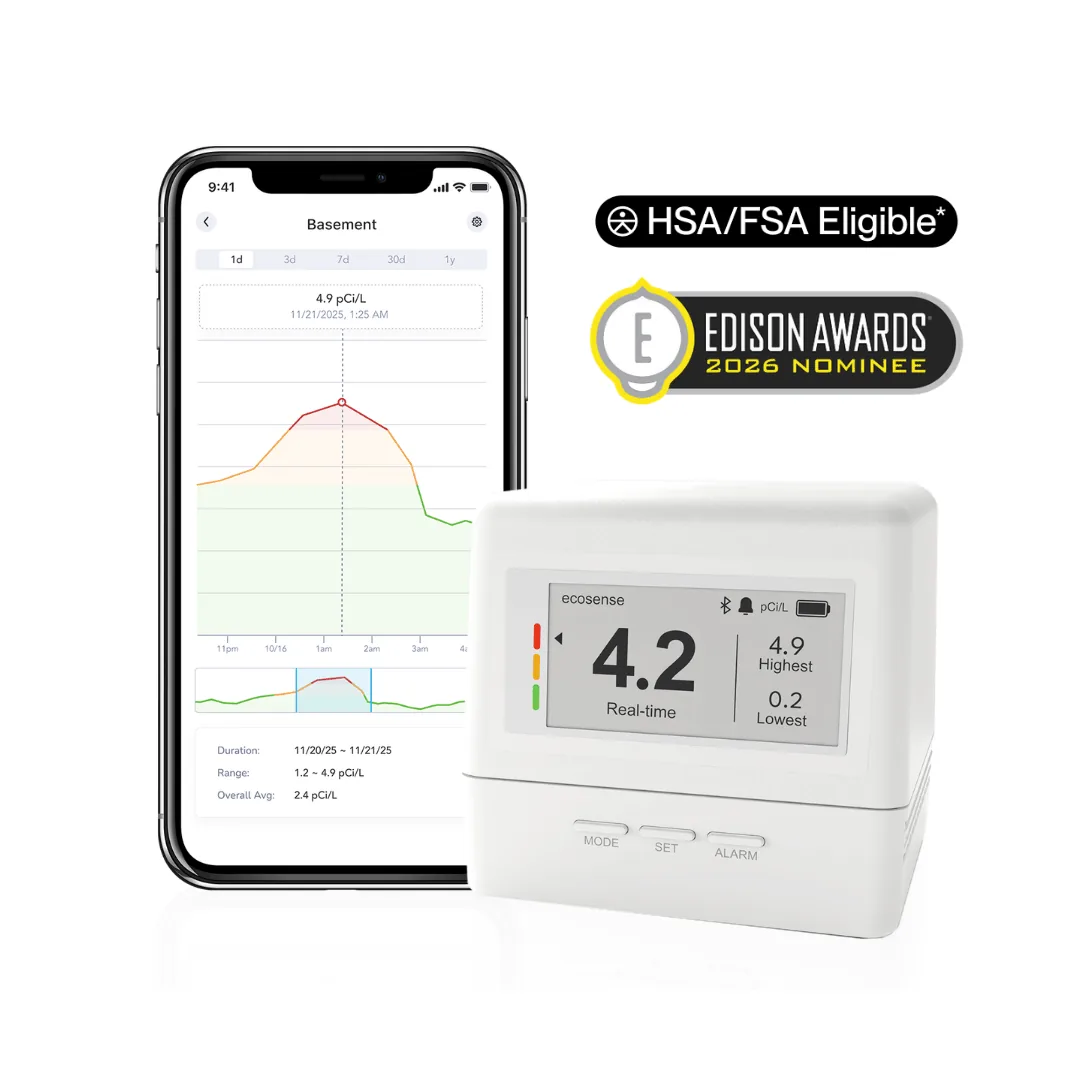
Monitor
Method: Ion chamber
First reading: Within 15 minutes
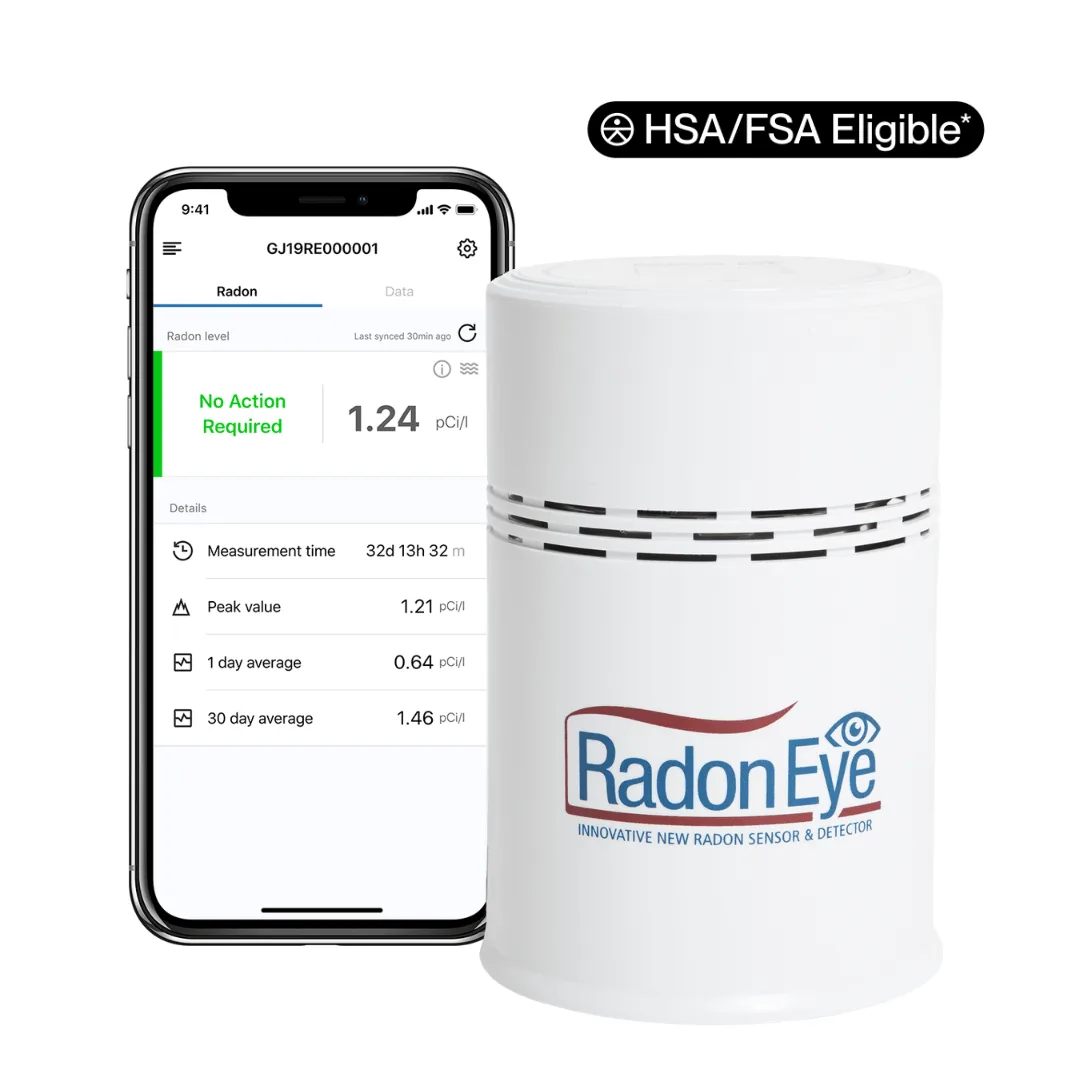
Monitor
Method: Ion chamber
First reading: Within 10 minutes
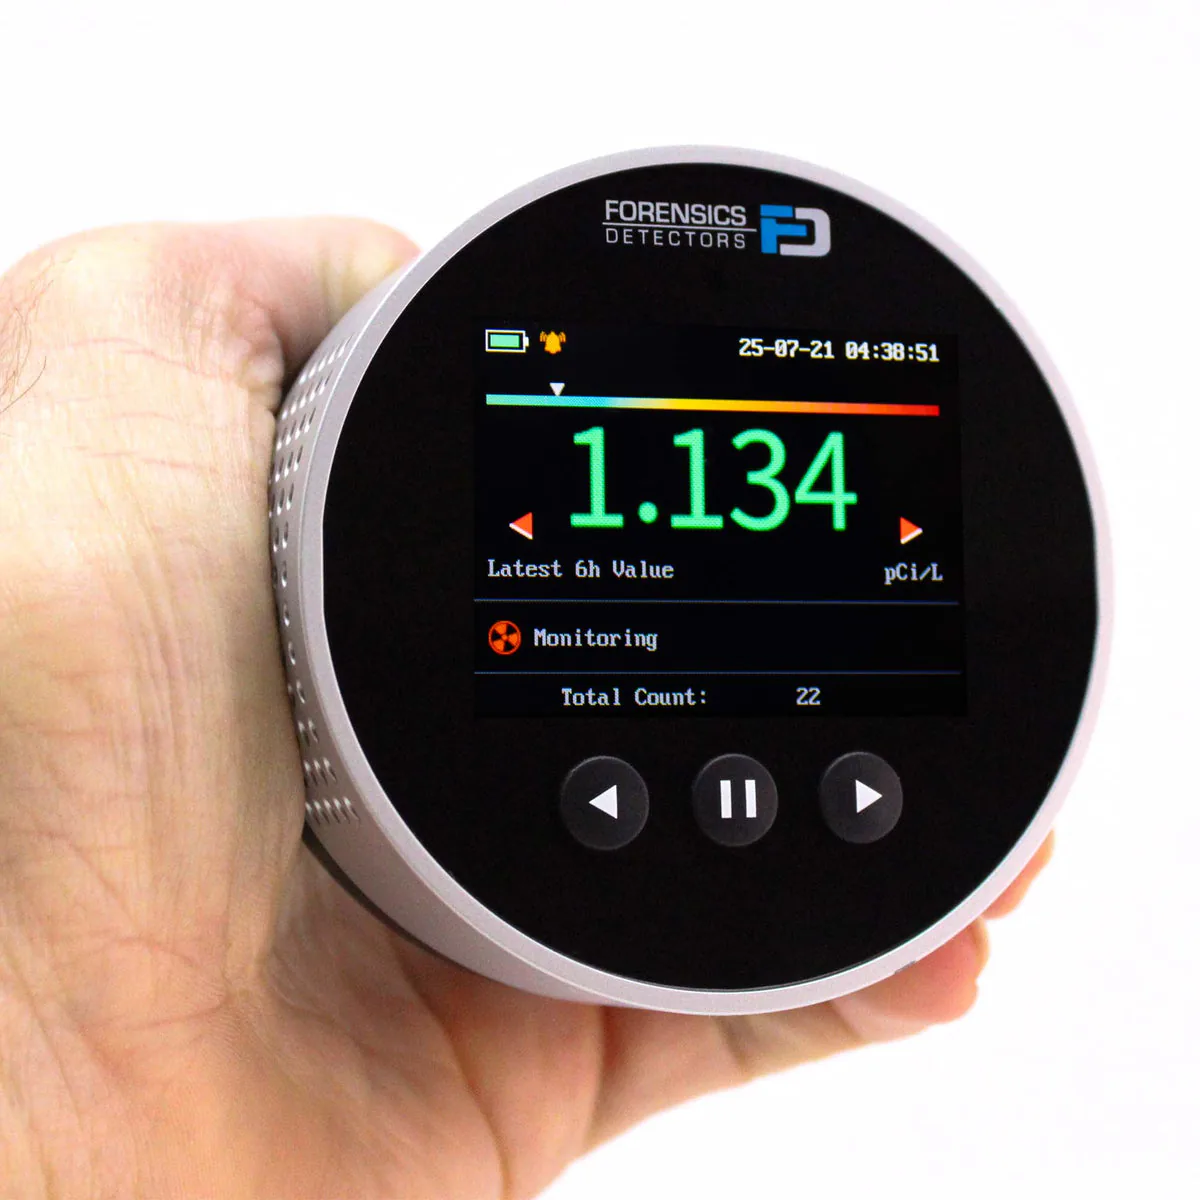
MonitorForensics Detectors
Method: Semiconductor sensor
First reading: Within 6 hours
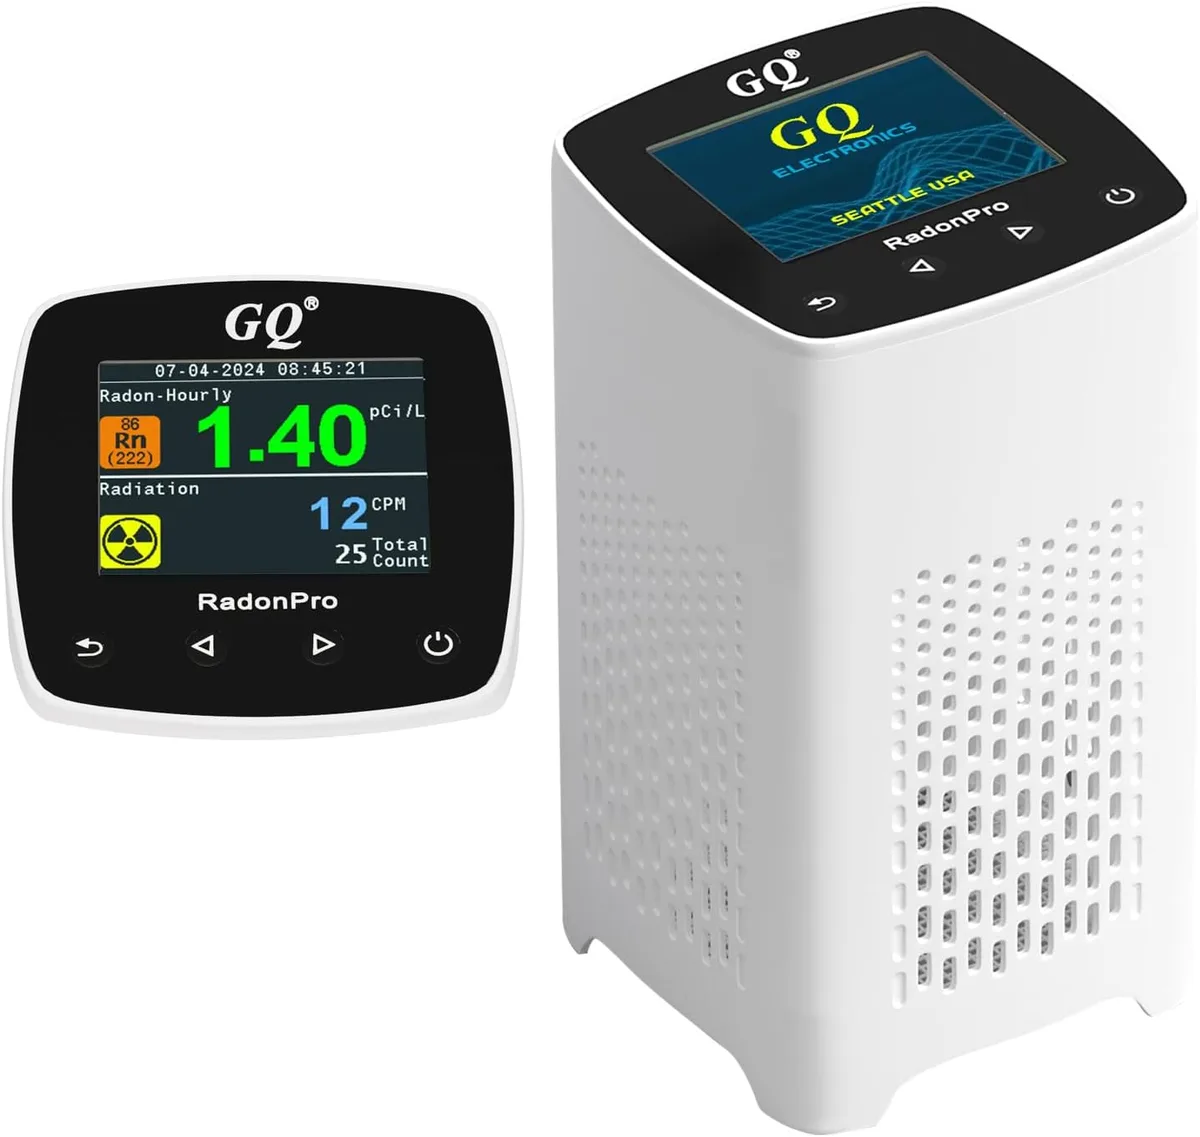
Monitor
First reading: Within 5 minutes
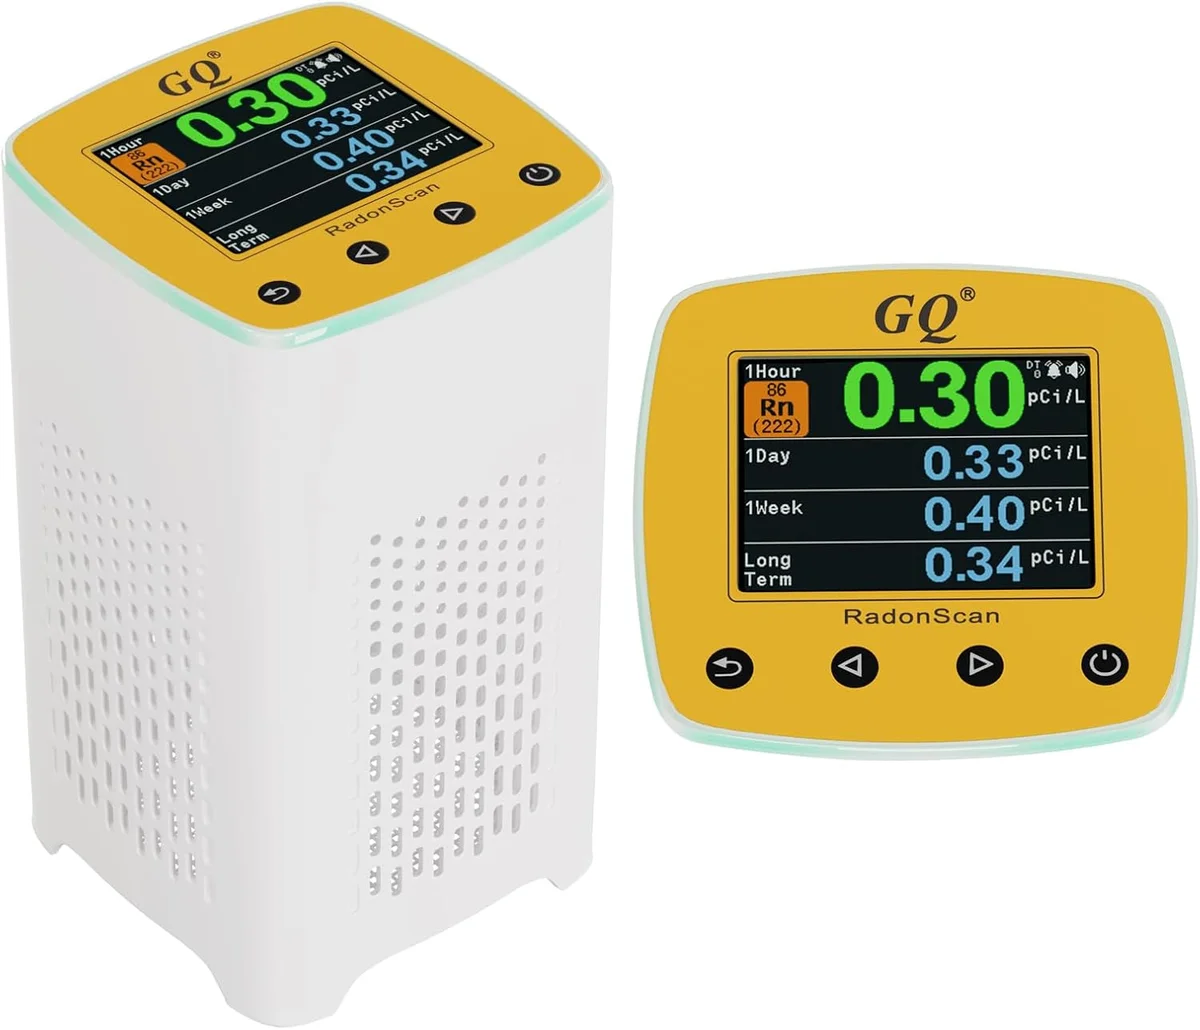
Monitor
First reading: Within 5 minutes
Monitor
First reading: Within 5 minutes
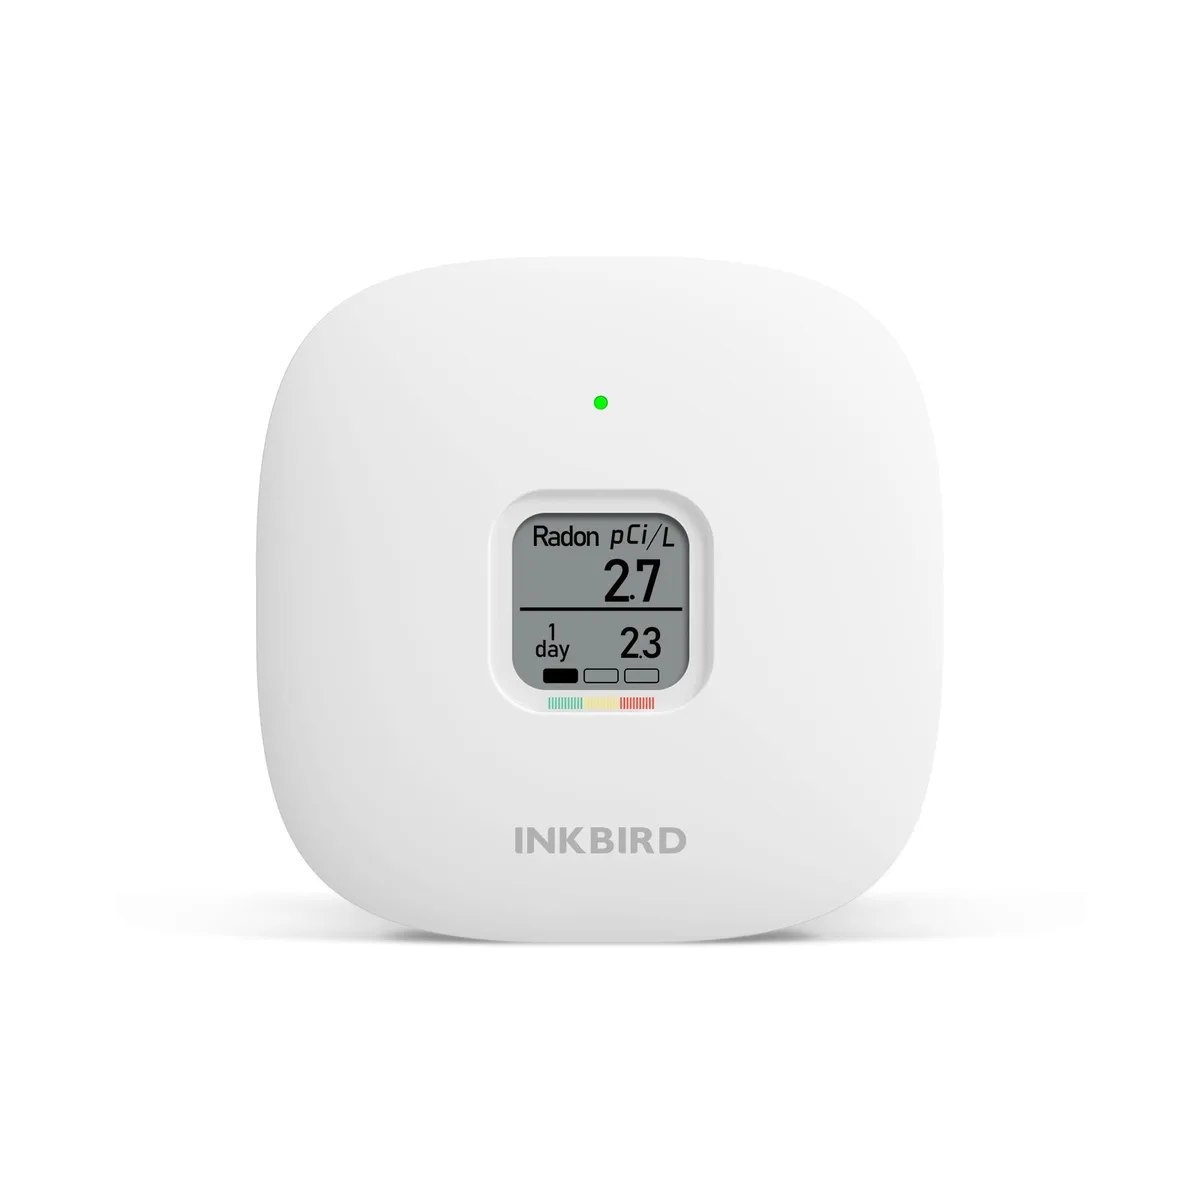
MonitorINKBIRD
First reading: Within 24 hours
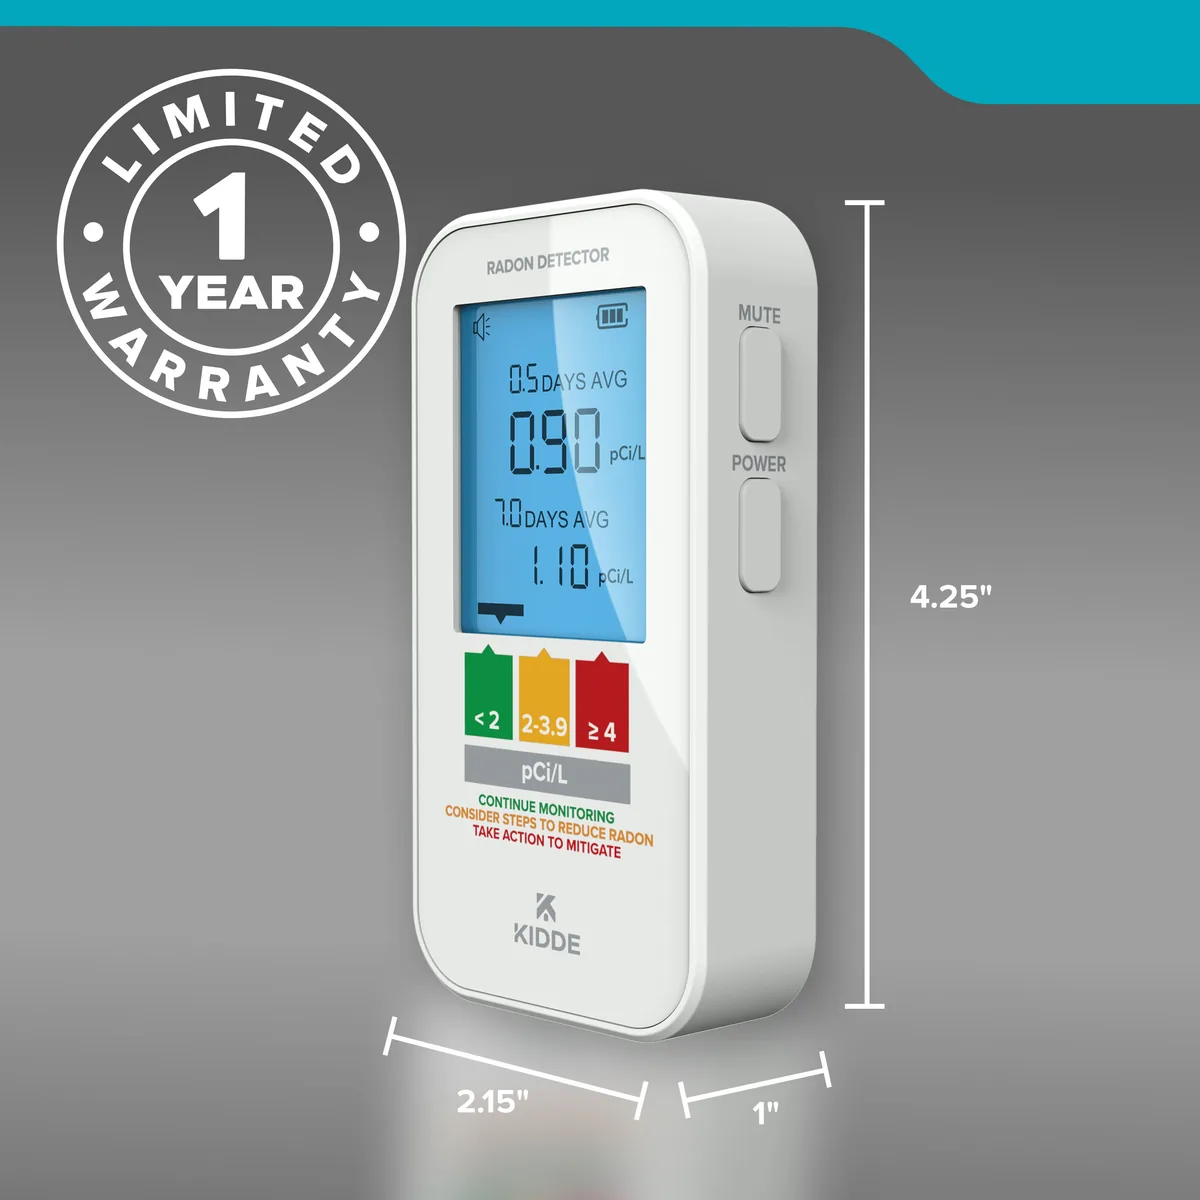
MonitorKidde
Method: Semiconductor sensor
First reading: Within 12 hours
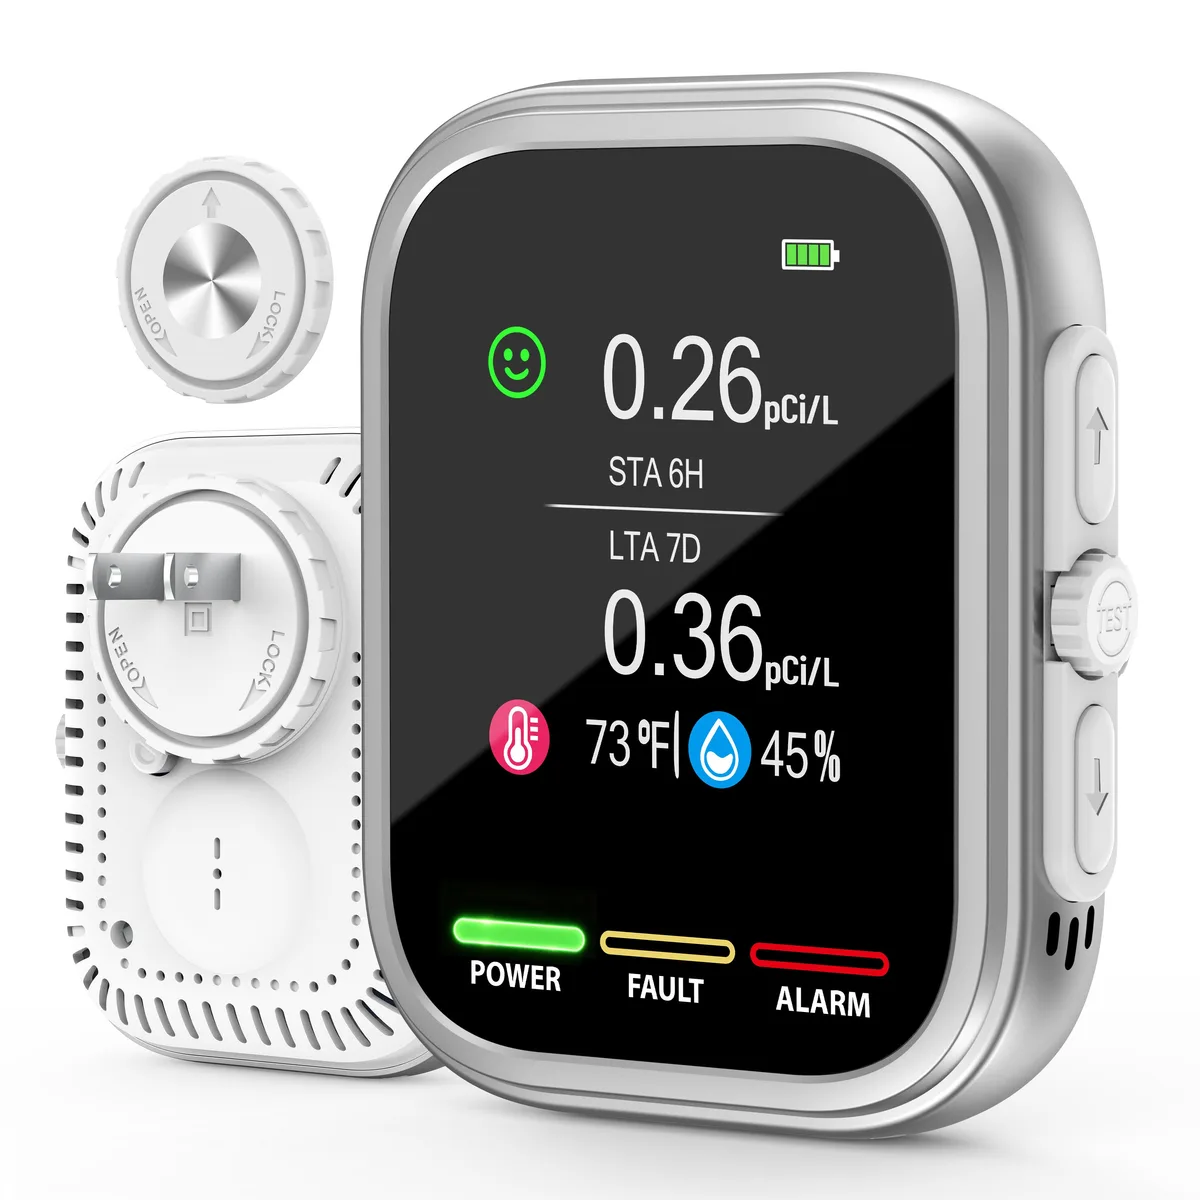
MonitorPYZYCKYH
Method: Semiconductor sensor
First reading: Within 6 hours
MonitorSafetySiren
First reading: Within 48 hours
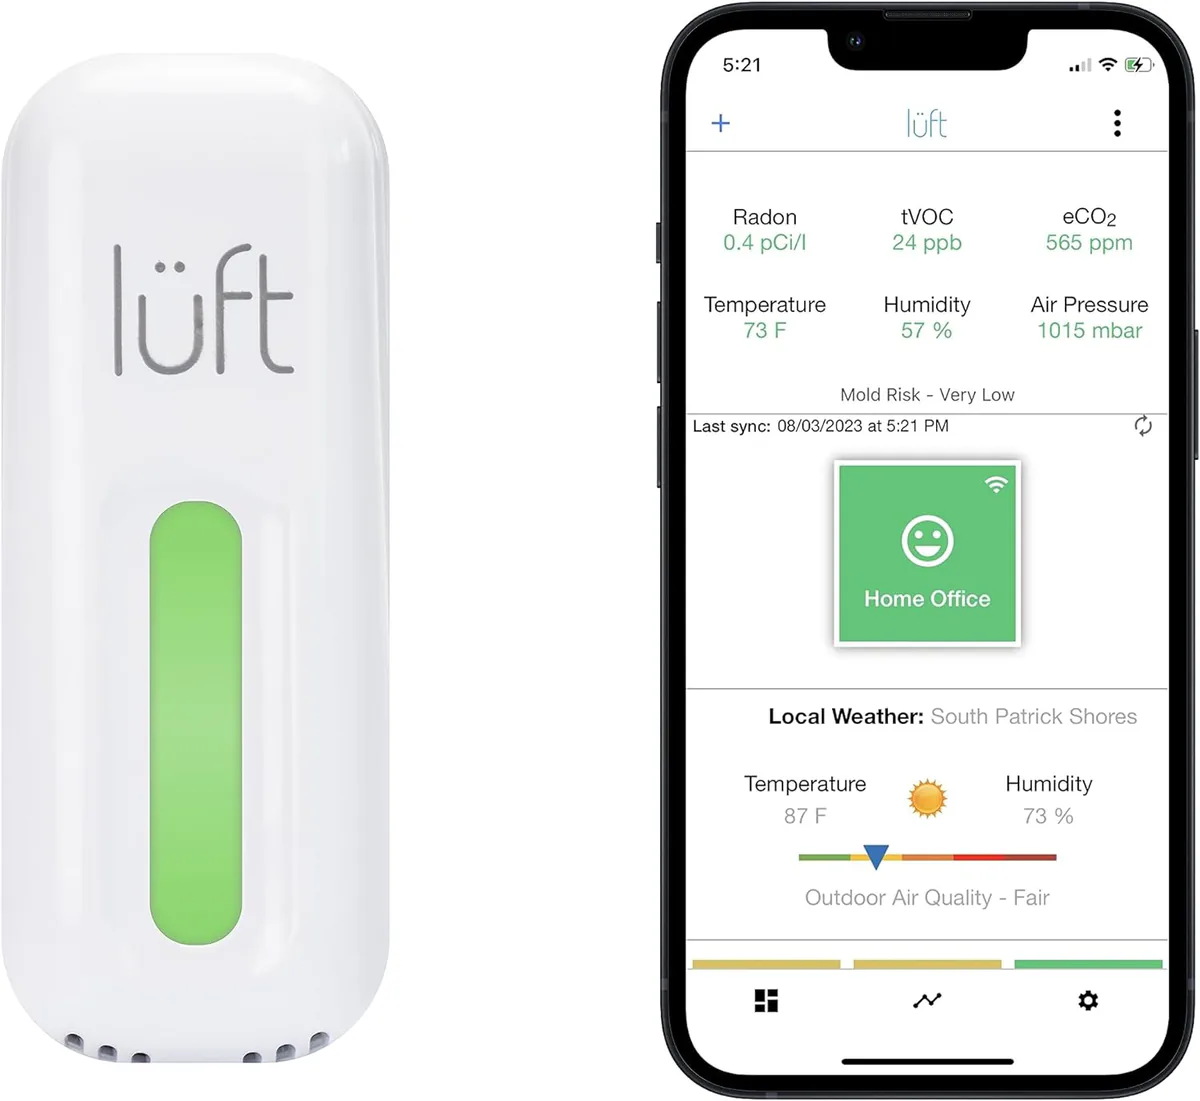
Monitor
First reading: Within 90 minutes
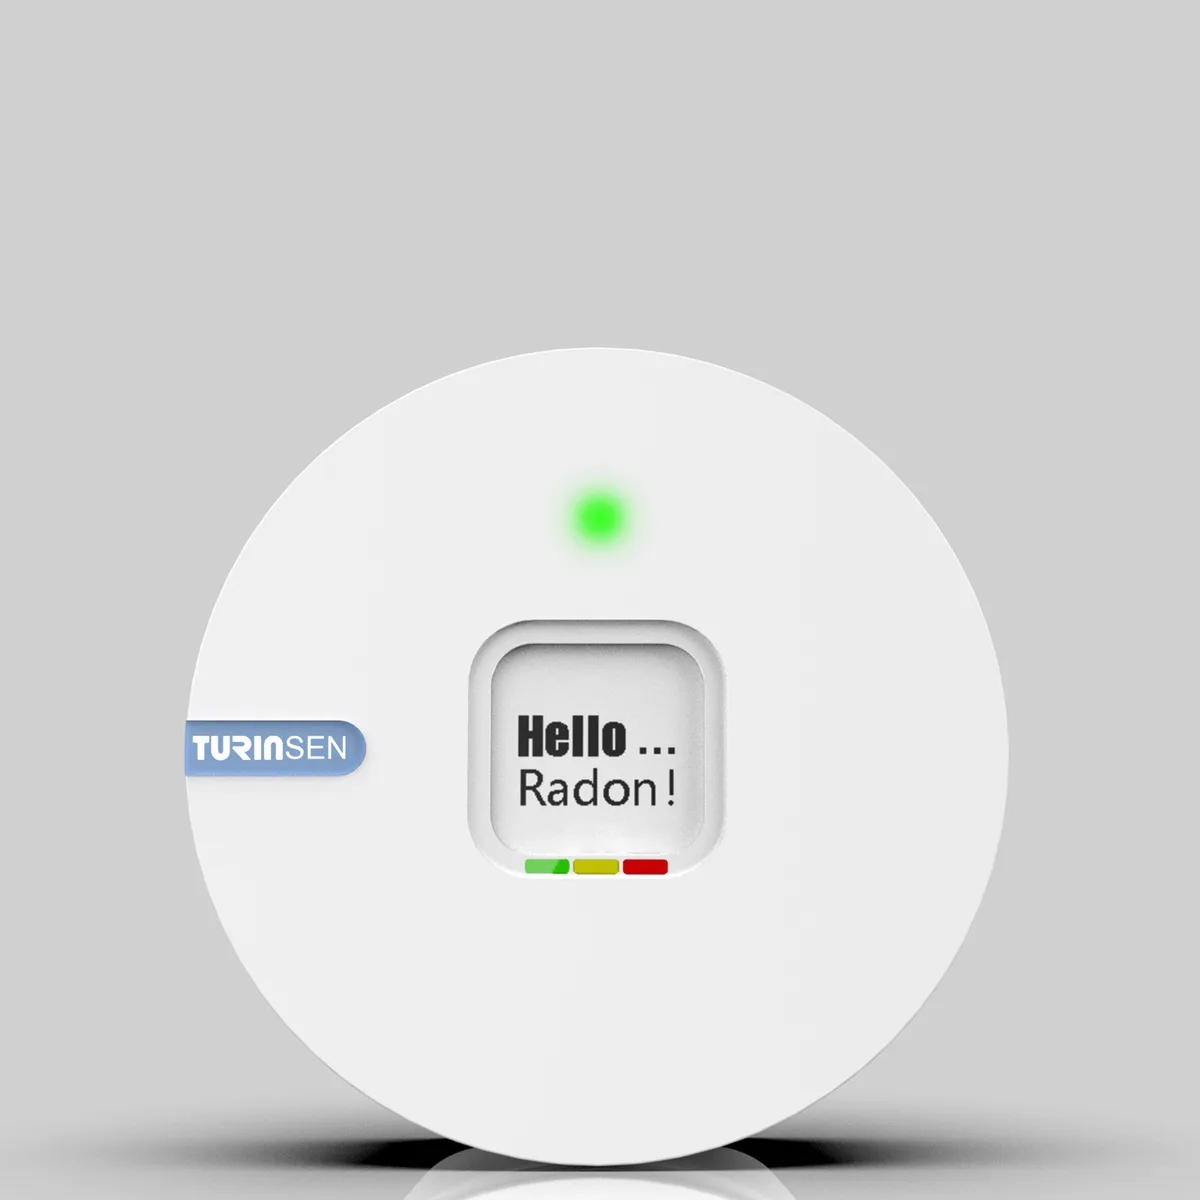
Monitor
Method: Alpha spectrometry
First reading: Within 24 hours
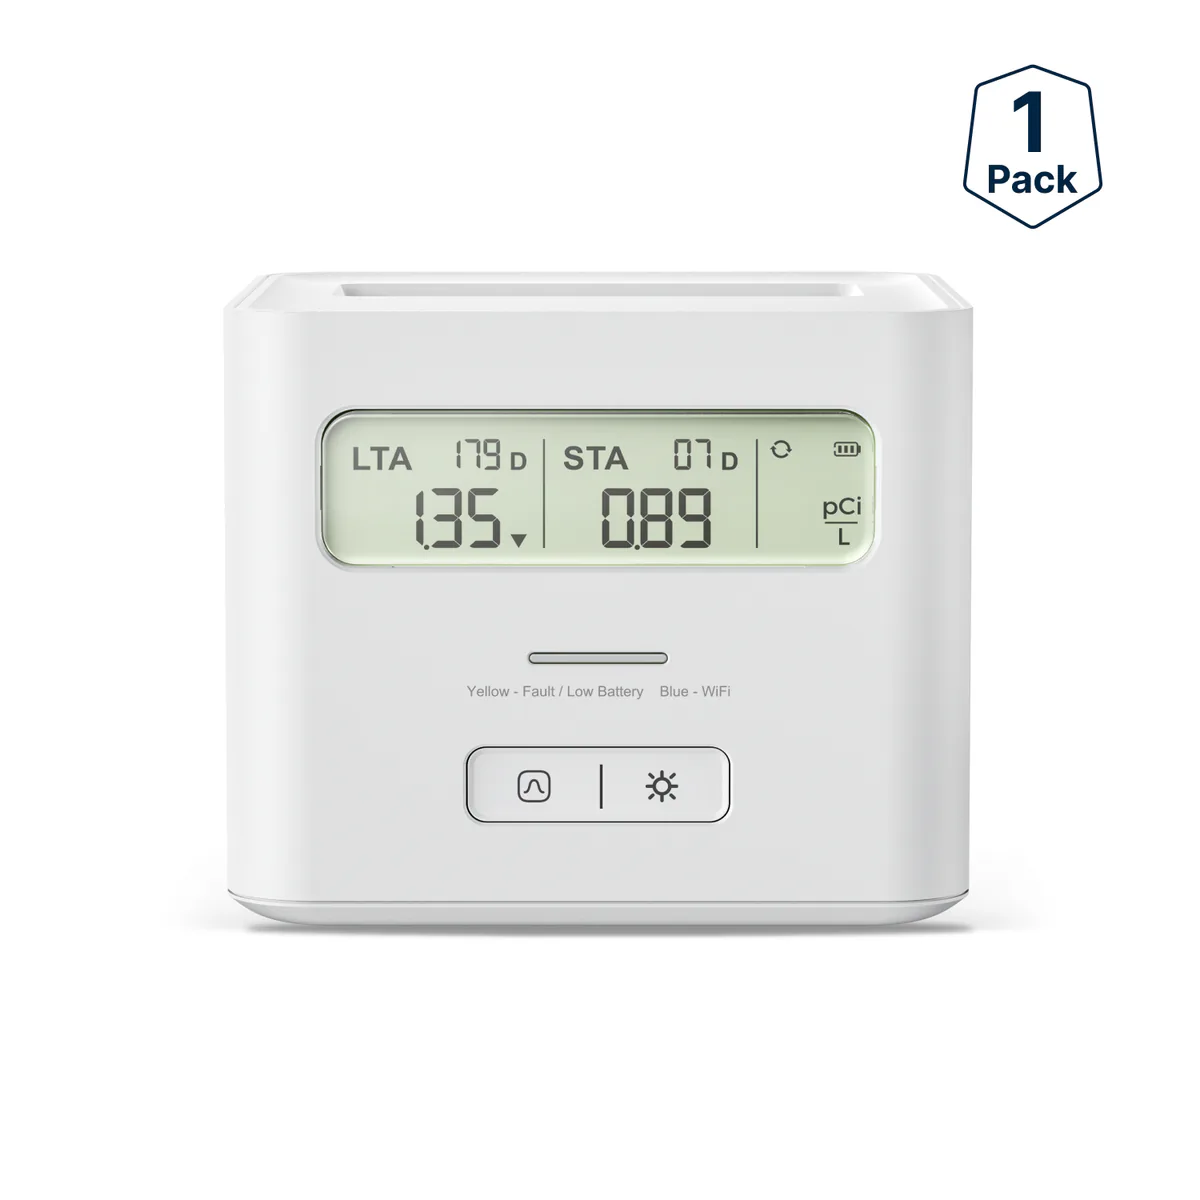
MonitorX-Sense
Method: Alpha spectrometry
First reading: Within 24 hours
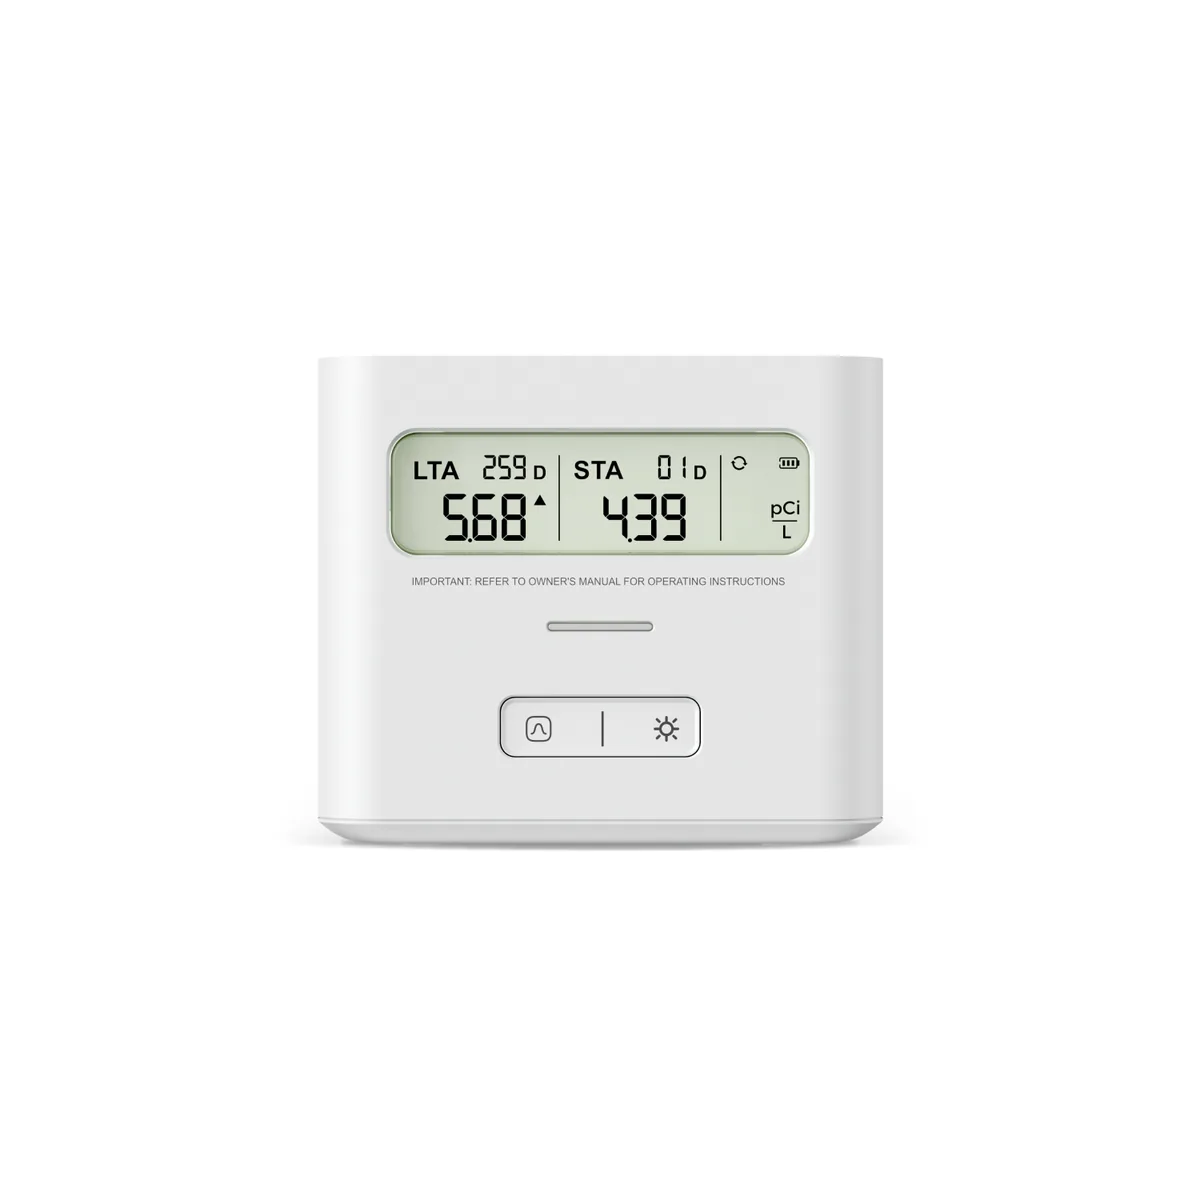
MonitorX-Sense
Method: Alpha spectrometry
First reading: Within 24 hours
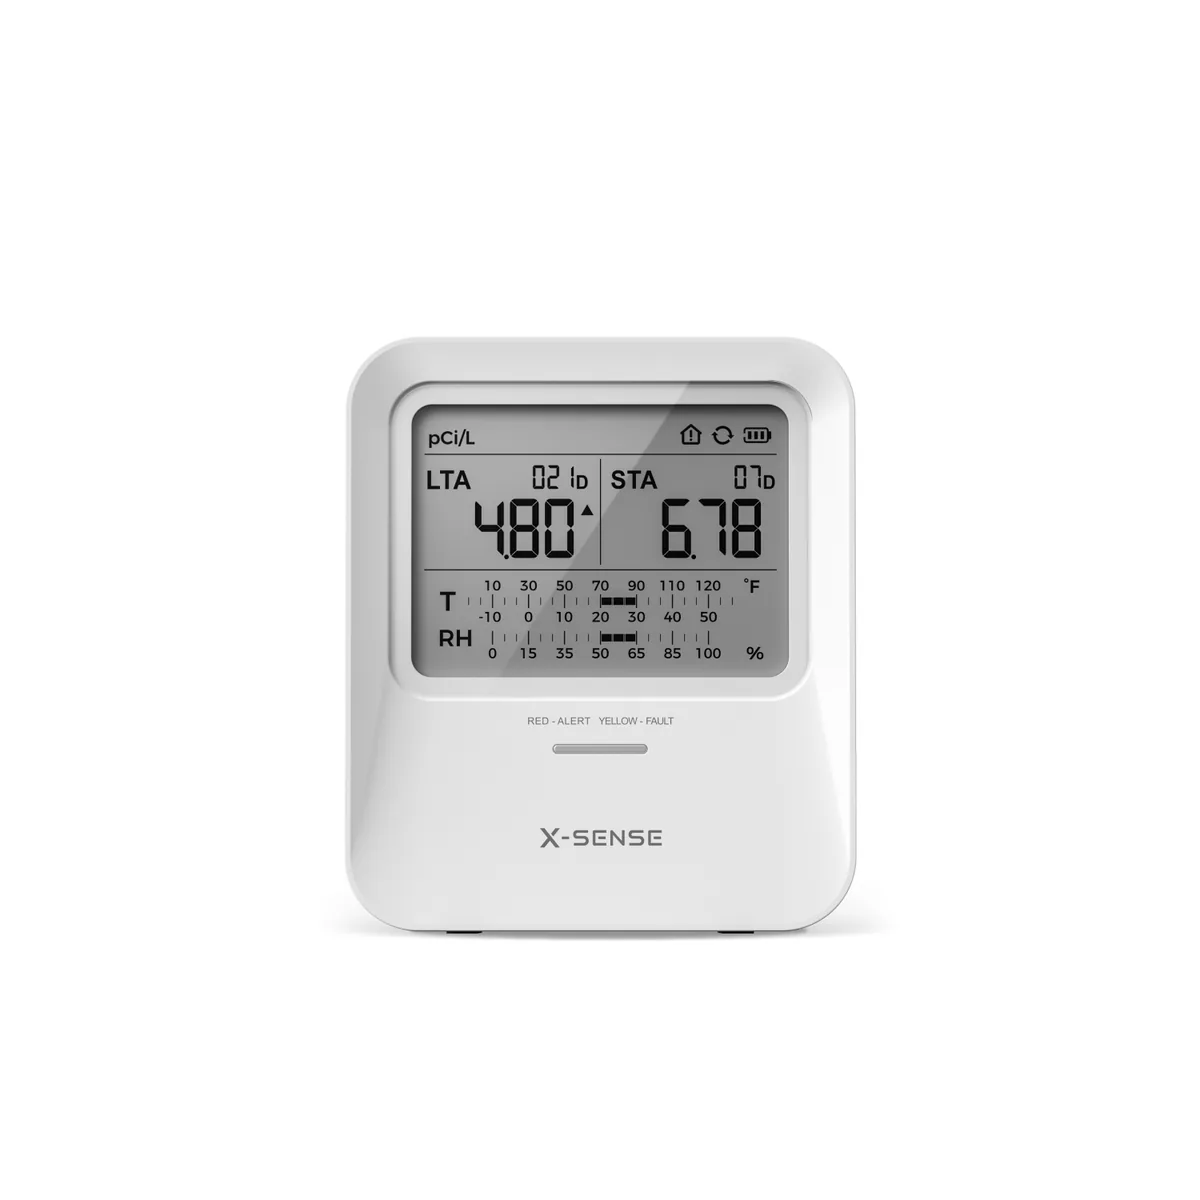
MonitorX-Sense
Method: Alpha spectrometry
First reading: Within 24 hours

Long-term kit
Method: Alpha track
In home: 90 days to 12 months

Long-term kit
Method: Alpha track
In home: 90 days to 12 months
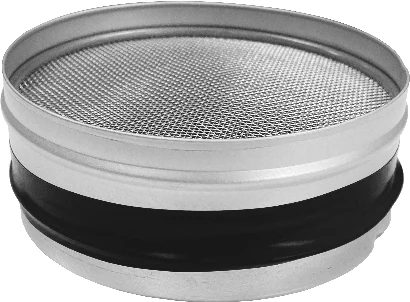
Short-term kit
Method: Charcoal
In home: 48 to 96 hours
No Amazon listing on file
See details of the AccuStar PicoCan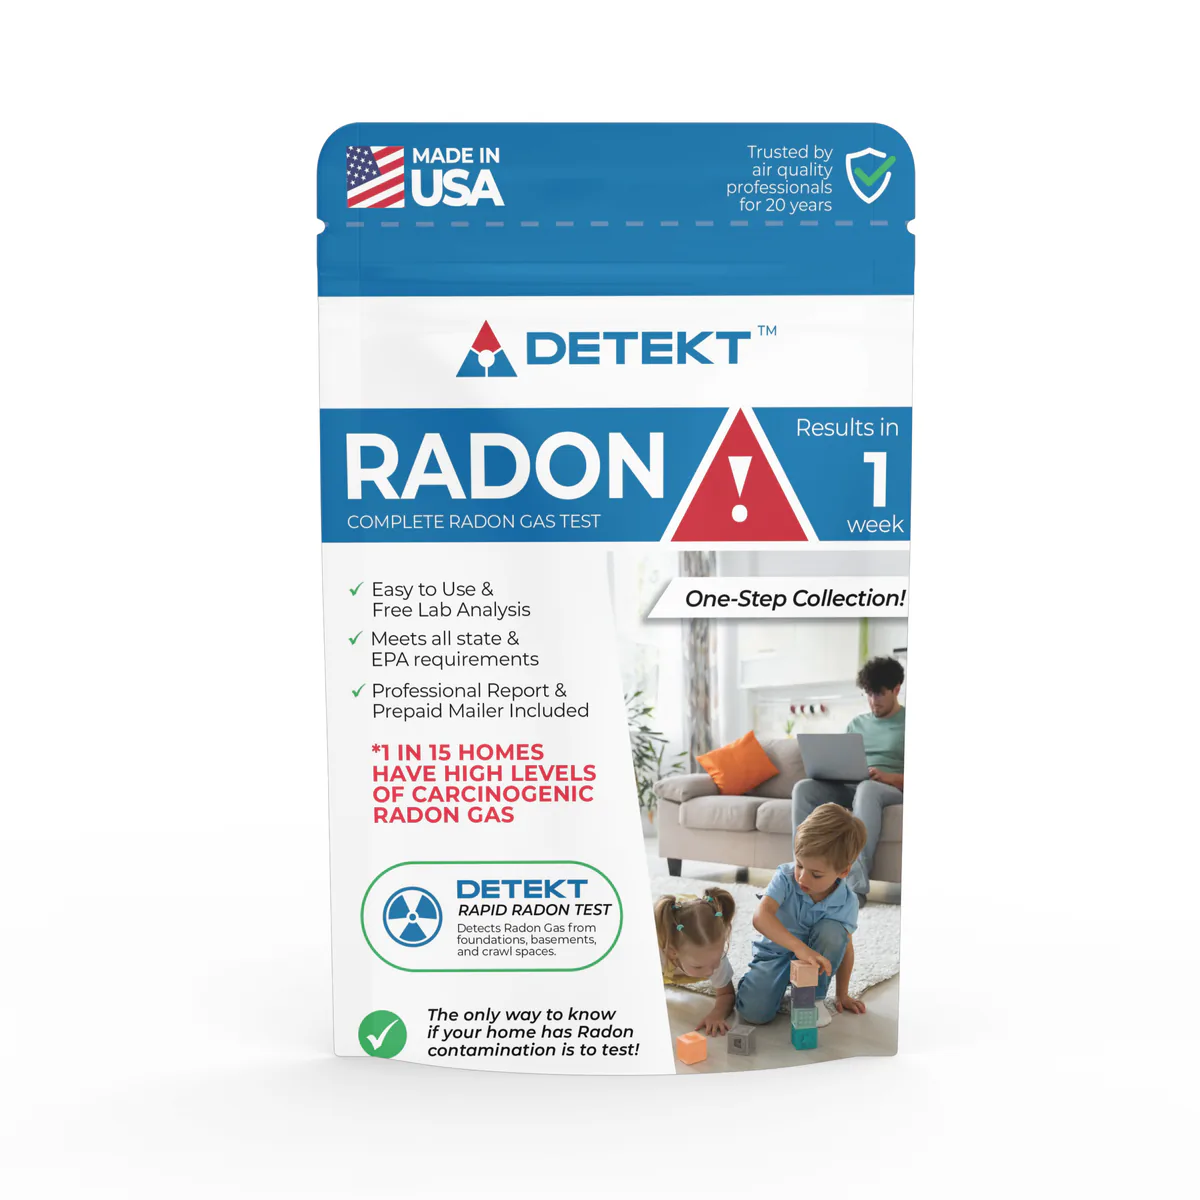
Short-term kit
Method: Charcoal
In home: 2 to 7 days
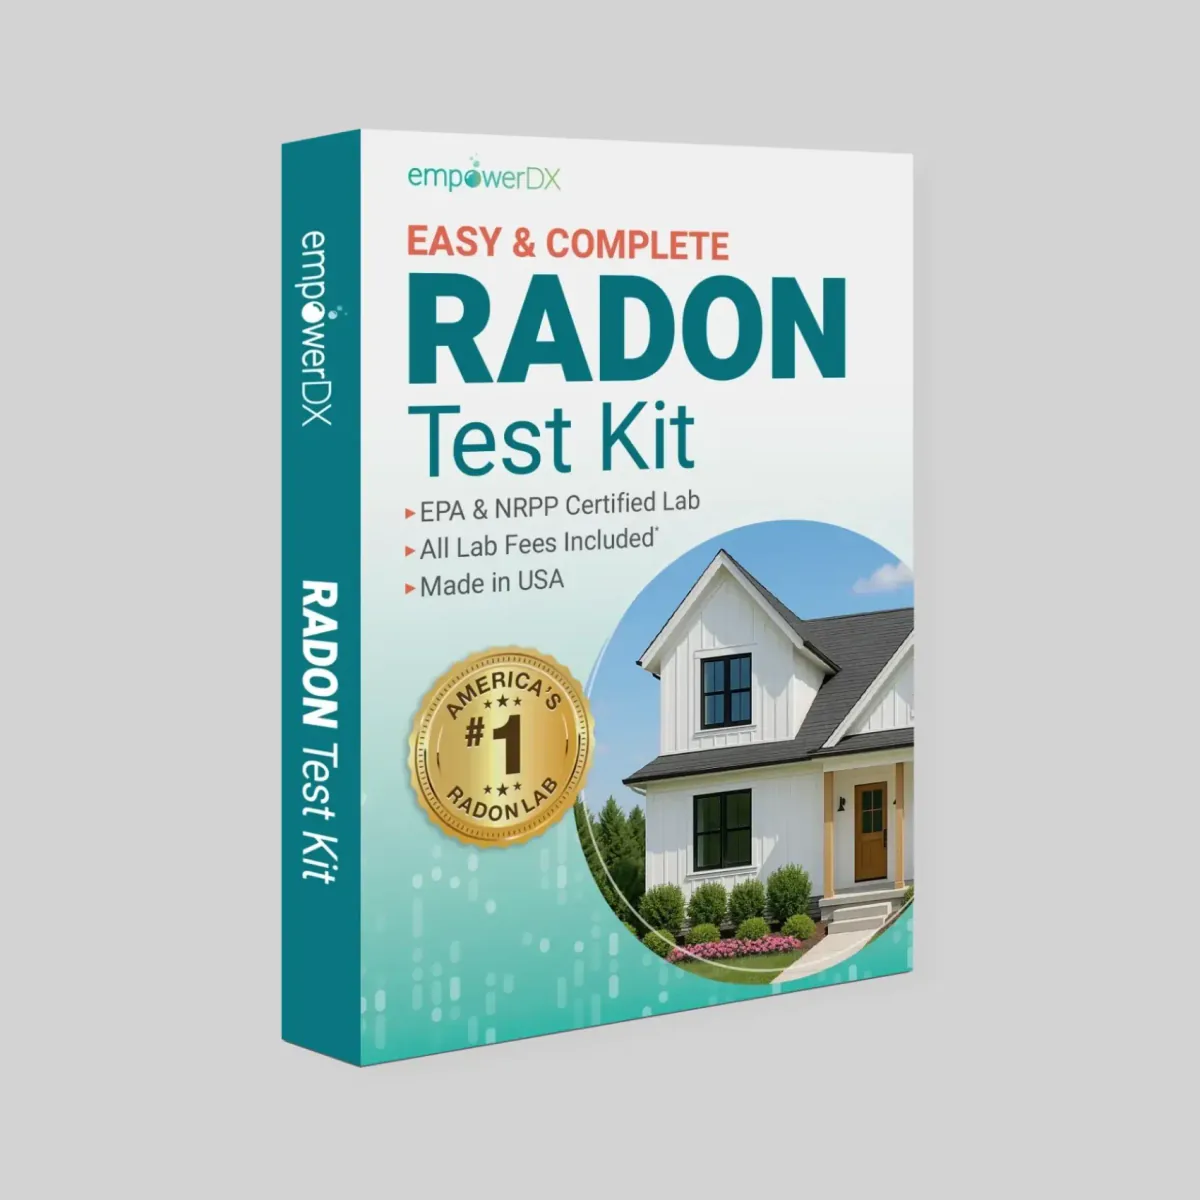
Short-term kitempowerDX
Method: Passive sampler
In home: 48 to 96 hours
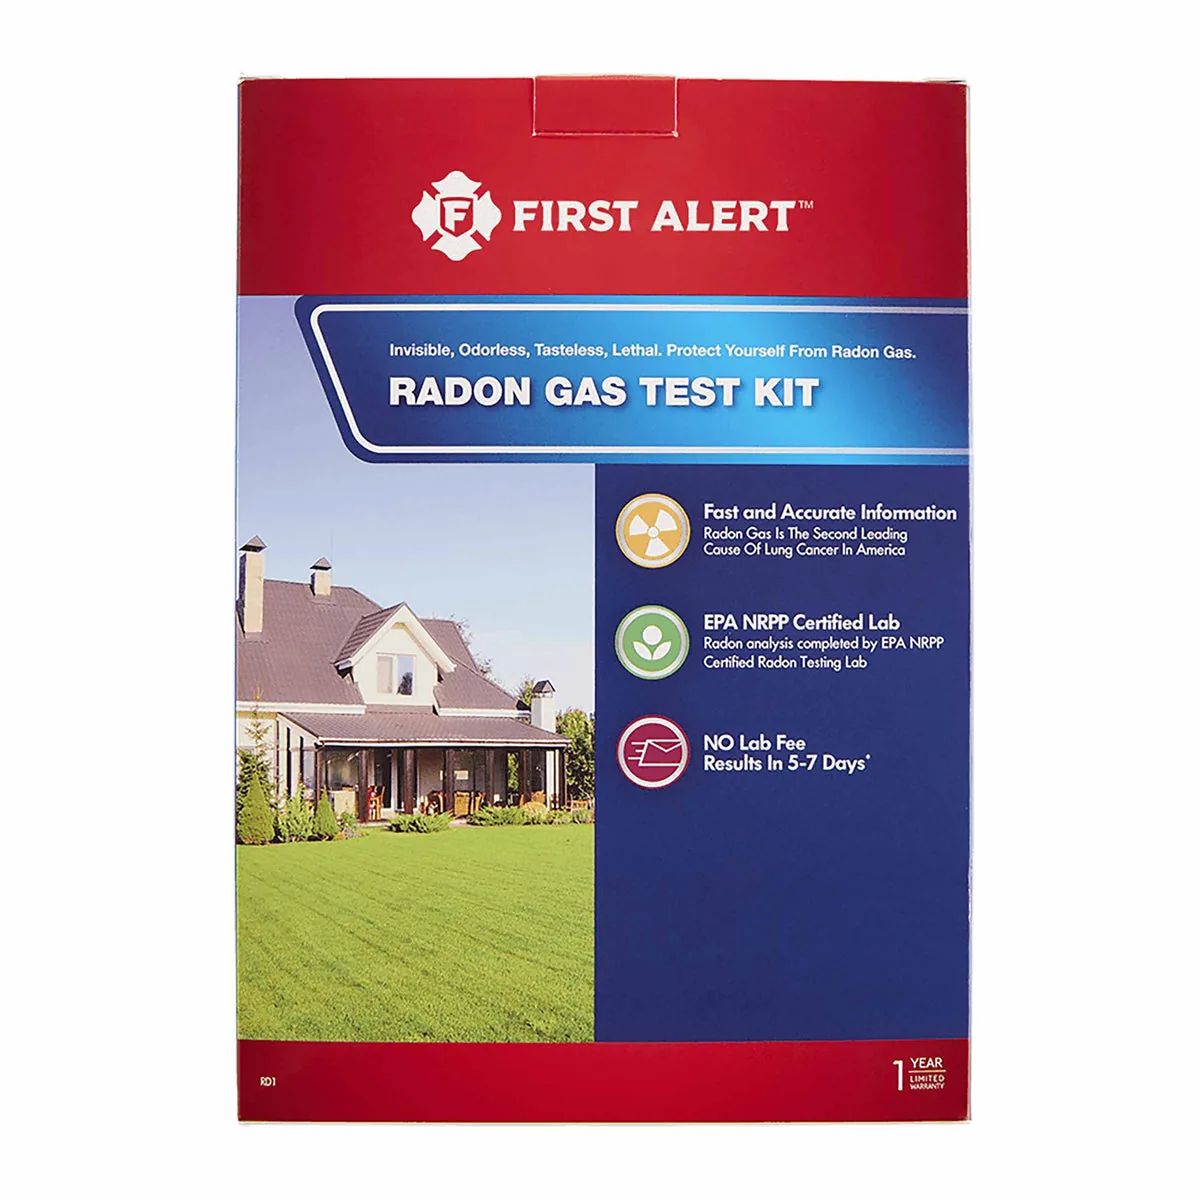
Short-term kitFirst Alert
Method: Charcoal
In home: 2 to 4 days
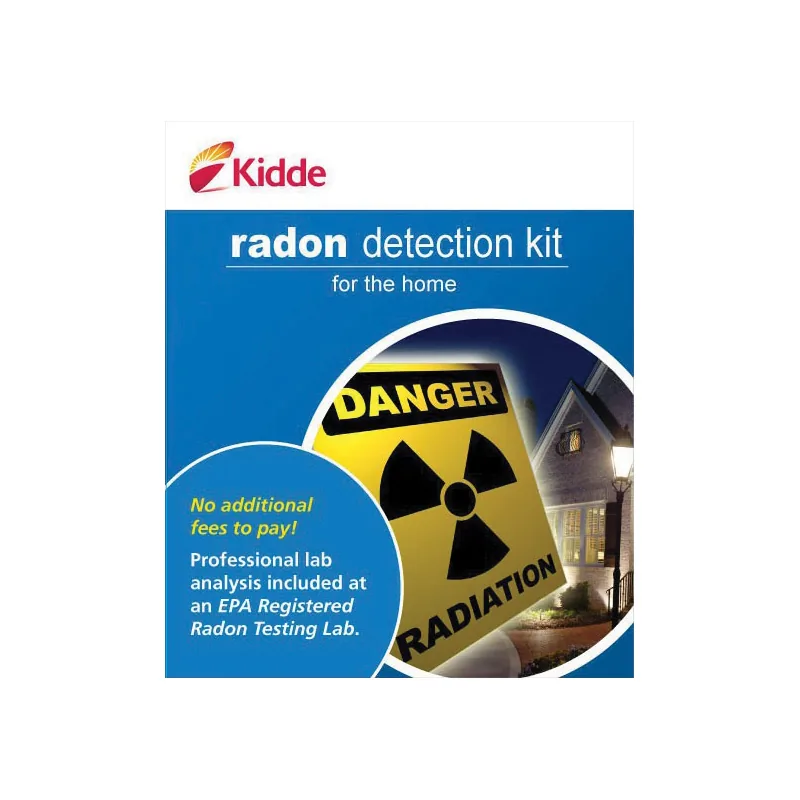
Short-term kitKidde
Method: Charcoal
In home: 3 days
No Amazon listing on file
See details of the Kidde 442020
Short-term kit
Method: Liquid scintillation
In home: 48 to 96 hours
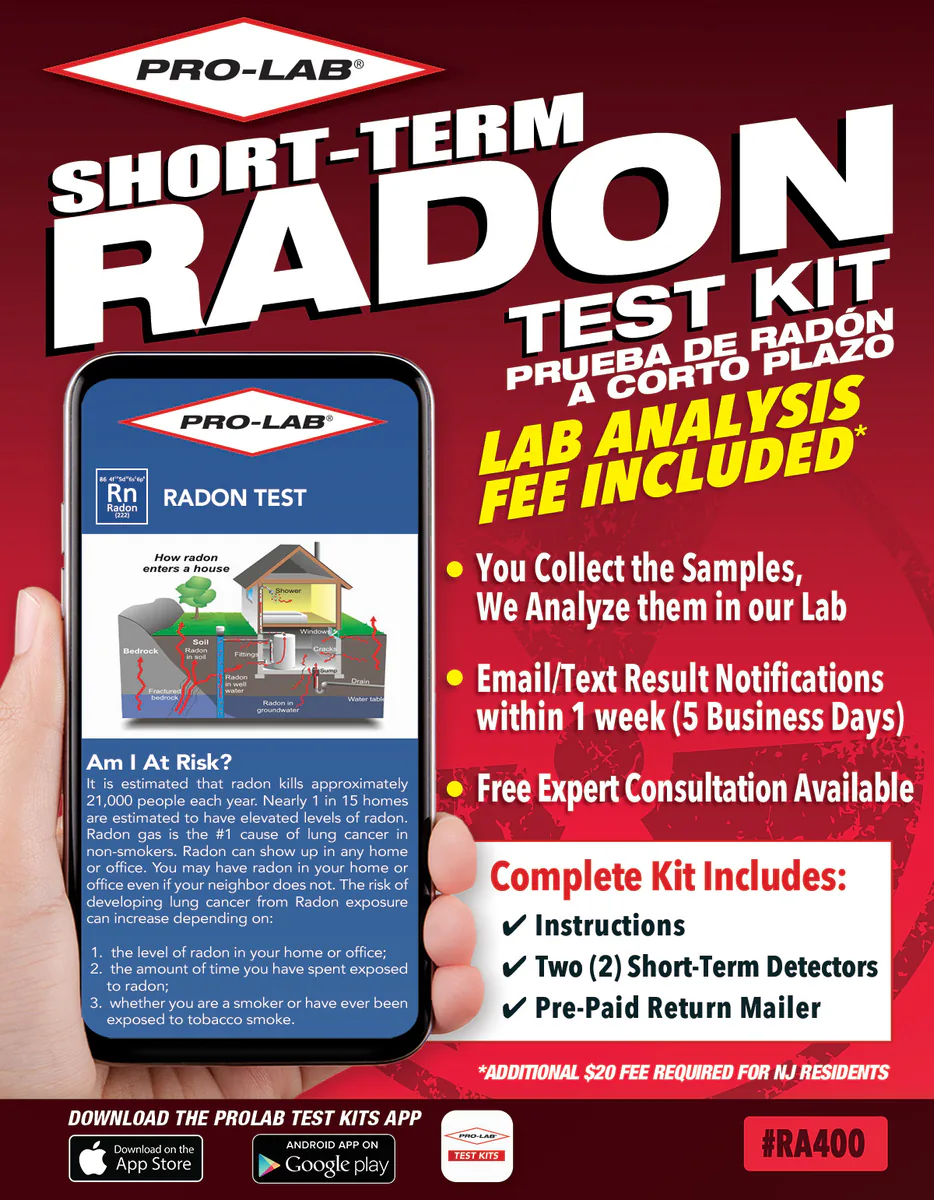
Short-term kit
Method: Liquid scintillation
In home: 48 to 96 hours
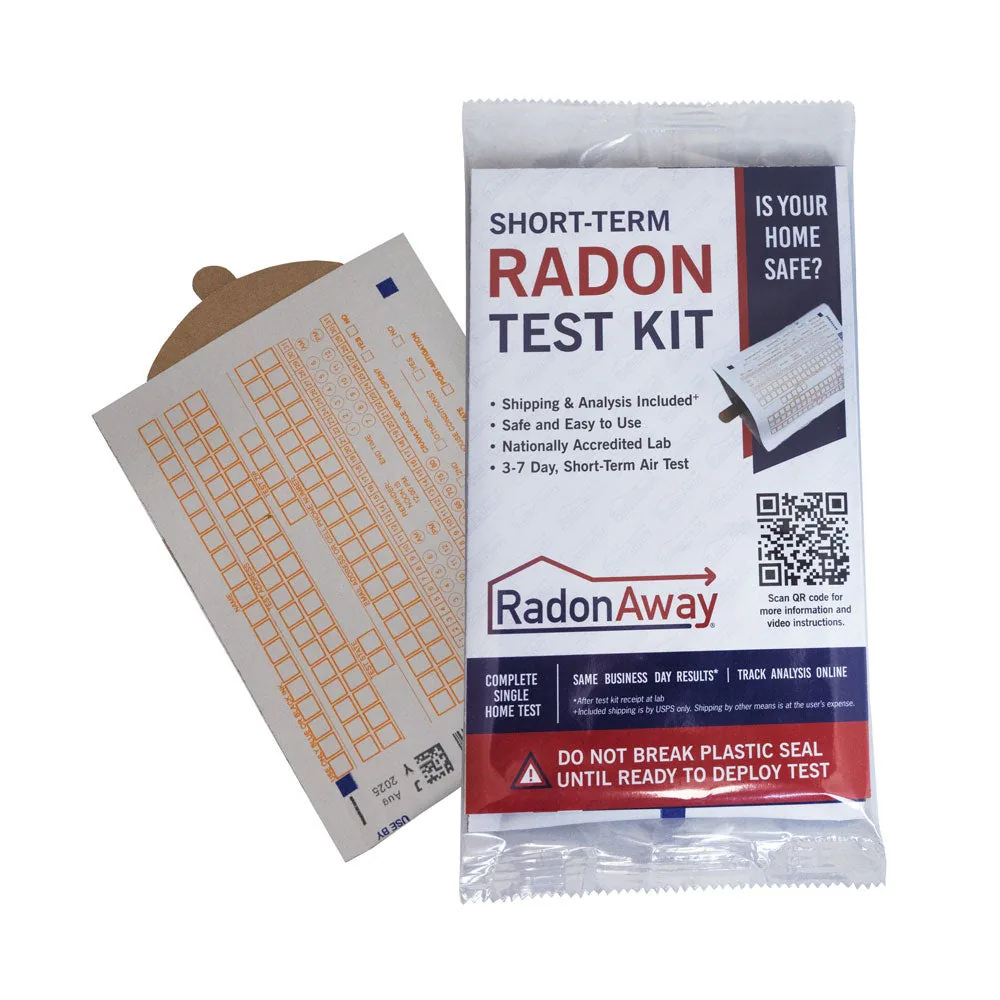
Short-term kit
In home: 72 to 168 hours
No Amazon listing on file
See details of the RadonAway Air Chek Short-TermTest kits and monitors: 1 of 42
As an Amazon Associate, Radon411 earns from qualifying purchases.
Best radon monitors for Indiana homes, compared
Testing: 1 of 5
Mitigation: 1 of 3
Explore
Indiana, Next steps
What to do next: 1 of 4
Informational. Follow EPA guidance. EPA says all radon tests should be taken for a minimum of 48 hours, with windows and doors closed from 12 hours before a short-term test.