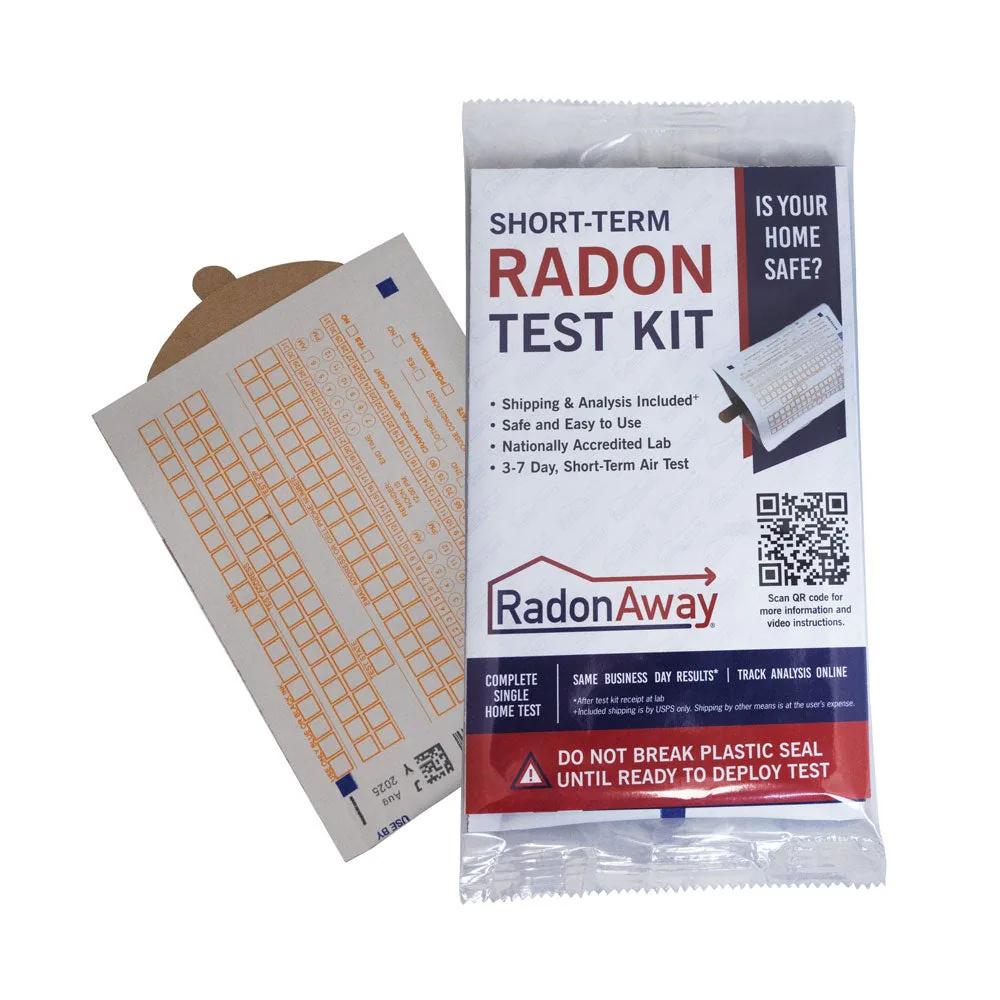
Short-term kit
Air Chek Short-Term radon test kit you hang, lab fee included
- Lab fee included
In home: 72 to 168 hours
Locations and reports
Maine's counties span EPA Zones 1 and 2. Homes with elevated levels occur in all three zones, so only a test measures yours.
Data checked By Radon411Methodology
Share at 4+ pCi/L
37.6%
1.9 pts above U.S.
11,825 tests across 16 counties, 2008 to 2017
Rank among states
17 of 47
Middle of the states
By share, every state pooled the same way, 2008 to 2017
Counties in EPA Zone 1
12 of 16
Most at highest potential
Most counties sit in Zone 1; Zone 1 is the highest potential
Highest county
48.4%
York County
Counties with 30+ tests, 2008 to 2017
Read a result for Maine
EPA’s own thresholds; the figures are the area’s, never this home’s.
EPA’s reading of 4.0 pCi/L
At or above 4 pCi/L
This result is at or above 4 pCi/L. EPA recommends fixing a home when the radon level is 4 pCi/L or higher. 37.6% of Maine's reported tests reached 4 pCi/L, 2008 to 2017.
The data
Maine, At a glance
Predicted: EPA radon zone
EPA classifies counties, not states. Of the 16 counties in Maine with a zone, 12 are in Zone 1 and 4 in Zone 2.
An EPA radon zone predicts a whole county. It is not intended to determine whether any individual home should be tested: homes with elevated levels occur in all three zones, and EPA recommends testing every home regardless of zone.
Predicted: EPA Map of Radon Zones
Measured: tests reported to CDC
CDC publishes Maine's radon test figures by county: 16 of its 16 counties have one. Each one's share is in the county list.
Maine, Compared
Maine pools to 37.6%: that share of 11,825 reported tests from 16 counties over the 2008 to 2017 laboratory totals reached EPA's action level. Nationally the pooled share is 35.7%: 1.9 points lower than here.
Among 47 states pooled the same way it ranks 17th, with Indiana (38.9%) above it and West Virginia (37.5%) below. York County reports the highest share (48.4% of 1,389 tests) and Penobscot County the lowest (16.4%); the most tests came from Cumberland County, 4,076 of them at 43.5%.
Across its 4 overlapping ten-year totals, the share went from 36.6% (2005 to 2014) to 37.6% (2008 to 2017), within 2 points, with 2006 to 2015 the highest at 37.6%. By band, 11 counties at 30% to 50%, 5 counties at 15% to 30%.
EPA's 1993 map puts 12 of its 16 classified counties in Zone 1; the tests reported since bear that out at 37.6%.
| County | Rank | Tests | At or above 4 pCi/L |
|---|---|---|---|
| York County | 1 of 16 | 1,389 | 48.4% |
| Piscataquis County | 2 of 16 | 44 | 47.7% |
| Aroostook County | 3 of 16 | 608 | 45.1% |
| Cumberland County | 4 of 16 | 4,076 | 43.5% |
| Oxford County | 5 of 16 | 392 | 43.1% |
| Hancock County | 6 of 16 | 327 | 39.1% |
| Androscoggin County | 7 of 16 | 1,497 | 36.9% |
| Lincoln County | 8 of 16 | 246 | 35.8% |
| Waldo County | 9 of 16 | 209 | 32.1% |
| Kennebec County | 10 of 16 | 696 | 30.3% |
| Penobscot County | 16 of 16 | 1,491 | 16.4% |
| Somerset County | 15 of 16 | 85 | 18.8% |
| Franklin County | 14 of 16 | 141 | 29.1% |
| Knox County | 13 of 16 | 287 | 29.6% |
| Washington County | 12 of 16 | 54 | 29.6% |
| Share | Counties | Their tests | For example |
|---|---|---|---|
| 50% or more | 0 | 0 | None |
| 30% to 50% | 11 | 9,767 | York County, Piscataquis County, Aroostook County |
| 15% to 30% | 5 | 2,058 | Washington County, Knox County, Franklin County |
| 5% to 15% | 0 | 0 | None |
| Under 5% | 0 | 0 | None |
Pooled shares: Radon411's sum of CDC's county counts for one period. CDC publishes no state or national figure.
Maine, Counties
The map of Maine, then its 16 counties zone by zone, each with its reported share at or above 4 pCi/L and a report of its own.

48.4%at or above 4 pCi/L
Median 3.7 pCi/L · 1,389 tests · 10.8 points above Maine
47.7%at or above 4 pCi/L
Median 3.5 pCi/L · 44 tests · 10.1 points above Maine
45.1%at or above 4 pCi/L
Median 3.5 pCi/L · 608 tests · 7.5 points above Maine
43.5%at or above 4 pCi/L
Median 3.2 pCi/L · 4,076 tests · 5.9 points above Maine
43.1%at or above 4 pCi/L
Median 3.3 pCi/L · 392 tests · 5.5 points above Maine
39.1%at or above 4 pCi/L
Median 2.6 pCi/L · 327 tests · 1.6 points above Maine
36.9%at or above 4 pCi/L
Median 2.8 pCi/L · 1,497 tests · 0.7 points below Maine
35.8%at or above 4 pCi/L
Median 2.5 pCi/L · 246 tests · 1.8 points below Maine
32.1%at or above 4 pCi/L
Median 2.3 pCi/L · 209 tests · 5.5 points below Maine
30.3%at or above 4 pCi/L
Median 2.1 pCi/L · 696 tests · 7.3 points below Maine
30.0%at or above 4 pCi/L
Median 2.1 pCi/L · 283 tests · 7.5 points below Maine
29.6%at or above 4 pCi/L
Median 1.6 pCi/L · 54 tests · 8.0 points below Maine
Local help
Maine, Local resources
Who to ask in Maine: its radon program, test kits and professionals.
Under Maine law, only the owner or occupant of a residence or someone registered with the state to provide these services, may test for radon, install and/or advise on the installation of a radon reduction (mitigation) system.
What it means
Maine, Questions
Maine has 16 counties on EPA's Map of Radon Zones: Zone 1, the highest predicted potential, for 12; Zone 2 for 4; Zone 3 for 0. Pooled from 16 counties, 37.6% of the 11,825 radon tests reported to CDC over the 2008 to 2017 laboratory totals were at or above 4 pCi/L, 17th of 47 states.
Zone 1 holds 12 counties in Maine; the first 8 by name are Androscoggin County, Aroostook County, Cumberland County, Franklin County, Hancock County, Kennebec County, Lincoln County, Oxford County, the rest in the county table on this page.
York County 48.4% (1,389 tests) leads Maine by the share of reported tests at or above 4 pCi/L, 2008 to 2017, laboratory, then Piscataquis County 47.7% (44 tests), Aroostook County 45.1% (608 tests), Cumberland County 43.5% (4,076 tests), Oxford County 43.1% (392 tests).
Maine is in EPA Region 1: New England.
Products
Maine, Products
37.6% of the 11,825 tests reported to CDC for Maine over the 2008 to 2017 laboratory totals reached 4 pCi/L: a short-term kit (2 to 90 days) gives a first answer in days, a long-term test the year-round average. A short-term kit (2 to 90 days) is the quick first check for a home in Maine; a long-term test tells the year-round average.
Short-term kit
In home: 72 to 168 hours

Long-term kit
Method: Alpha track
In home: 90 days to 12 months
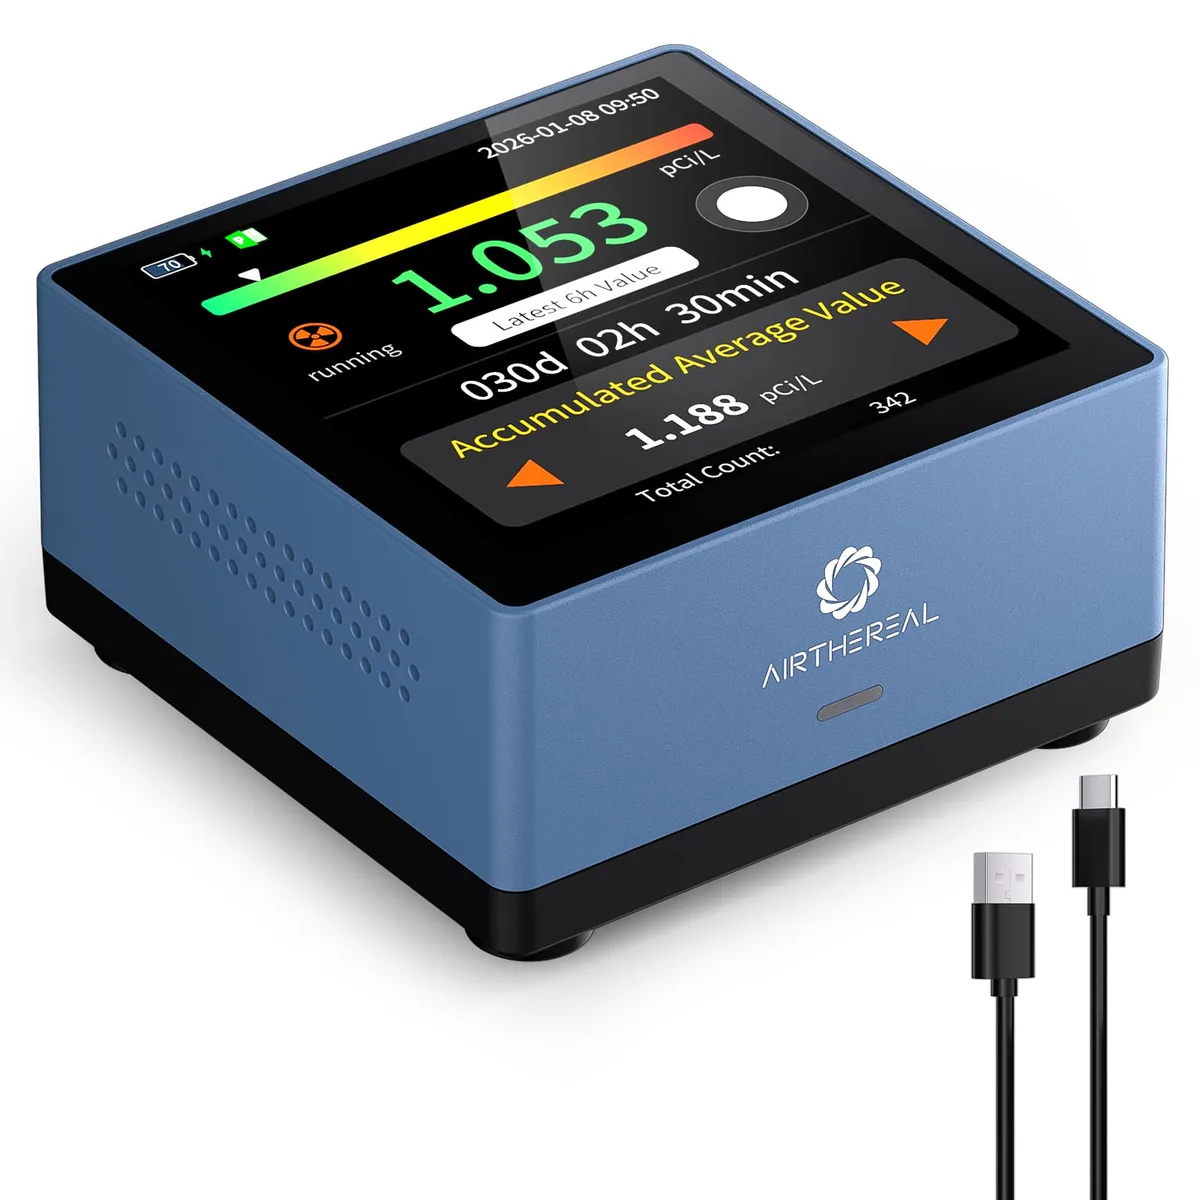
Monitor
Method: Semiconductor sensor
Test kits and monitors: 1 of 3