
Long-term kit
RL416 long-term radon test kit, lab fee included
- Lab fee included
Method: Alpha track
In home: 90 days to 12 months
Locations and reports
EPA puts Washington County in Zone 1, its highest radon zone, and 21.3% of its 1,518 reported radon tests (2023) were at or above 4 pCi/L. Homes with elevated levels occur in all three zones, so only a test measures yours.
Data checked By Radon411Methodology
Share at 4+ pCi/L
21.3%
13.3 pts below MN
1,518 tests, 2023
Median result
1.9pCi/L
Below action level
Midpoint of the tests, 2023
Tests reported
1,518
4th of 62 by tests
Reported to CDC before any fix, 2023
EPA radon zone
Zone 1
Highest potential
1 highest, 3 lowest
EPA predicts over 4 pCi/L indoors
Rank in Minnesota
58 of 62
Lowest quarter
By share, of 62 with 30+ tests
Read a result for Washington County
EPA’s own thresholds; the figures are the area’s, never this home’s.
EPA’s reading of 1.9 pCi/L
Below 2 pCi/L
This result is below 2 pCi/L, the level at which EPA says a fix should be considered. Washington County's median reported result, 2023.
The data
Washington County, At a glance
Predicted: EPA radon zone
EPA puts all of Washington County in
USGS geologic potential: High across 100% of the county's area
Predicted: EPA Map of Radon Zones
Measured: tests reported to CDC
| Year | Share of reported tests at or above 4 pCi/L |
|---|---|
| 2014 | 33.1% |
| 2015 | 33.4% |
| 2016 | 28.1% |
| 2017 | 30.4% |
| 2018 | 31.6% |
| 2019 | 29.0% |
| 2020 | 26.3% |
| 2021 | 25.5% |
| 2022 | 26.5% |
| 2023 | 21.3% |
2023: 21.3%. Across these years the share ran from 21.3% to 33.4%. Each column counts radon tests reported to CDC that year, not homes.
These are the 1,518 tests reported to CDC for Washington County over 2023, many from homes being sold or already suspected of a problem: they describe the county's reported tests, not this house.
Measured: CDC tracking data. Figure above: 2023. Measured data period: 2005 to 2023 (every CDC figure on file).
Washington County, Compared
Washington County's 1,518 reported tests in 2023 had a middle value of 1.9 pCi/L and a maximum of 49.1 pCi/L, and 21.3% reached 4 pCi/L. Minnesota as a whole (86 Minnesota counties, pooled) comes to 34.6%: 13.3 points higher than here.
Among its state's counties it ranks 58th of 62 Minnesota counties with 30 or more tests for the same period. Statewide for the same period, Renville County reported the highest share (75.7%) and Lake County the lowest (3.8%).
Below the action level, 780 tests (51.4%) came in under 2 pCi/L, against 36.6% statewide, and 415 tests (27.3%) fell between 2 and 4, against 28.9% statewide. The busiest year on file was 2015, with 1,964 tests reported; the quietest, 2019, had 844.
EPA's 1993 zone map puts Washington County in Zone 1, a predicted county average above 4 pCi/L. USGS geology rates 100% of the county's land high radon potential.
Next door, the shares run from 19.3% in Anoka County to 37.4% in St. Croix County, WI, with Anoka County below Washington County. Over 10 years of annual figures the share fell 11.8 points, from 33.1% in 2014 to 21.3% in 2023; its peak was 33.4% in 2015.
| Year | Tests | Washington County, at or above 4 pCi/L | Minnesota, pooled |
|---|---|---|---|
| 2014 | 1,816 | 33.1% | 42.9% |
| 2015 | 1,964 | 33.4% | 43.6% |
| 2016 | 1,843 | 28.1% | 37.0% |
| 2017 | 1,703 | 30.4% | 38.2% |
| 2018 | 1,840 | 31.6% | 38.3% |
| 2019 | 844 | 29.0% | 36.1% |
| 2020 | 1,283 | 26.3% | 31.8% |
| 2021 | 1,385 | 25.5% | 33.1% |
| 2022 | 1,274 | 26.5% | 31.6% |
| 2023 | 1,518 | 21.3% | 34.6% |
Pooled shares: Radon411's sum of CDC's county counts for one period.
Washington County, State data
What Minnesota's own agencies publish about radon tests in Washington County, with their period. These are not CDC's figures and are never added to them.
Radon Testing (MN Public Health Data Access Portal): home radon tests reported voluntarily by private laboratories and licensed radon measurement professionals, counted by property. Period: 2016-2025.
Share with one or more tests at or above 4 pCi/L
27.9%
4,235 properties tested with one or more tests at or above 4 pCi/L
Median result
2.4 pCi/L
Average result
3.2 pCi/L
Tests behind these figures
1,519 properties tested a year on average
Measured: Minnesota Department of Health data, 2016-2025.
Washington County, Geology
USGS's geologic map puts all of Washington County's mapped land in one class: high radon potential. The map puts 82.7% of Washington County in the area it calls Central Lowland-Western Lake Section and 17.2% in Central Lowland-Till Prairie. USGS gives both a radon index of 14, in the high band (12 to 17).
| Area | The rock, in USGS's words | Potential | Radon index | Share of land |
|---|---|---|---|---|
| Central Lowland-Western Lake Section | Red sandy till derived primarily from sandstone. | High | 14 | 82.7% |
| Central Lowland-Till Prairie | Silty and clayey till derived from shale and sandstone. | High | 14 | 17.2% |
Names, descriptions and indexes: U.S. Geological Survey, Geologic Radon Potential Map (2025). Shares: Radon411, from the map cut to the boundary.
Washington County has more high-potential ground than Minnesota as a whole: 100% of its land against 61.1%. Of the 7 counties that border it, none has as large a share of high-potential ground; Anoka County comes nearest at 100%.
The map rates the ground, not the air in any home.
Local help
Washington County, Local resources
Listed radon businesses with an address in Washington County:
Listed radon professionals by town: Woodbury, Cottage Grove, Oakdale, Hastings, Forest Lake, Stillwater
The Radon Licensing Act requires anyone who performs a radon test or radon mitigation, in a building they do not own or lease, must be licensed by MDH.
The Minnesota Radon Awareness Act requires specific disclosure and education be provided to potential home buyers during residential real estate transactions in Minnesota.
What it means
Washington County, Questions
In 2023, 21.3% of the radon tests reported to CDC for Washington County, Minnesota were at or above 4 pCi/L, and the median reported pre-mitigation result was 1.9 pCi/L. Of 62 Minnesota counties with 30 or more tests for the same period, 57 reported a higher share; pooled, the state comes to 34.6%.
Washington County borders 7 counties: Ramsey County, MN, St. Croix County, WI, Dakota County, MN, Anoka County, MN, Pierce County, WI, Chisago County, MN and Polk County, WI.
Products
Washington County, Products
In Washington County, 21.3% of 1,518 tests reported to CDC in 2023 reached 4 pCi/L, against 34.6% pooled across Minnesota. In Zone 1 the year-round level in Washington County is the one to know: a long-term test (more than 90 days) or a monitor, with a short-term kit for a first answer.
Long-term kit
Method: Alpha track
In home: 90 days to 12 months
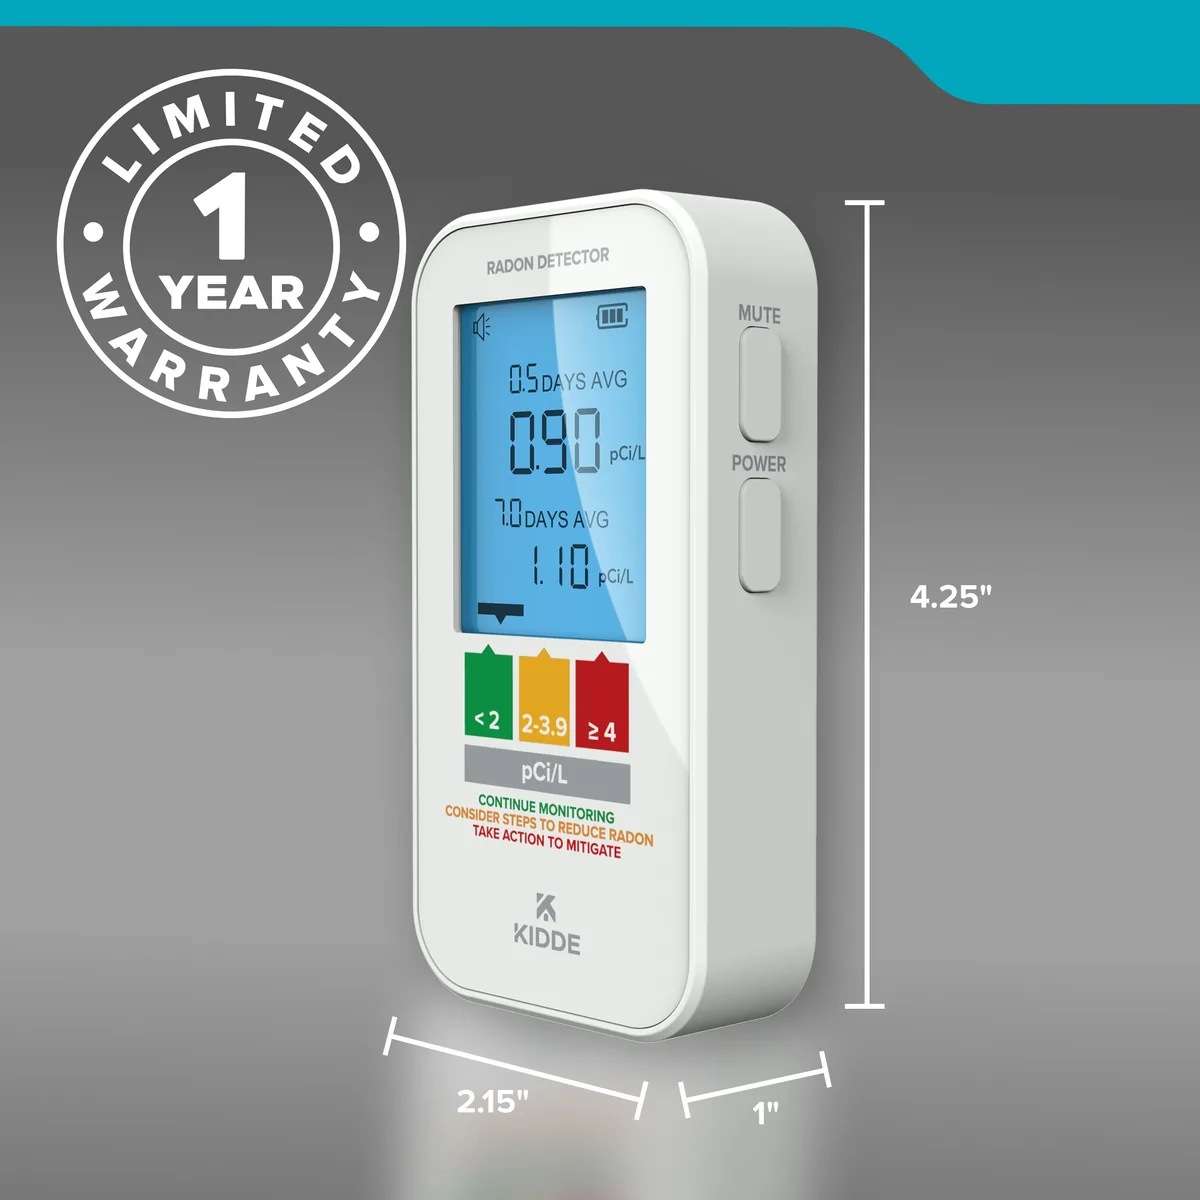
MonitorKidde
Method: Semiconductor sensor
First reading: Within 12 hours
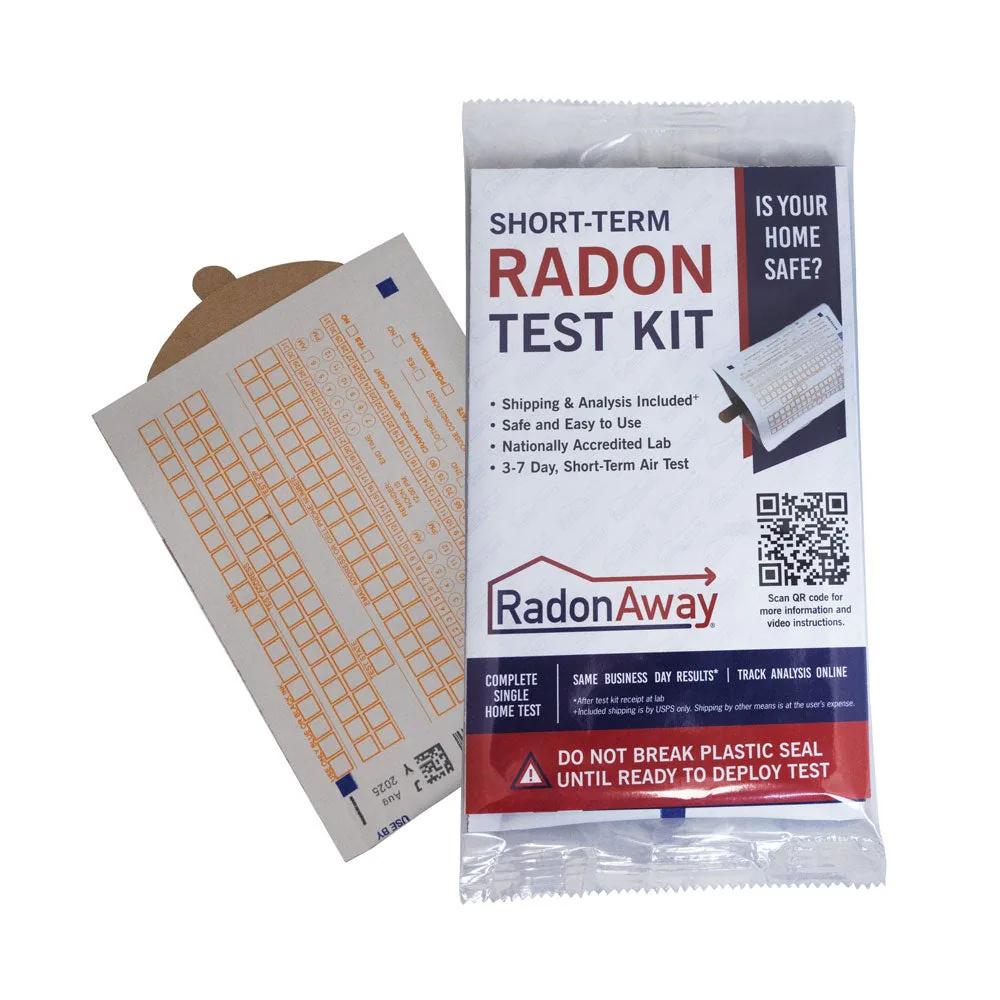
Short-term kit
In home: 72 to 168 hours
Test kits and monitors: 1 of 3
Washington County is in EPA Zone 1, the highest predicted radon potential. Best radon monitors for Zone 1 counties like Washington County
Explore
Washington County, Bordering counties
37.4%at or above 4 pCi/L
Median 3.0 pCi/L · 348 tests · 16.1 points above Washington County
34.9%at or above 4 pCi/L
Median 2.9 pCi/L · 166 tests · 13.6 points above Washington County
34.6%at or above 4 pCi/L
Median 2.9 pCi/L · 2,183 tests · 13.3 points above Washington County
33.6%at or above 4 pCi/L
Median 2.8 pCi/L · 122 tests · 12.3 points above Washington County
30.9%at or above 4 pCi/L
Median 2.7 pCi/L · 136 tests · 9.6 points above Washington County
23.5%at or above 4 pCi/L
Median 2.2 pCi/L · 2,213 tests · 2.2 points above Washington County
19.3%at or above 4 pCi/L
Median 1.9 pCi/L · 880 tests · 2.0 points below Washington County
Washington County, Cities and towns
Washington County is growing: the Census Bureau puts it at 286,895 residents on July 1, 2025, up 6.9% from 268,397 in 2020. That works out to 746 people per square mile of land. Its largest town, Woodbury, has 81,558 residents, 28.4% of the total. CDC's 1,518 reported tests for 2023 work out to 5.3 per 1,000 residents (2025 estimate), close to Minnesota's 3.9.
From Woodbury to Lakeland Shores, CDC publishes no figure by town: each reads Washington County's.
| Place | Residents | Since 2020 | Share of residents |
|---|---|---|---|
| Woodbury | 81,558 | +8.1% | 28.4% |
| Cottage Grove | 43,604 | +11.8% | 15.2% |
| Oakdale | 30,588 | +8.2% | 10.7% |
| White Bear Lakeextends beyond Washington County | 23,392 | −5.6% | Counted whole |
| Hastingsextends beyond Washington County | 22,563 | +1.8% | Counted whole |
| Forest Lake | 20,952 | +1.2% | 7.3% |
| Stillwater | 19,354 | −0.2% | 6.7% |
| Hugo | 17,167 | +8.6% | 6.0% |
| Lake Elmo | 14,376 | +26.7% | 5.0% |
| Mahtomedi | 8,189 | +0.6% | 2.9% |
| Newport | 5,525 | +40.2% | 1.9% |
| St. Paul Park | 5,396 | −2.7% | 1.9% |
27 incorporated places, as listed in the U.S. Census Bureau’s 2020 place reference files. “(part)” marks a place that extends into another county. Residents: U.S. Census Bureau population estimates for July 1, 2025 (Vintage 2025). A place that extends beyond Washington County is counted whole, so it has no share.
Washington County, Homes
Of Washington County's 107,035 homes, 68% are detached houses, against 66% across Minnesota; 12% are in buildings of five or more homes. Much of Washington County is recent building: 32% of its homes have gone up since 2000 and the middle year built is 1992, against 1978 for Minnesota. Owners live in 81% of the occupied homes (Minnesota: 72%), so for most households a test and a fix are their own to order.
| Homes | Washington County | Minnesota |
|---|---|---|
| Housing units | 107,035 | 2,519,538 |
| Detached houses | 68% | 66% |
| In buildings of 5 or more | 12% | 19% |
| Mobile homes | 2% | 3% |
| Built before 1960 | 13% | 29% |
| Built since 2000 | 32% | 22% |
| Middle year built | 1992 | 1978 |
| Owner-occupied | 81% | 72% |
Census Bureau, American Community Survey, 2019 to 2023: estimates from a sample of homes, looser for a small place. Shares by Radon411.