Locations and reports
Radon Levels in Texas
What this means for you
- Your area: None of Texas's 254 classified counties is in EPA Zone 1, the highest of its three radon zones. Zones are predictions for whole counties, and homes with elevated levels occur in all three zones.
- Local tests: CDC publishes Texas's radon test results by county. Open your county below to see its figures.
- Your home: The only way to know your home’s level is to test it.
pCi/L (picocuries per liter) is the unit radon is measured in. EPA recommends fixing a home at 4 pCi/L or above, its action level.
For Texas, EPA's Map of Radon Zones places 0 of its 254 classified counties in Zone 1, highest predicted potential, a prediction for each county as a whole. Radon levels vary from home to home, so only a test measures the level in yours.
Predicted: EPA radon zone
254 of 254 counties classified
EPA classifies counties, not states. Of the 254 counties in Texas with a zone, 39 are in Zone 2 and 215 in Zone 3.
- Zone 2: Moderate predicted potential2 to 4 pCi/L39 of 254 counties · 15.4%
- Zone 3: Lower predicted potentialless than 2 pCi/L215 of 254 counties · 84.6%
An EPA radon zone describes predicted potential across a whole county. It is not intended to determine whether any individual home should be tested, and homes with elevated levels occur in all three zones. EPA recommends testing every home regardless of zone, and testing is the only way to know the radon level in a specific building.
This is a county-level geologic prediction. It is not a measurement of any address, and houses with elevated radon are found in all three zones.
Predicted: EPA Map of Radon Zones
Measured: tests reported to CDC
CDC publishes Texas's radon test figures by county: 150 of its 254 counties have one. Each county's share is in the county list.
Texas, In figures
Texas in figures
What the published data says about Texas, in words. A zone and a share of tests describe an area, never the level in any one home.
Predicted
PredictedEPA places 39 of Texas's 254 counties in Zone 2 and 215 in Zone 3.
No Texas county is in Zone 1.
Compared
Calculated by Radon4110% of Texas's counties with a zone on file are in Zone 1, a smaller share than across all U.S. counties (34%). It is a share of counties, not of land, people or homes.
Reported tests
MeasuredCDC has no statewide testing figure for Texas on file here.
150 of the 254 counties have a published county figure; the most tests in each one's latest year were reported for Dallas County (381 in 2017), Harris County (300 in 2017) and Travis County (194 in 2017).
Texas's radon program is the Texas Radon Group, run by Texas Tech University; its contacts are under Local resources.
Texas, Counties
Texas counties by EPA zone
PredictedAll 254 counties, by the zone EPA predicts for each. Every county has its own report.
Zone 2: moderate predicted potential39
- Armstrong CountyReported testing not yet available
- Bailey CountyReported testing not yet available
- Brewster County50.0% of reported tests at or above 4 pCi/L, 2017
- Carson County100.0% of reported tests at or above 4 pCi/L, 2017
- Castro County0.0% of reported tests at or above 4 pCi/L, 2017
- Crosby CountyReported testing not yet available
- Culberson CountyReported testing not yet available
- Dallam County100.0% of reported tests at or above 4 pCi/L, 2017
- Deaf Smith County83.3% of reported tests at or above 4 pCi/L, 2017
- Donley County100.0% of reported tests at or above 4 pCi/L, 2017
- Floyd CountyReported testing not yet available
- Garza County0.0% of reported tests at or above 4 pCi/L, 2015
- Gray County0.0% of reported tests at or above 4 pCi/L, 2017
- Hale County81.8% of reported tests at or above 4 pCi/L, 2017
- Hansford CountyReported testing not yet available
- Hartley County50.0% of reported tests at or above 4 pCi/L, 2017
- Hemphill County0.0% of reported tests at or above 4 pCi/L, 2017
- Hockley County0.0% of reported tests at or above 4 pCi/L, 2016
- Hudspeth CountyReported testing not yet available
- Hutchinson County20.0% of reported tests at or above 4 pCi/L, 2017
- Jeff Davis County28.6% of reported tests at or above 4 pCi/L, 2017
- Lamb CountyReported testing not yet available
- Lipscomb County100.0% of reported tests at or above 4 pCi/L, 2017
- Llano County0.0% of reported tests at or above 4 pCi/L, 2017
- Lubbock County55.7% of reported tests at or above 4 pCi/L, 2017
- Lynn CountyReported testing not yet available
- Mason CountyReported testing not yet available
- Moore County100.0% of reported tests at or above 4 pCi/L, 2017
- Ochiltree County100.0% of reported tests at or above 4 pCi/L, 2017
- Oldham CountyReported testing not yet available
- Parmer County100.0% of reported tests at or above 4 pCi/L, 2017
- Potter County23.0% of reported tests at or above 4 pCi/L, 2017
- Presidio CountyReported testing not yet available
- Randall County69.0% of reported tests at or above 4 pCi/L, 2017
- Reeves CountyReported testing not yet available
- Roberts CountyReported testing not yet available
- Sherman County0.0% of reported tests at or above 4 pCi/L, 2017
- Swisher County100.0% of reported tests at or above 4 pCi/L, 2017
- Terrell CountyReported testing not yet available
Zone 3: lower predicted potential215
- Anderson CountyReported testing not yet available
- Andrews CountyReported testing not yet available
- Angelina County0.0% of reported tests at or above 4 pCi/L, 2017
- Aransas County0.0% of reported tests at or above 4 pCi/L, 2017
- Archer CountyReported testing not yet available
- Atascosa County0.0% of reported tests at or above 4 pCi/L, 2017
- Austin County0.0% of reported tests at or above 4 pCi/L, 2017
- Bandera CountyReported testing not yet available
- Bastrop County61.5% of reported tests at or above 4 pCi/L, 2017
- Baylor CountyReported testing not yet available
- Bee CountyReported testing not yet available
- Bell County16.7% of reported tests at or above 4 pCi/L, 2017
- Bexar County6.5% of reported tests at or above 4 pCi/L, 2017
- Blanco County0.0% of reported tests at or above 4 pCi/L, 2017
- Borden CountyReported testing not yet available
- Bosque CountyReported testing not yet available
- Bowie County0.0% of reported tests at or above 4 pCi/L, 2015
- Brazoria County6.3% of reported tests at or above 4 pCi/L, 2017
- Brazos County0.0% of reported tests at or above 4 pCi/L, 2017
- Briscoe CountyReported testing not yet available
- Brooks CountyReported testing not yet available
- Brown County0.0% of reported tests at or above 4 pCi/L, 2017
- Burleson CountyReported testing not yet available
- Burnet County71.4% of reported tests at or above 4 pCi/L, 2017
- Caldwell County0.0% of reported tests at or above 4 pCi/L, 2017
- Calhoun CountyReported testing not yet available
- Callahan CountyReported testing not yet available
- Cameron County0.0% of reported tests at or above 4 pCi/L, 2017
- Camp CountyReported testing not yet available
- Cass County0.0% of reported tests at or above 4 pCi/L, 2017
- Chambers County0.0% of reported tests at or above 4 pCi/L, 2017
- Cherokee County0.0% of reported tests at or above 4 pCi/L, 2017
- Childress County0.0% of reported tests at or above 4 pCi/L, 2017
- Clay CountyReported testing not yet available
- Cochran CountyReported testing not yet available
- Coke CountyReported testing not yet available
- Coleman CountyReported testing not yet available
- Collin County7.6% of reported tests at or above 4 pCi/L, 2017
- Collingsworth County100.0% of reported tests at or above 4 pCi/L, 2017
- Colorado County0.0% of reported tests at or above 4 pCi/L, 2017
- Comal County4.5% of reported tests at or above 4 pCi/L, 2017
- Comanche CountyReported testing not yet available
- Concho CountyReported testing not yet available
- Cooke County0.0% of reported tests at or above 4 pCi/L, 2017
- Coryell County0.0% of reported tests at or above 4 pCi/L, 2017
- Cottle CountyReported testing not yet available
- Crane CountyReported testing not yet available
- Crockett CountyReported testing not yet available
- Dallas County8.4% of reported tests at or above 4 pCi/L, 2017
- Dawson County25.0% of reported tests at or above 4 pCi/L, 2017
- Delta CountyReported testing not yet available
- Denton County6.8% of reported tests at or above 4 pCi/L, 2017
- DeWitt County0.0% of reported tests at or above 4 pCi/L, 2017
- Dickens CountyReported testing not yet available
- Dimmit CountyReported testing not yet available
- Duval CountyReported testing not yet available
- Eastland County0.0% of reported tests at or above 4 pCi/L, 2017
- Ector County0.0% of reported tests at or above 4 pCi/L, 2017
- Edwards CountyReported testing not yet available
- El Paso County0.0% of reported tests at or above 4 pCi/L, 2017
- Ellis County66.7% of reported tests at or above 4 pCi/L, 2017
- Erath CountyReported testing not yet available
- Falls CountyReported testing not yet available
- Fannin County0.0% of reported tests at or above 4 pCi/L, 2017
- Fayette County0.0% of reported tests at or above 4 pCi/L, 2017
- Fisher CountyReported testing not yet available
- Foard CountyReported testing not yet available
- Fort Bend County2.9% of reported tests at or above 4 pCi/L, 2017
- Franklin County0.0% of reported tests at or above 4 pCi/L, 2015
- Freestone County0.0% of reported tests at or above 4 pCi/L, 2017
- Frio CountyReported testing not yet available
- Gaines CountyReported testing not yet available
- Galveston County0.0% of reported tests at or above 4 pCi/L, 2017
- Gillespie County16.7% of reported tests at or above 4 pCi/L, 2017
- Glasscock CountyReported testing not yet available
- Goliad County0.0% of reported tests at or above 4 pCi/L, 2016
- Gonzales County0.0% of reported tests at or above 4 pCi/L, 2017
- Grayson County5.0% of reported tests at or above 4 pCi/L, 2017
- Gregg County0.0% of reported tests at or above 4 pCi/L, 2017
- Grimes County0.0% of reported tests at or above 4 pCi/L, 2017
- Guadalupe County0.0% of reported tests at or above 4 pCi/L, 2017
- Hall CountyReported testing not yet available
- Hamilton County0.0% of reported tests at or above 4 pCi/L, 2017
- Hardeman CountyReported testing not yet available
- Hardin County0.0% of reported tests at or above 4 pCi/L, 2017
- Harris County2.9% of reported tests at or above 4 pCi/L, 2017
- Harrison County0.0% of reported tests at or above 4 pCi/L, 2017
- Haskell CountyReported testing not yet available
- Hays County17.4% of reported tests at or above 4 pCi/L, 2017
- Henderson County0.0% of reported tests at or above 4 pCi/L, 2017
- Hidalgo County0.0% of reported tests at or above 4 pCi/L, 2017
- Hill County0.0% of reported tests at or above 4 pCi/L, 2017
- Hood County0.0% of reported tests at or above 4 pCi/L, 2017
- Hopkins County100.0% of reported tests at or above 4 pCi/L, 2017
- Houston County0.0% of reported tests at or above 4 pCi/L, 2017
- Howard County0.0% of reported tests at or above 4 pCi/L, 2017
- Hunt County25.0% of reported tests at or above 4 pCi/L, 2017
- Irion CountyReported testing not yet available
- Jack CountyReported testing not yet available
- Jackson County0.0% of reported tests at or above 4 pCi/L, 2017
- Jasper County0.0% of reported tests at or above 4 pCi/L, 2017
- Jefferson County4.3% of reported tests at or above 4 pCi/L, 2017
- Jim Hogg CountyReported testing not yet available
- Jim Wells County0.0% of reported tests at or above 4 pCi/L, 2017
- Johnson County0.0% of reported tests at or above 4 pCi/L, 2017
- Jones County0.0% of reported tests at or above 4 pCi/L, 2017
- Karnes CountyReported testing not yet available
- Kaufman County0.0% of reported tests at or above 4 pCi/L, 2017
- Kendall County71.4% of reported tests at or above 4 pCi/L, 2017
- Kenedy CountyReported testing not yet available
- Kent CountyReported testing not yet available
- Kerr County0.0% of reported tests at or above 4 pCi/L, 2017
- Kimble County0.0% of reported tests at or above 4 pCi/L, 2017
- King CountyReported testing not yet available
- Kinney CountyReported testing not yet available
- Kleberg County0.0% of reported tests at or above 4 pCi/L, 2015
- Knox CountyReported testing not yet available
- La Salle CountyReported testing not yet available
- Lamar County0.0% of reported tests at or above 4 pCi/L, 2017
- Lampasas CountyReported testing not yet available
- Lavaca County0.0% of reported tests at or above 4 pCi/L, 2017
- Lee CountyReported testing not yet available
- Leon County0.0% of reported tests at or above 4 pCi/L, 2014
- Liberty County0.0% of reported tests at or above 4 pCi/L, 2017
- Limestone County0.0% of reported tests at or above 4 pCi/L, 2016
- Live Oak CountyReported testing not yet available
- Loving CountyReported testing not yet available
- Madison County0.0% of reported tests at or above 4 pCi/L, 2017
- Marion CountyReported testing not yet available
- Martin CountyReported testing not yet available
- Matagorda County33.3% of reported tests at or above 4 pCi/L, 2017
- Maverick County0.0% of reported tests at or above 4 pCi/L, 2017
- McCulloch CountyReported testing not yet available
- McLennan County23.3% of reported tests at or above 4 pCi/L, 2017
- McMullen CountyReported testing not yet available
- Medina County0.0% of reported tests at or above 4 pCi/L, 2017
- Menard CountyReported testing not yet available
- Midland County1.0% of reported tests at or above 4 pCi/L, 2017
- Milam CountyReported testing not yet available
- Mills CountyReported testing not yet available
- Mitchell CountyReported testing not yet available
- Montague County12.5% of reported tests at or above 4 pCi/L, 2017
- Montgomery County3.2% of reported tests at or above 4 pCi/L, 2017
- Morris County0.0% of reported tests at or above 4 pCi/L, 2017
- Motley CountyReported testing not yet available
- Nacogdoches County0.0% of reported tests at or above 4 pCi/L, 2017
- Navarro County0.0% of reported tests at or above 4 pCi/L, 2017
- Newton CountyReported testing not yet available
- Nolan County0.0% of reported tests at or above 4 pCi/L, 2017
- Nueces County0.0% of reported tests at or above 4 pCi/L, 2017
- Orange County0.0% of reported tests at or above 4 pCi/L, 2017
- Palo Pinto CountyReported testing not yet available
- Panola County0.0% of reported tests at or above 4 pCi/L, 2017
- Parker County11.1% of reported tests at or above 4 pCi/L, 2017
- Pecos CountyReported testing not yet available
- Polk County100.0% of reported tests at or above 4 pCi/L, 2017
- Rains CountyReported testing not yet available
- Reagan CountyReported testing not yet available
- Real CountyReported testing not yet available
- Red River CountyReported testing not yet available
- Refugio County0.0% of reported tests at or above 4 pCi/L, 2017
- Robertson County0.0% of reported tests at or above 4 pCi/L, 2017
- Rockwall County18.8% of reported tests at or above 4 pCi/L, 2017
- Runnels County0.0% of reported tests at or above 4 pCi/L, 2017
- Rusk County0.0% of reported tests at or above 4 pCi/L, 2017
- Sabine CountyReported testing not yet available
- San Augustine CountyReported testing not yet available
- San Jacinto County33.3% of reported tests at or above 4 pCi/L, 2017
- San Patricio County0.0% of reported tests at or above 4 pCi/L, 2016
- San Saba CountyReported testing not yet available
- Schleicher CountyReported testing not yet available
- Scurry County100.0% of reported tests at or above 4 pCi/L, 2017
- Shackelford County0.0% of reported tests at or above 4 pCi/L, 2017
- Shelby CountyReported testing not yet available
- Smith County5.8% of reported tests at or above 4 pCi/L, 2017
- Somervell CountyReported testing not yet available
- Starr County0.0% of reported tests at or above 4 pCi/L, 2017
- Stephens County100.0% of reported tests at or above 4 pCi/L, 2017
- Sterling CountyReported testing not yet available
- Stonewall CountyReported testing not yet available
- Sutton CountyReported testing not yet available
- Tarrant County13.0% of reported tests at or above 4 pCi/L, 2017
- Taylor County7.1% of reported tests at or above 4 pCi/L, 2017
- Terry County0.0% of reported tests at or above 4 pCi/L, 2015
- Throckmorton CountyReported testing not yet available
- Titus County0.0% of reported tests at or above 4 pCi/L, 2016
- Tom Green County33.3% of reported tests at or above 4 pCi/L, 2017
- Travis County9.2% of reported tests at or above 4 pCi/L, 2017
- Trinity CountyReported testing not yet available
- Tyler CountyReported testing not yet available
- Upshur County0.0% of reported tests at or above 4 pCi/L, 2017
- Upton CountyReported testing not yet available
- Uvalde CountyReported testing not yet available
- Val Verde CountyReported testing not yet available
- Van Zandt County0.0% of reported tests at or above 4 pCi/L, 2017
- Victoria County0.0% of reported tests at or above 4 pCi/L, 2017
- Walker County0.0% of reported tests at or above 4 pCi/L, 2017
- Waller County0.0% of reported tests at or above 4 pCi/L, 2017
- Ward CountyReported testing not yet available
- Washington CountyReported testing not yet available
- Webb County0.0% of reported tests at or above 4 pCi/L, 2017
- Wharton County0.0% of reported tests at or above 4 pCi/L, 2017
- Wheeler County0.0% of reported tests at or above 4 pCi/L, 2017
- Wichita County0.0% of reported tests at or above 4 pCi/L, 2017
- Wilbarger County0.0% of reported tests at or above 4 pCi/L, 2017
- Willacy CountyReported testing not yet available
- Williamson County1.9% of reported tests at or above 4 pCi/L, 2017
- Wilson County0.0% of reported tests at or above 4 pCi/L, 2017
- Winkler CountyReported testing not yet available
- Wise County0.0% of reported tests at or above 4 pCi/L, 2017
- Wood CountyReported testing not yet available
- Yoakum County0.0% of reported tests at or above 4 pCi/L, 2017
- Young CountyReported testing not yet available
- Zapata County0.0% of reported tests at or above 4 pCi/L, 2017
- Zavala CountyReported testing not yet available
Texas, Local resources
Local resources in Texas
Who to ask in Texas: the state's radon program, test kits and professionals.
Texas Radon Group
Texas Tech University
Texas’s radon program answers questions about testing, mitigation and the rules where you live.
- Licensing of radon professionals
There are no radon certification requirements for the State of Texas at this time, but the National Radon Proficiency Program lists radon testers and mitigators within Texas that have passed a rigorous national certification program.
Test kits
The program says: The Texas Radon Group offers free radon test kits for Texas individuals who qualify.
Radon professionals
3 professionals are listed in Texas.
Professionals in TexasTexas, Questions
Questions about radon in Texas
Common questions8 questions, answered from the figures above
Is radon a problem in Texas?
EPA's Map of Radon Zones places 0 of the 254 Texas counties it classifies in Zone 1, the highest predicted potential, 39 in Zone 2 and 215 in Zone 3. An EPA radon zone describes predicted potential across a whole county. It is not intended to determine whether any individual home should be tested, and homes with elevated levels occur in all three zones. EPA recommends testing every home regardless of zone, and testing is the only way to know the radon level in a specific building.
How do I get a radon test in Texas?
EPA says you can test your home yourself or hire a qualified radon test company, and that either approach takes only a small amount of time and effort. The Texas radon program is the place to ask about certified testers and any test kit offer it runs.
How to test a homeFree and low-cost kits by stateTexas radon program
Who does radon mitigation in Texas?
Radon411's Texas directory lists 3 certified radon companies. EPA recommends having a qualified contractor fix a home with a radon problem, because lowering high radon levels takes technical knowledge and special skills, and some states require the work to be done by a licensed or certified professional.
How radon mitigation worksWhat mitigation costsRadon professionals in Texas
Which Texas counties have the highest radon?
254 of Texas's 254 counties have an EPA radon zone published here. Radon411 will not rank counties on data it does not hold, and a zone is a prediction for an area rather than a measurement of any building.
What share of radon tests in Texas are high?
CDC has published no statewide radon testing statistics for Texas, so we cannot give a figure. Where CDC does publish one, the percentage describes radon tests reported to CDC, not homes.
Which EPA region is Texas in?
Texas is in EPA Region 6: South Central.
Do I need to test my home in Texas?
Yes, wherever you live in the state. Testing is the only way to know the radon level in a specific building. EPA recommends fixing a home when the radon level is 4 pCi/L or higher. EPA recommends considering a fix when the level is between 2 and 4 pCi/L.
Why does this page show coverage rather than one radon level for Texas?
A statewide figure averages counties with very different geology and very different numbers of reported tests, so it hides more than it shows. The county report is the level at which the EPA zone, the geologic potential and the reported testing statistics are actually published, which is why the county table above links to every one of them.
What these figures mean if you own, buy, sell or rent
The zone counts on this page describe counties across Texas. They are predictions for areas, and none of them measures your building.
- How to test a home
If you own your home
Test the lowest lived-in level; a short-term kit screens in days, a long-term kit reflects the year.
- Buying a house: radon guide
If you are buying
Ask for past results and any system's post-mitigation test, and test during the sale.
- Selling a house: radon guide
If you are selling
Testing before you list puts the timing in your hands; disclosure rules differ by state.
- Radon in rental homes
If you rent, or rent out a home
A tenant can test; a fix is the owner's to make, and duties differ by state.
How long a test has to run, under what conditions, and what EPA says a result means: the testing standard, in full.
Texas, Products
Testing and mitigation products
Whatever the figures for Texas show, only a test tells you about one home.
Testing
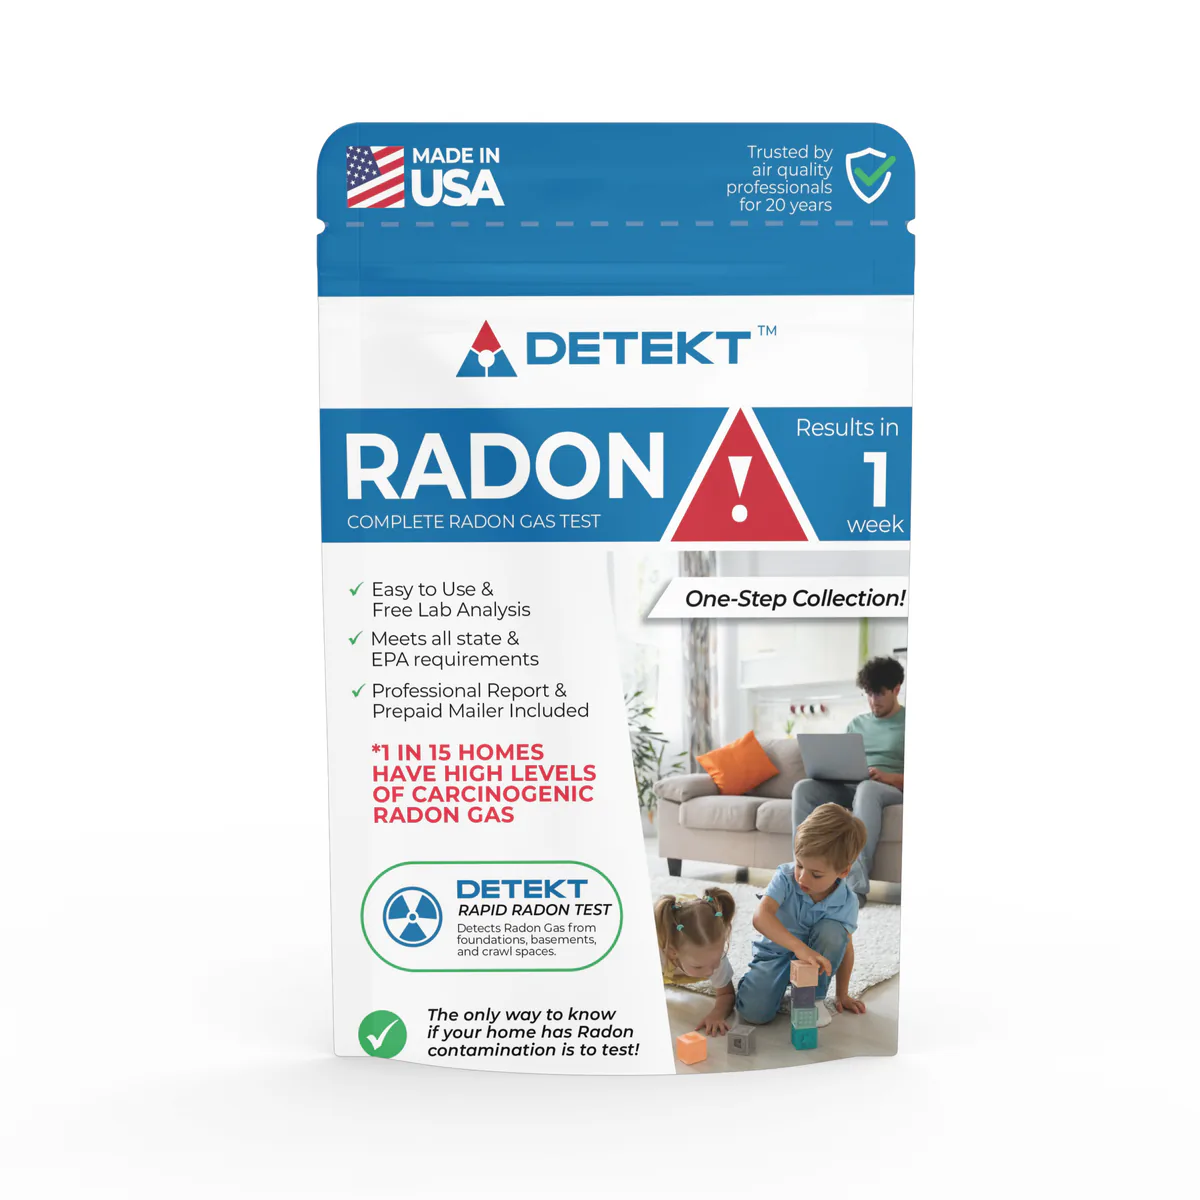
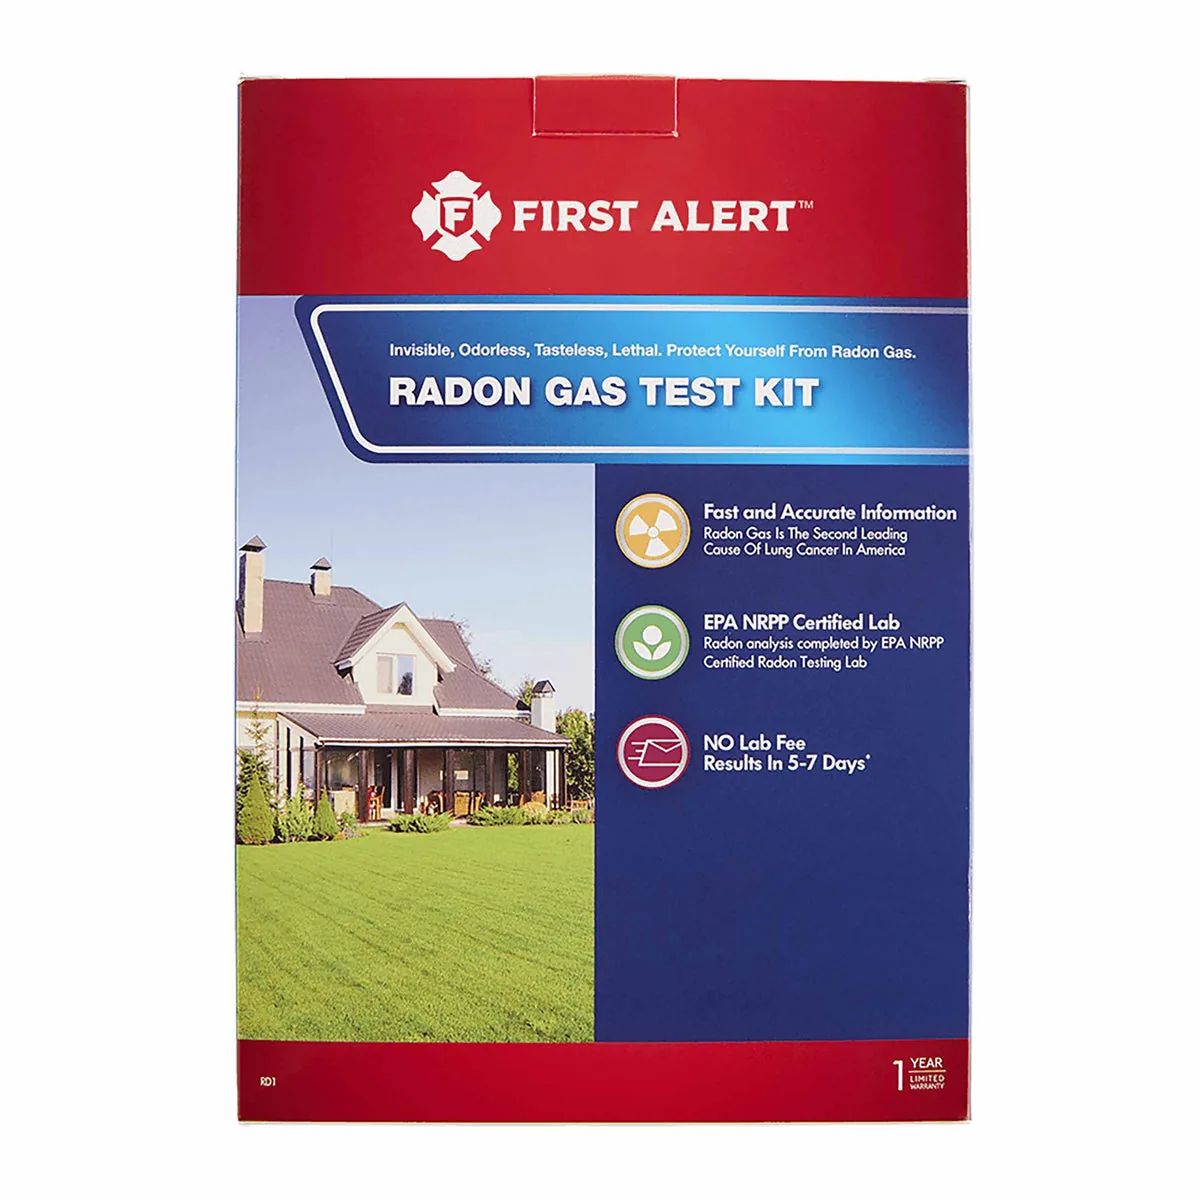
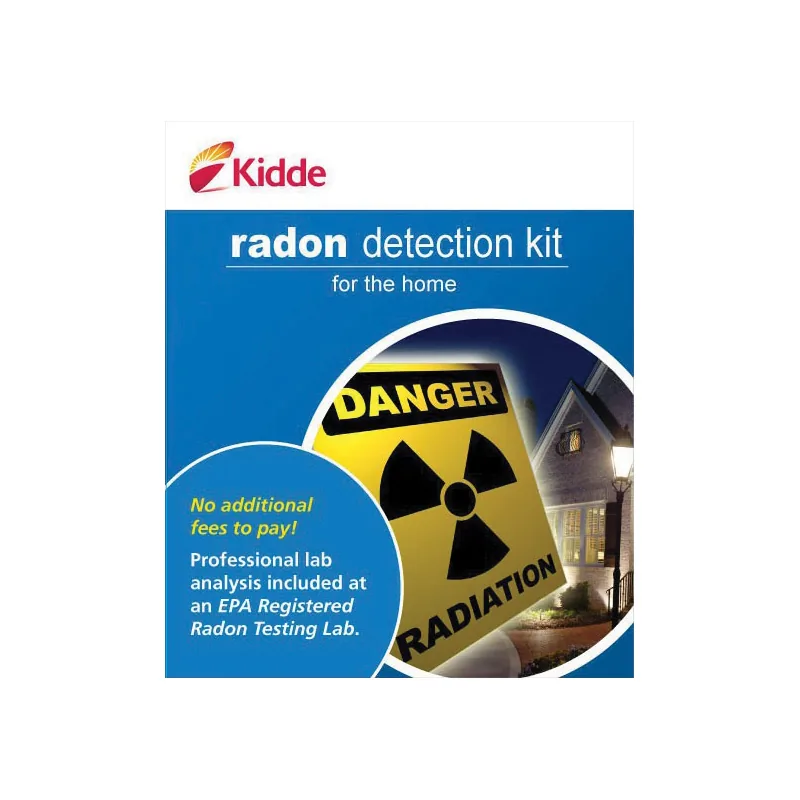
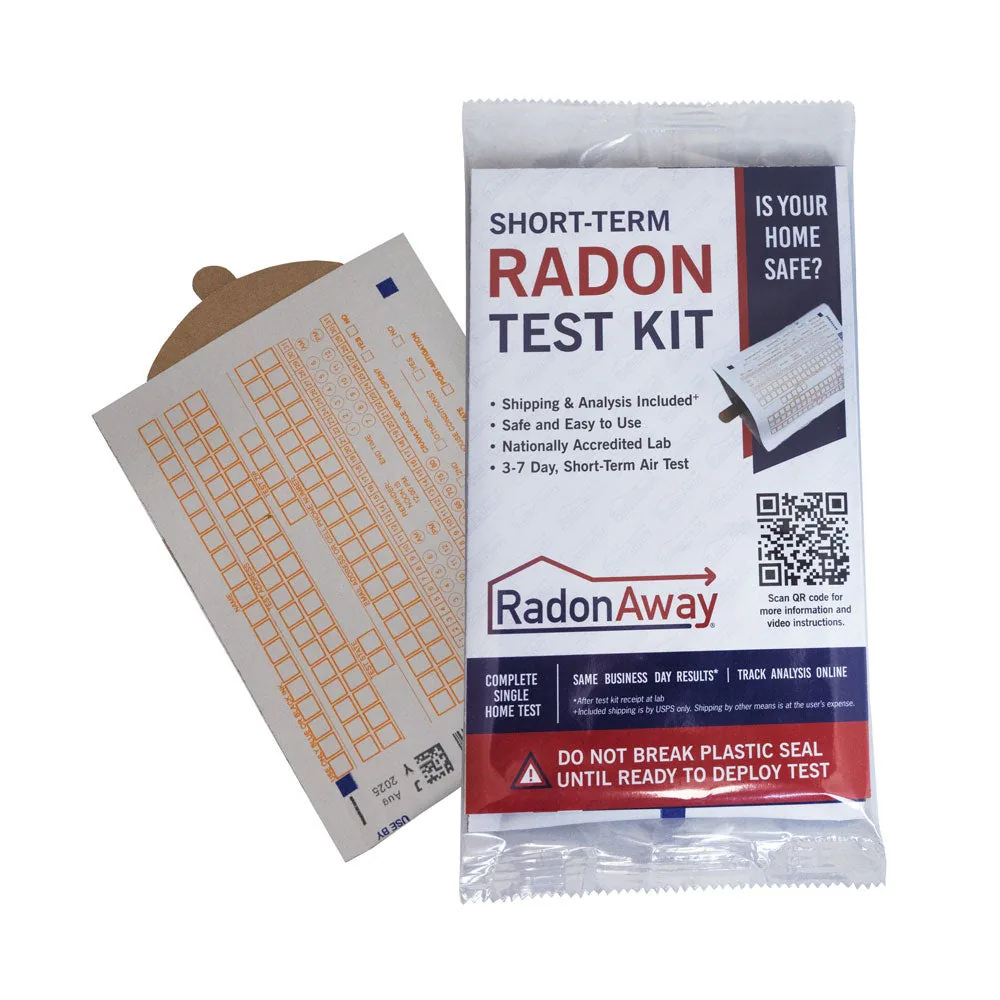
- Short-term test kitsPassive detectors exposed for a few days under closed-building conditions, then analyzed by a lab.
- Long-term test kitsDetectors exposed for more than 90 days, for a closer picture of the annual average.
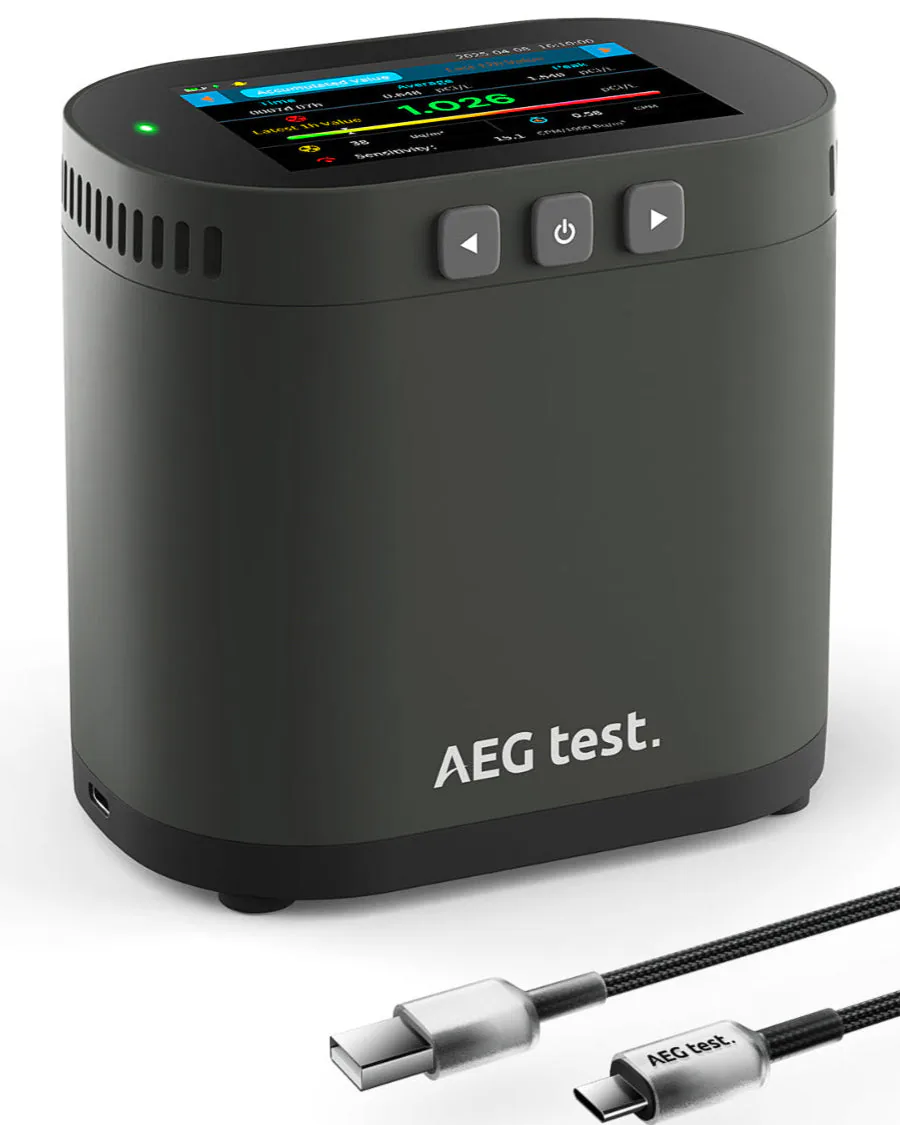
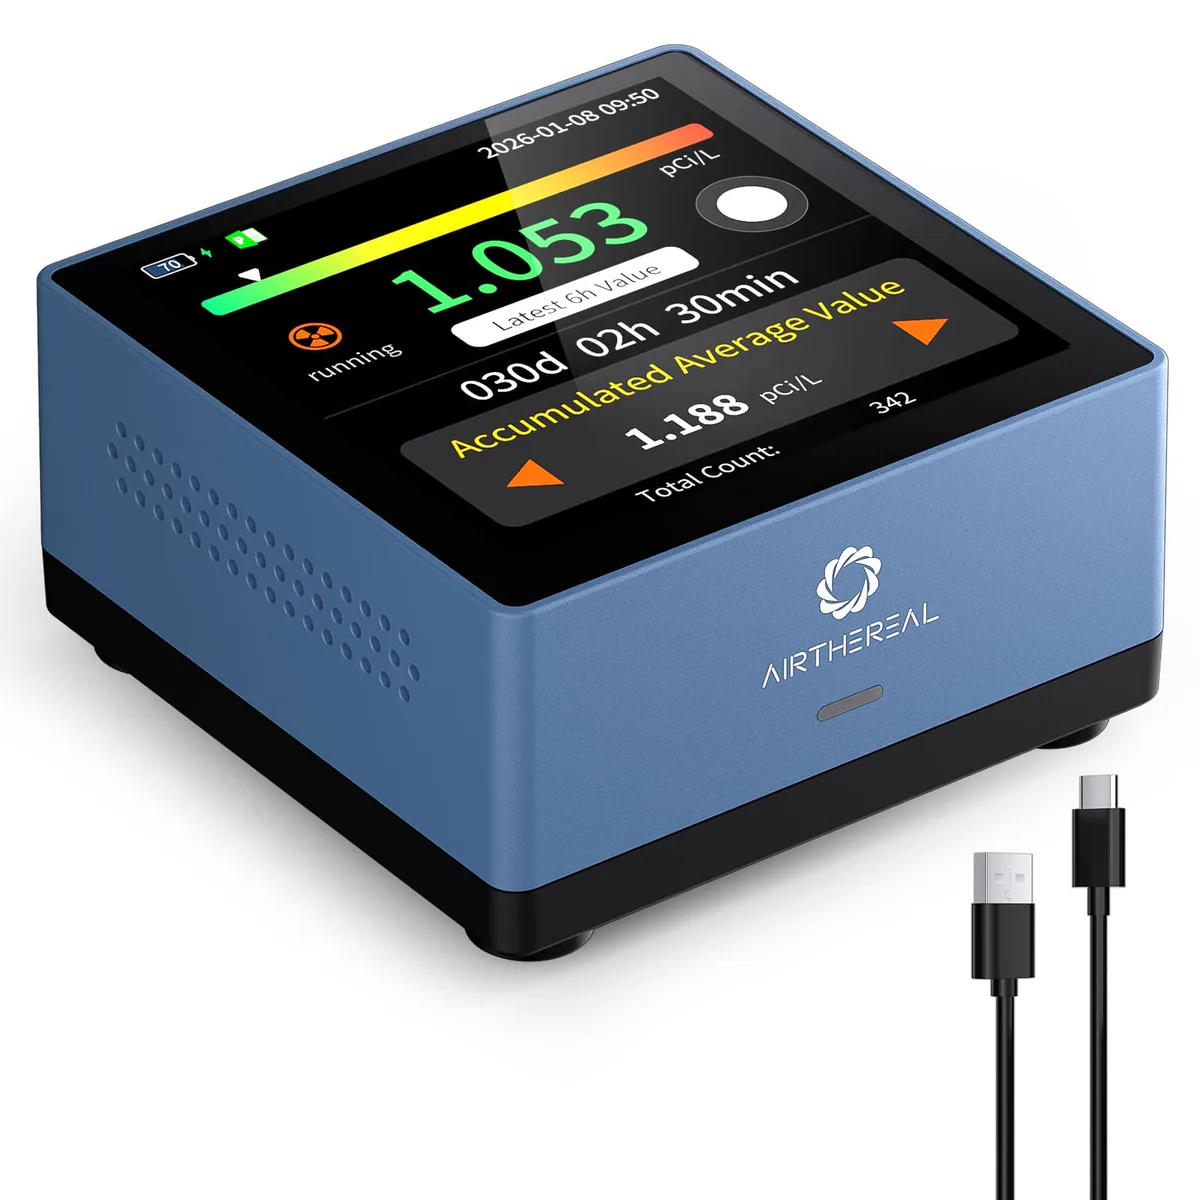
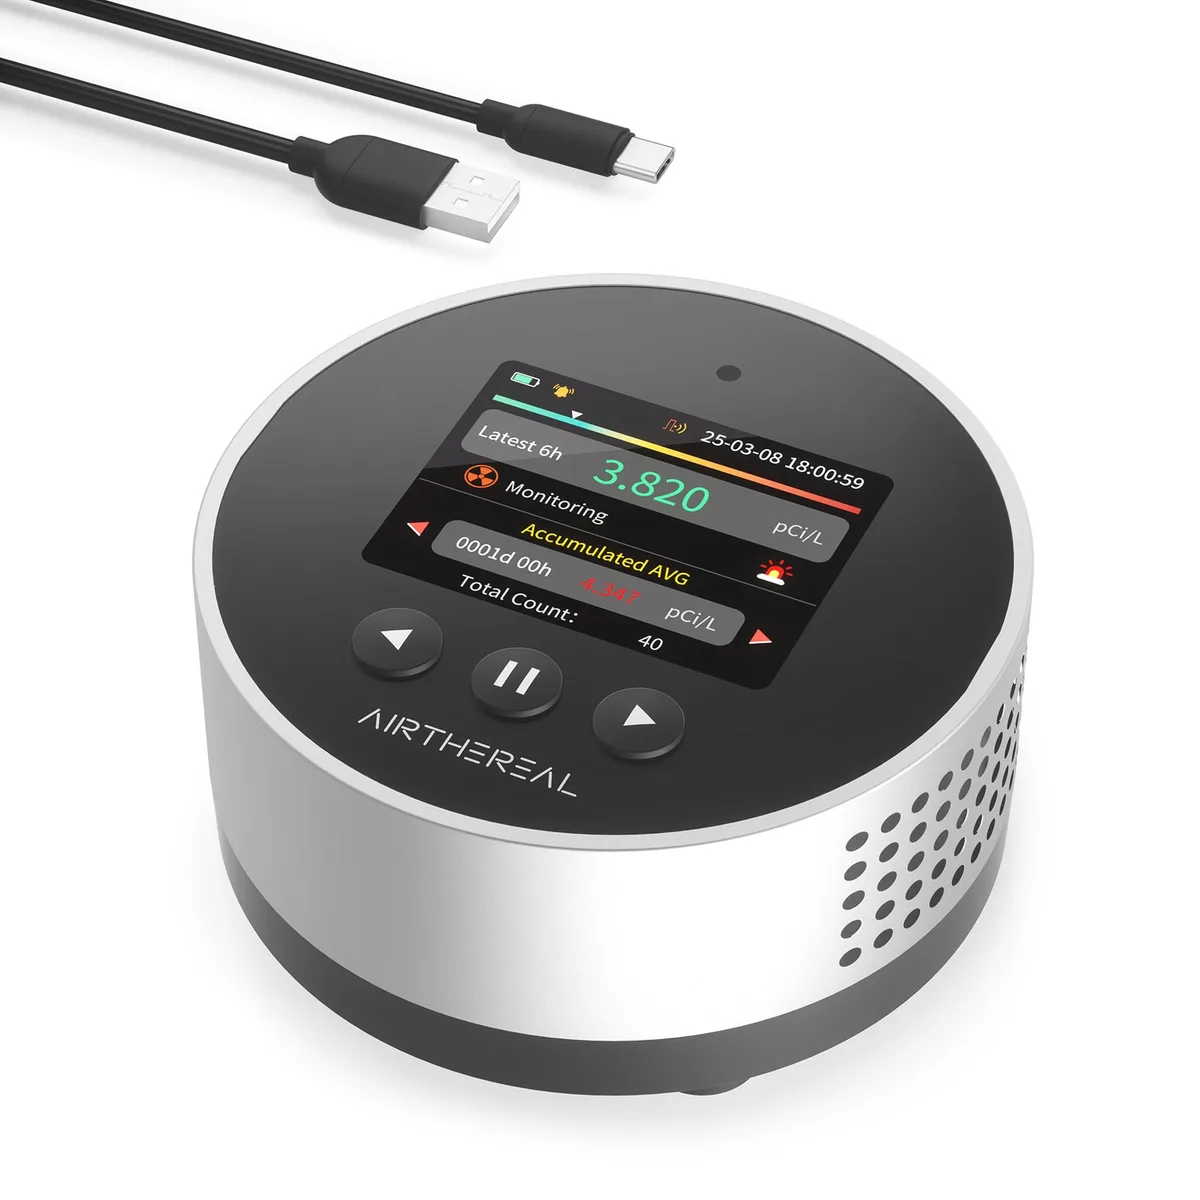
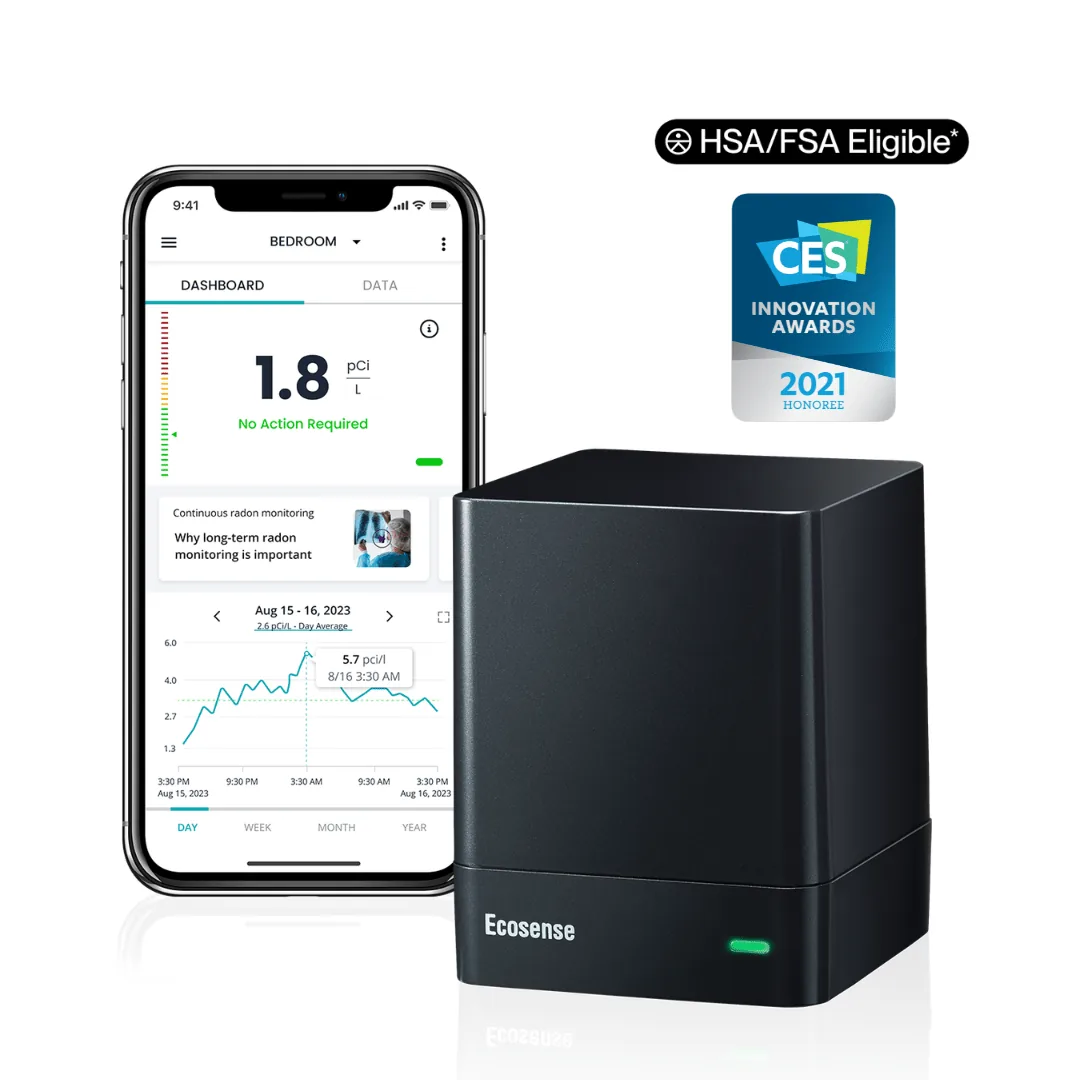
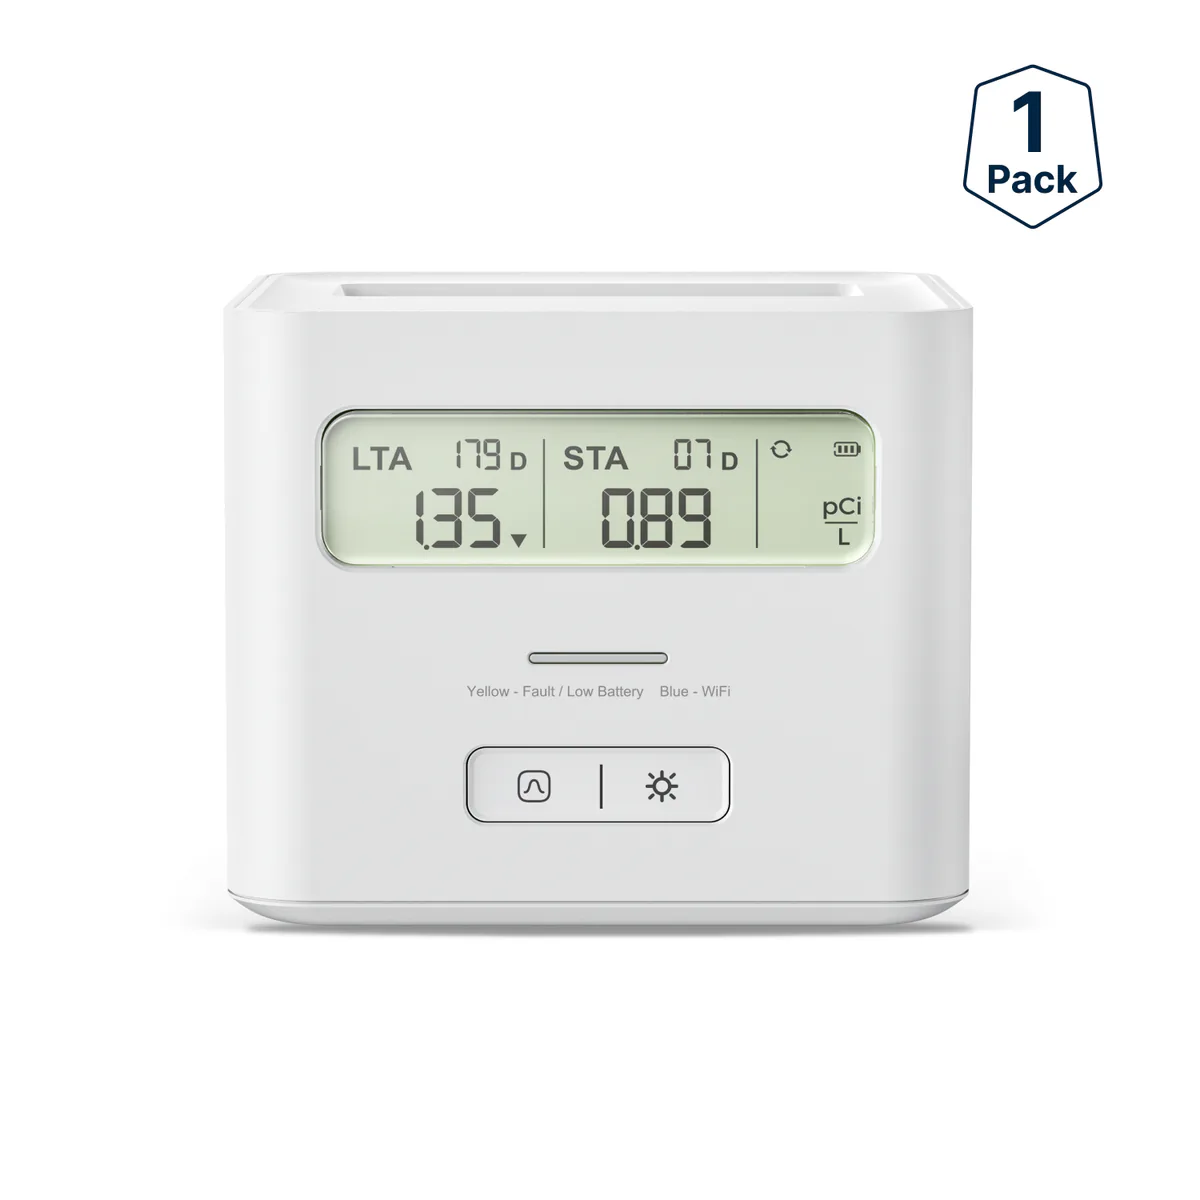
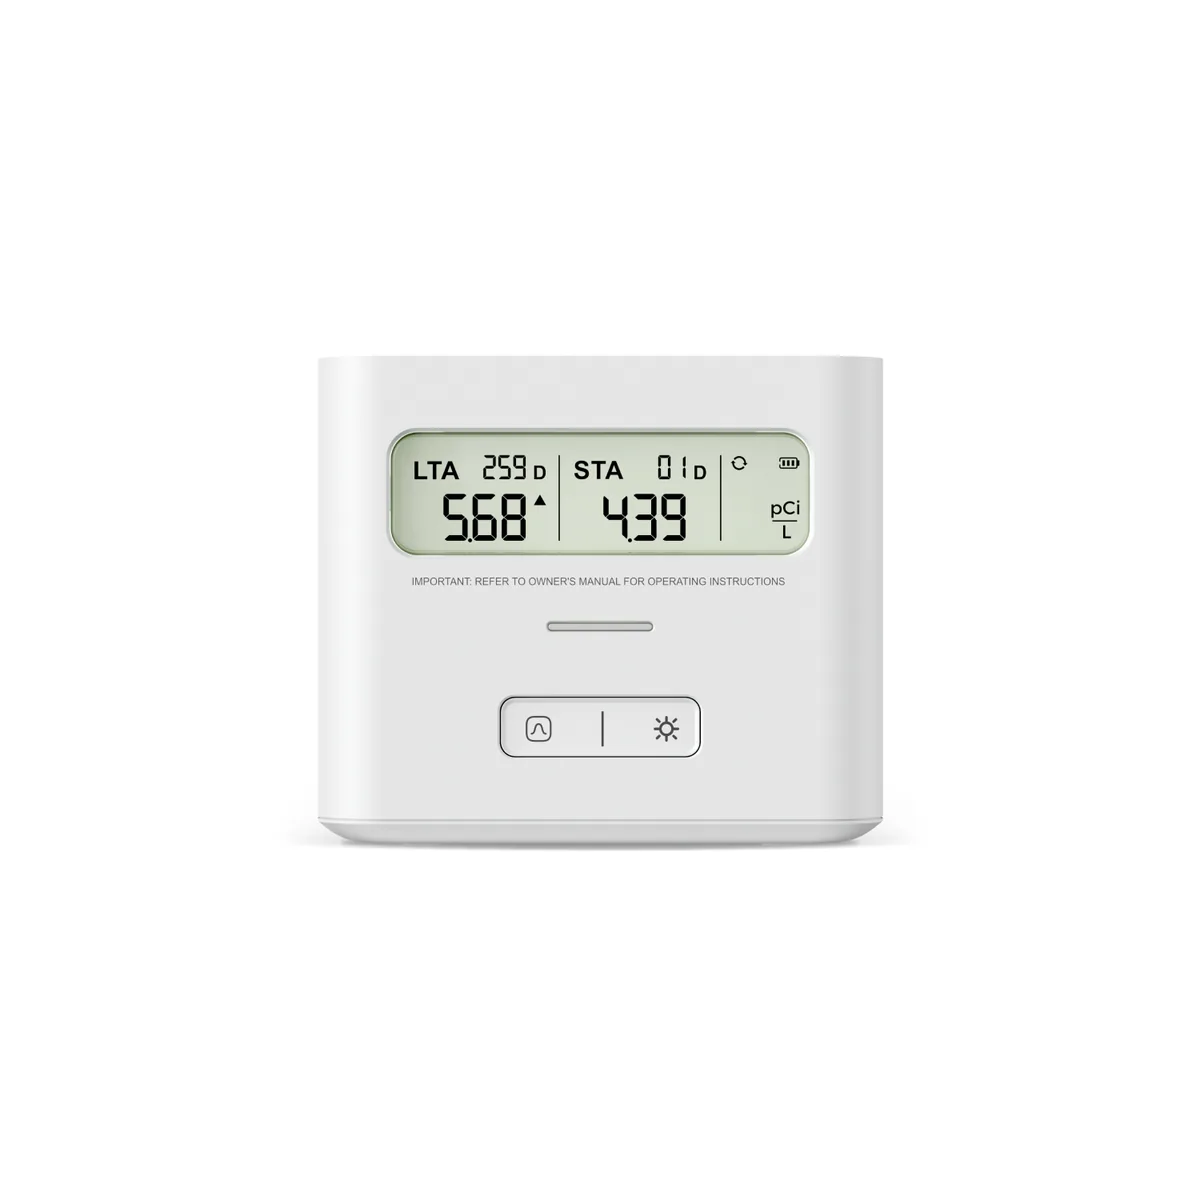
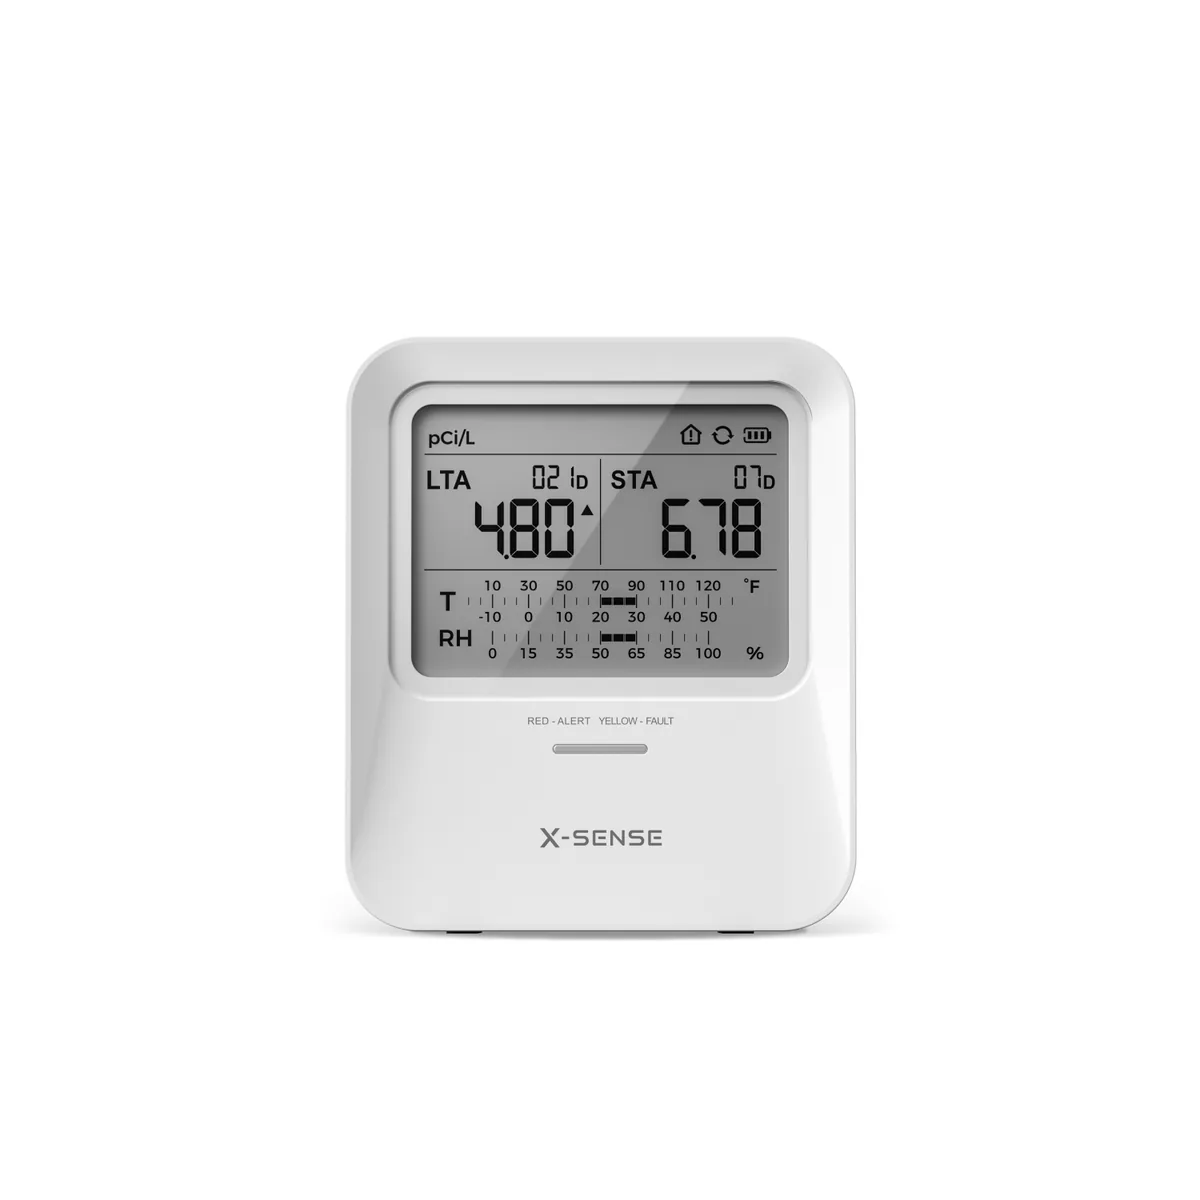
- Continuous monitorsPowered devices that log radon on a repeating cycle, often used for transaction tests.
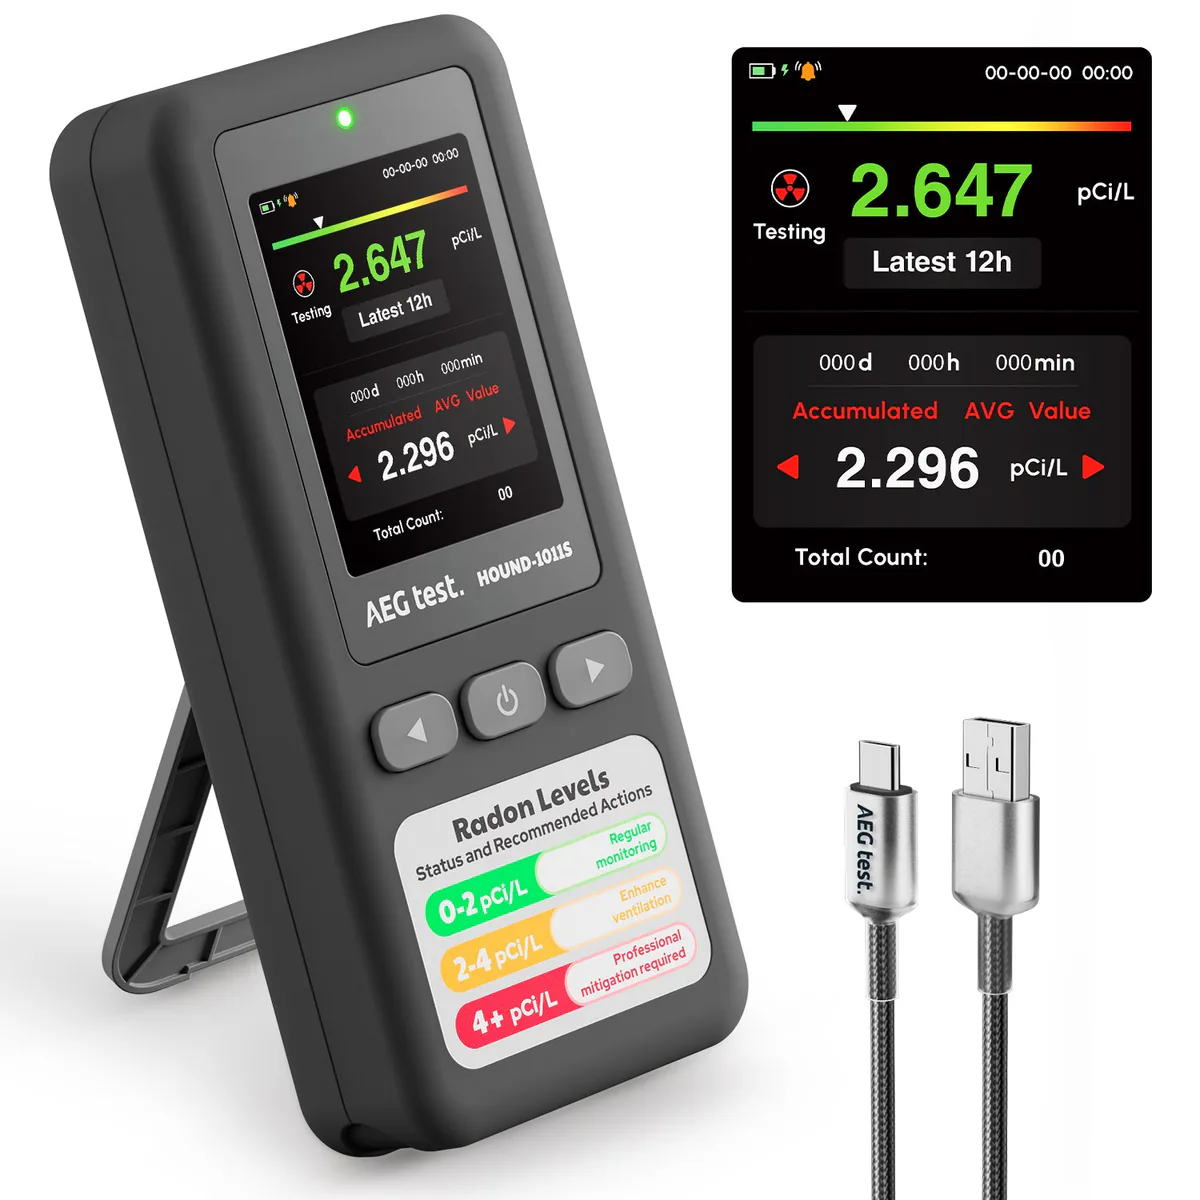
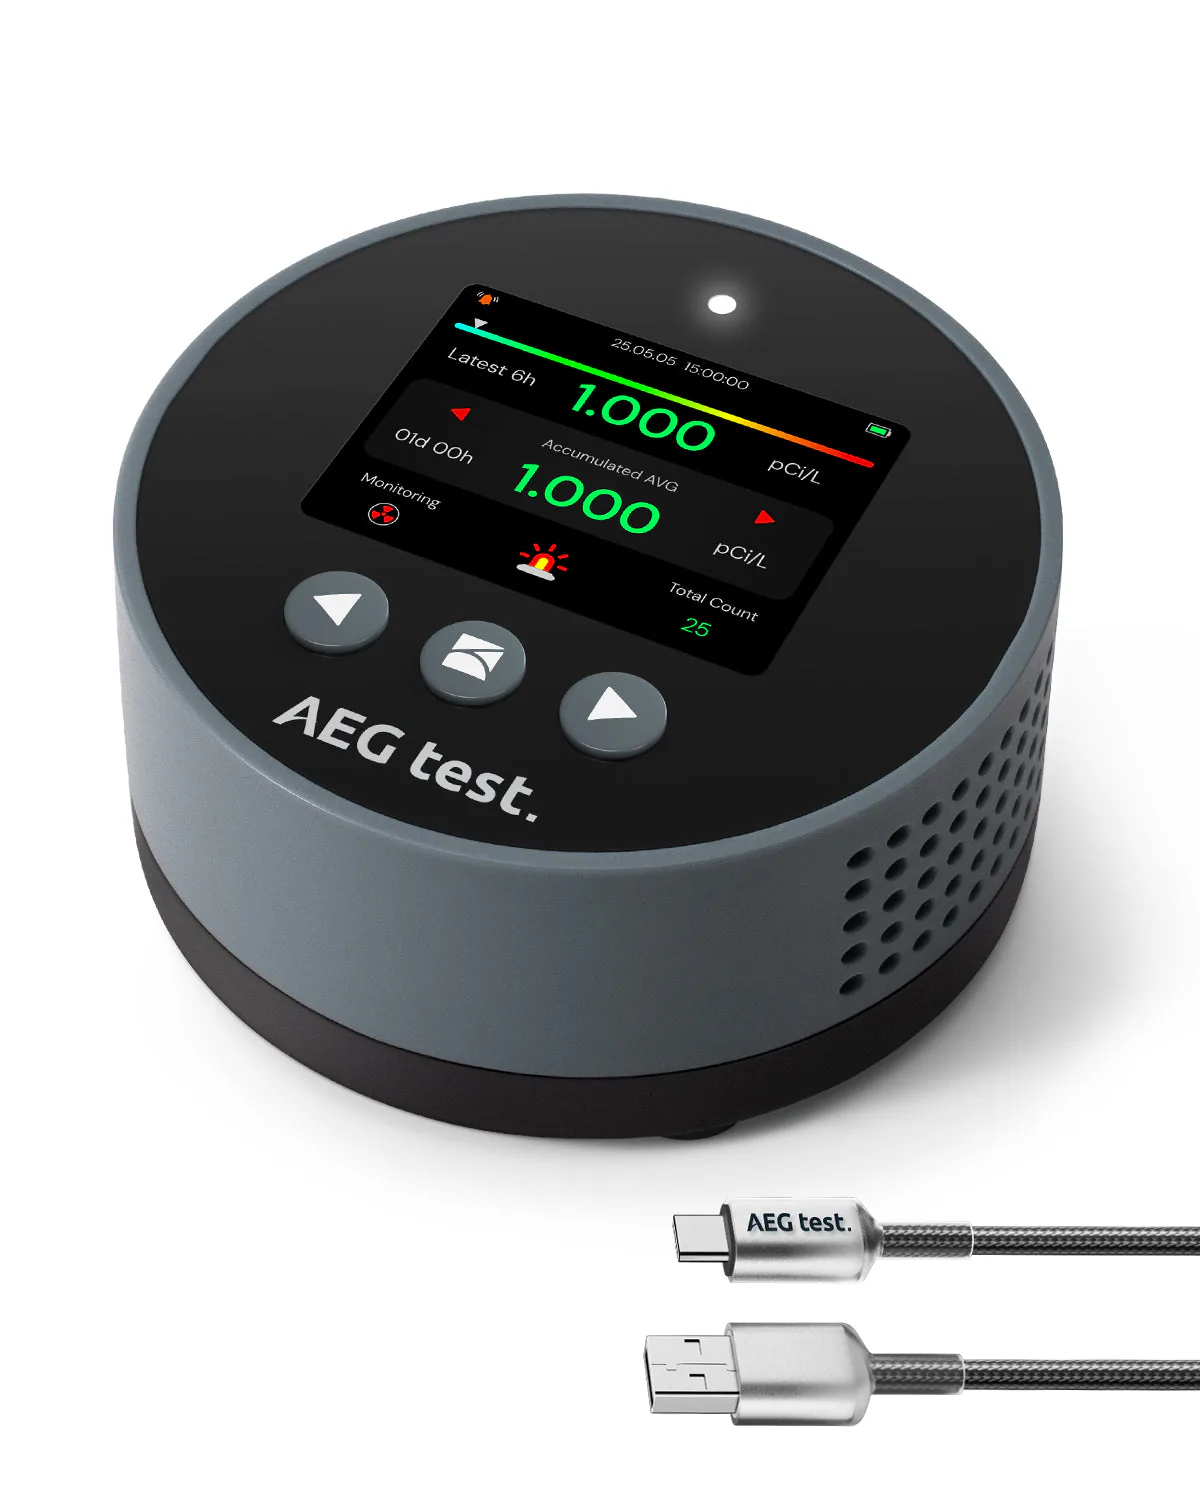
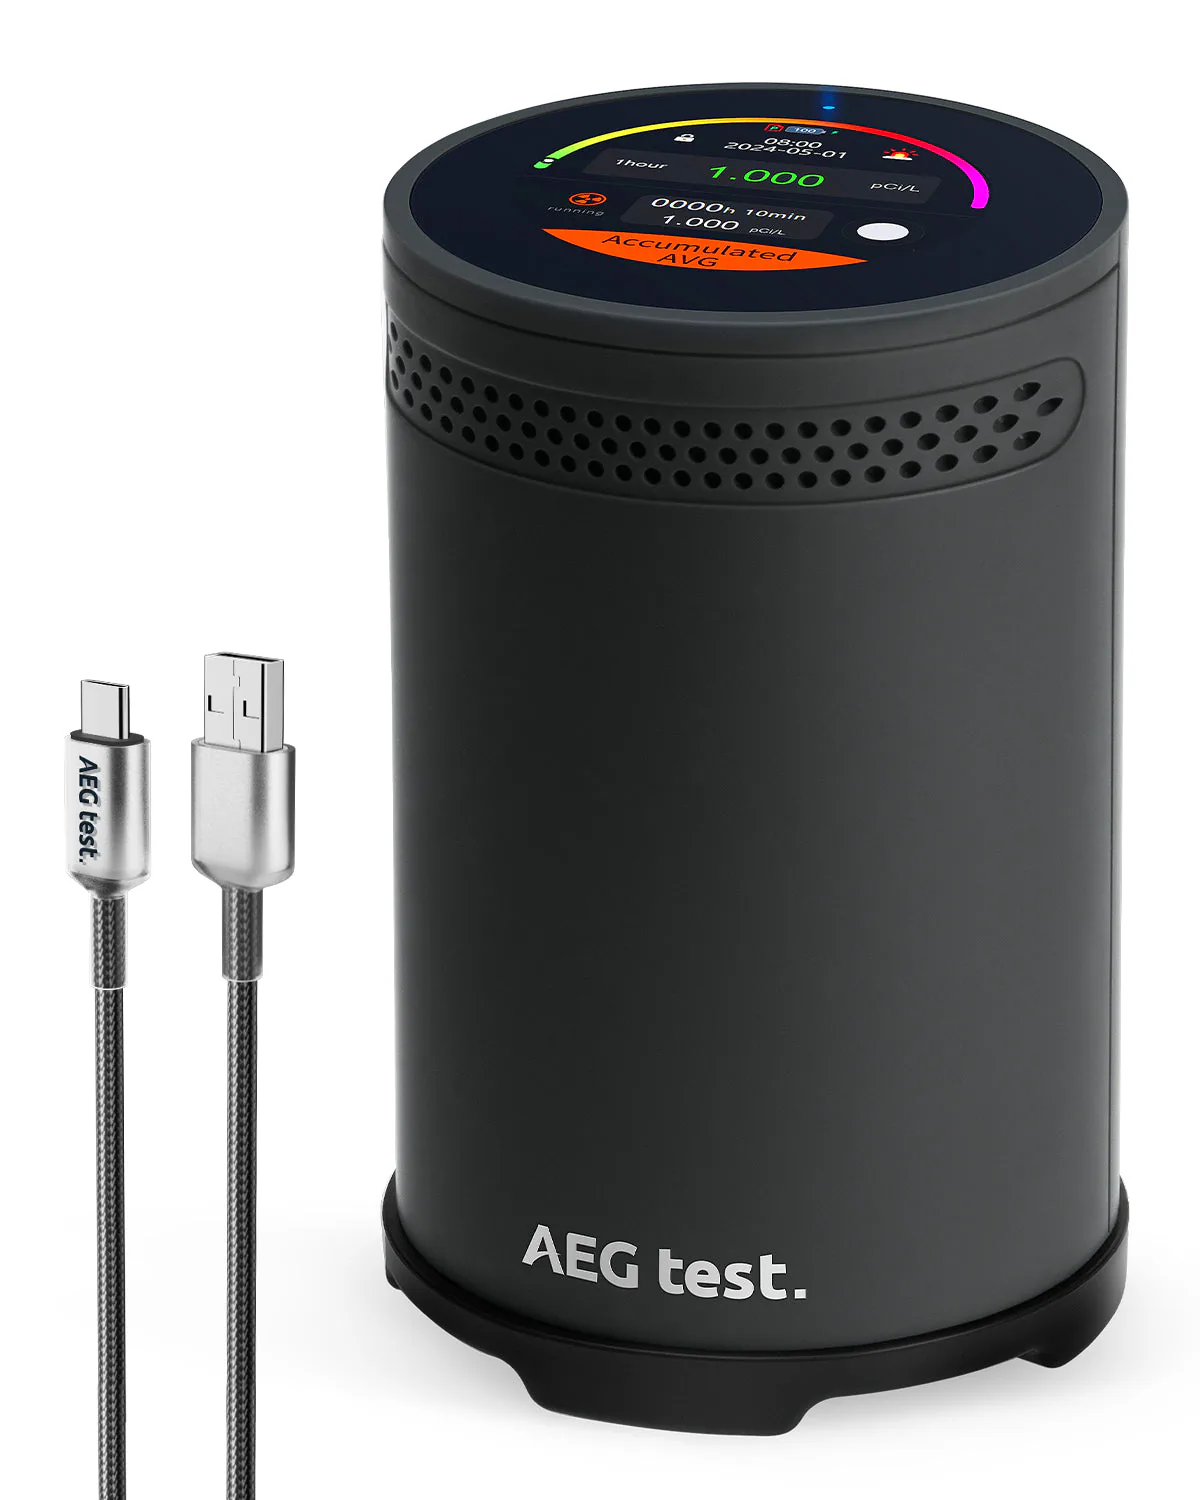
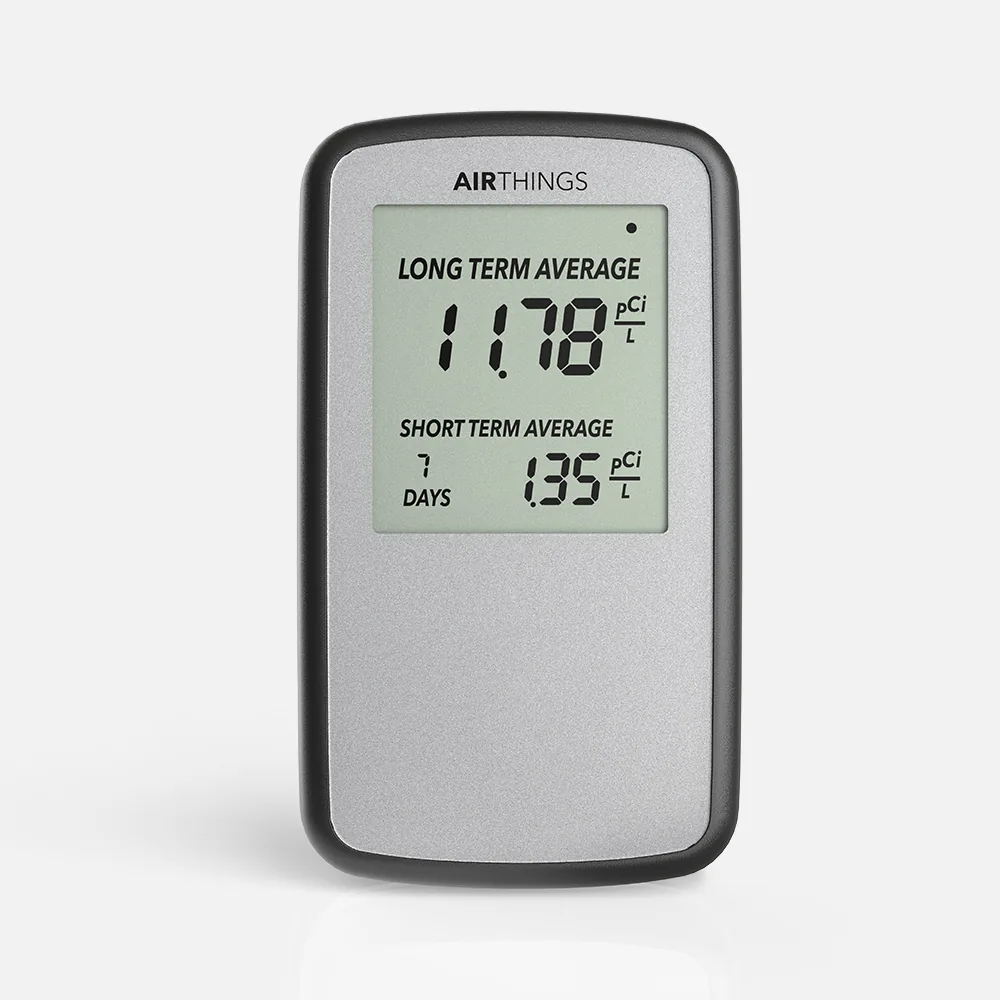
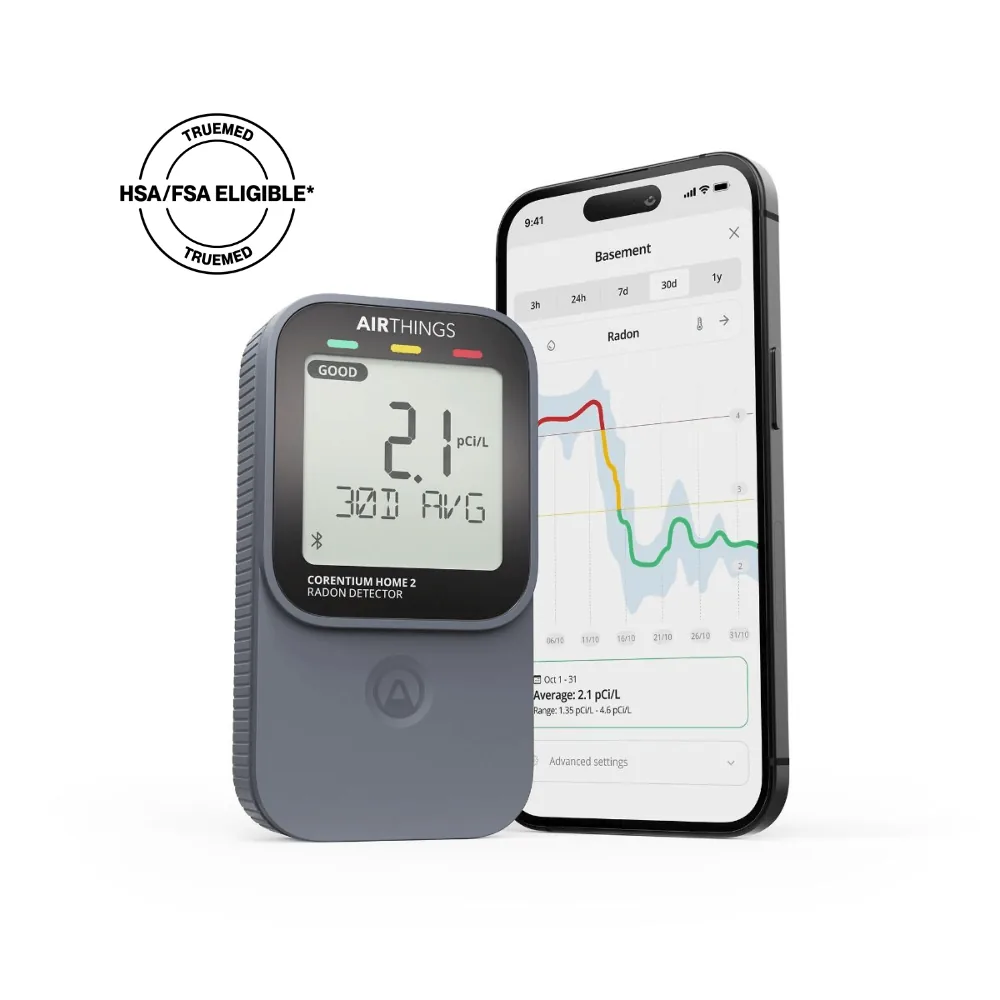
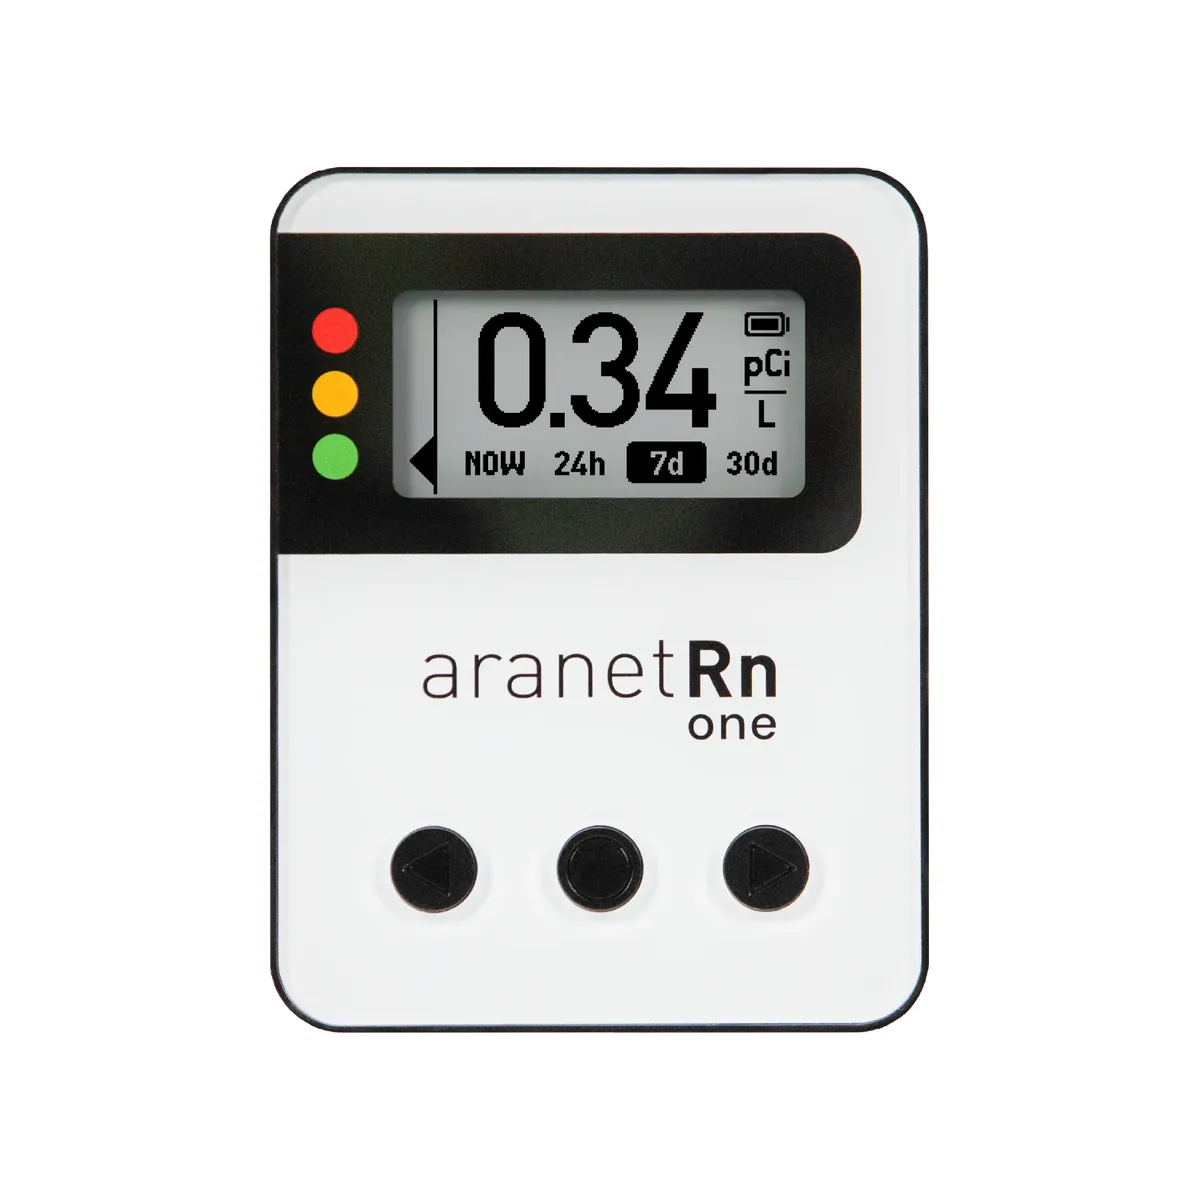
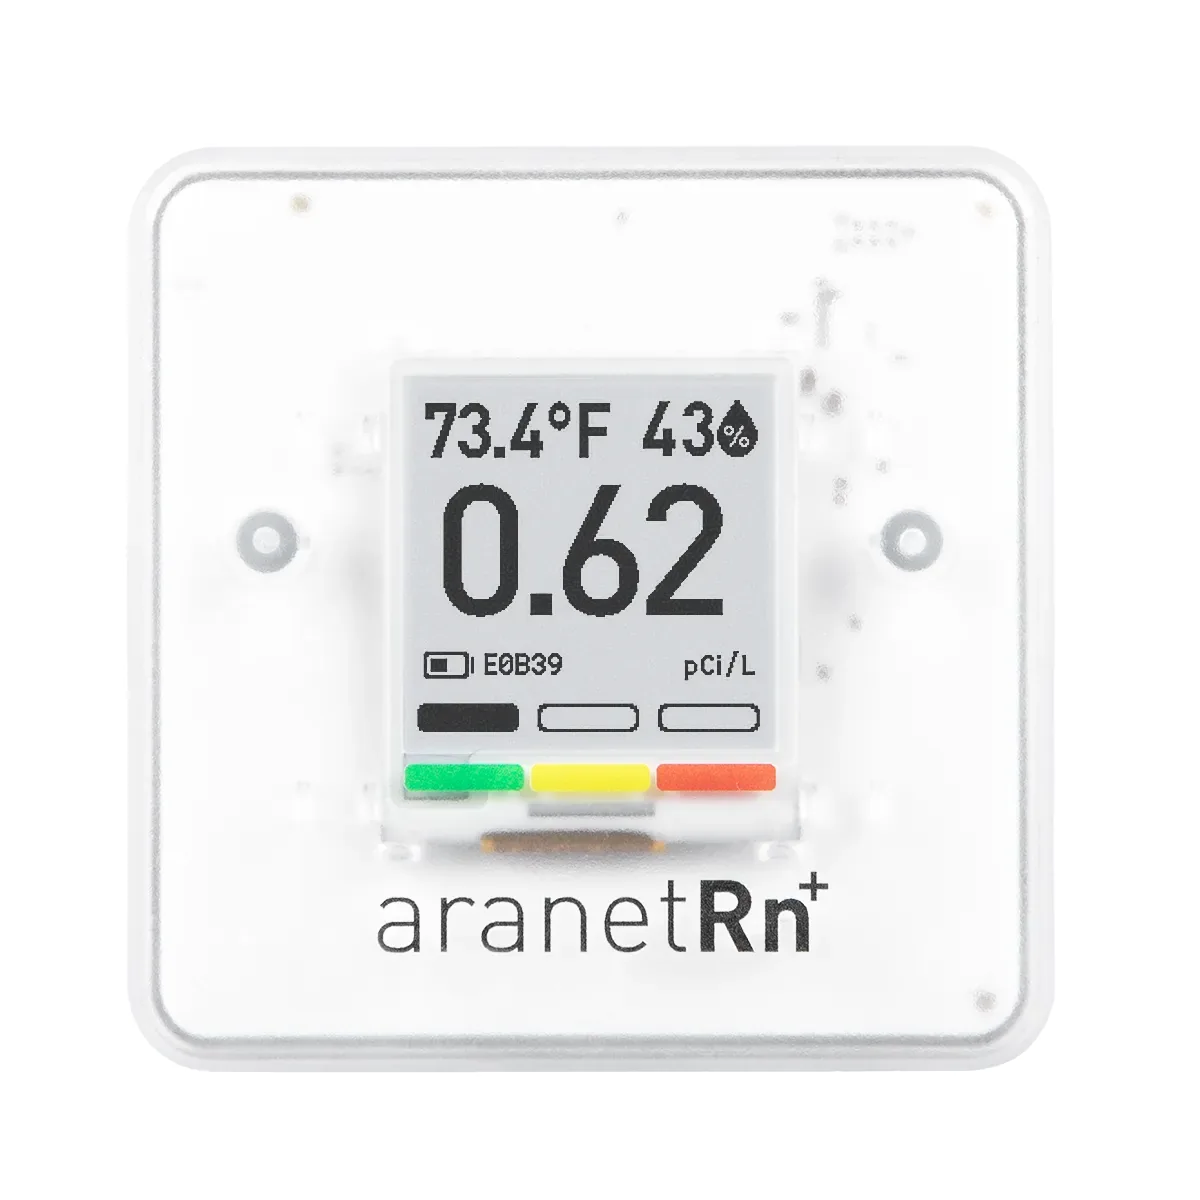
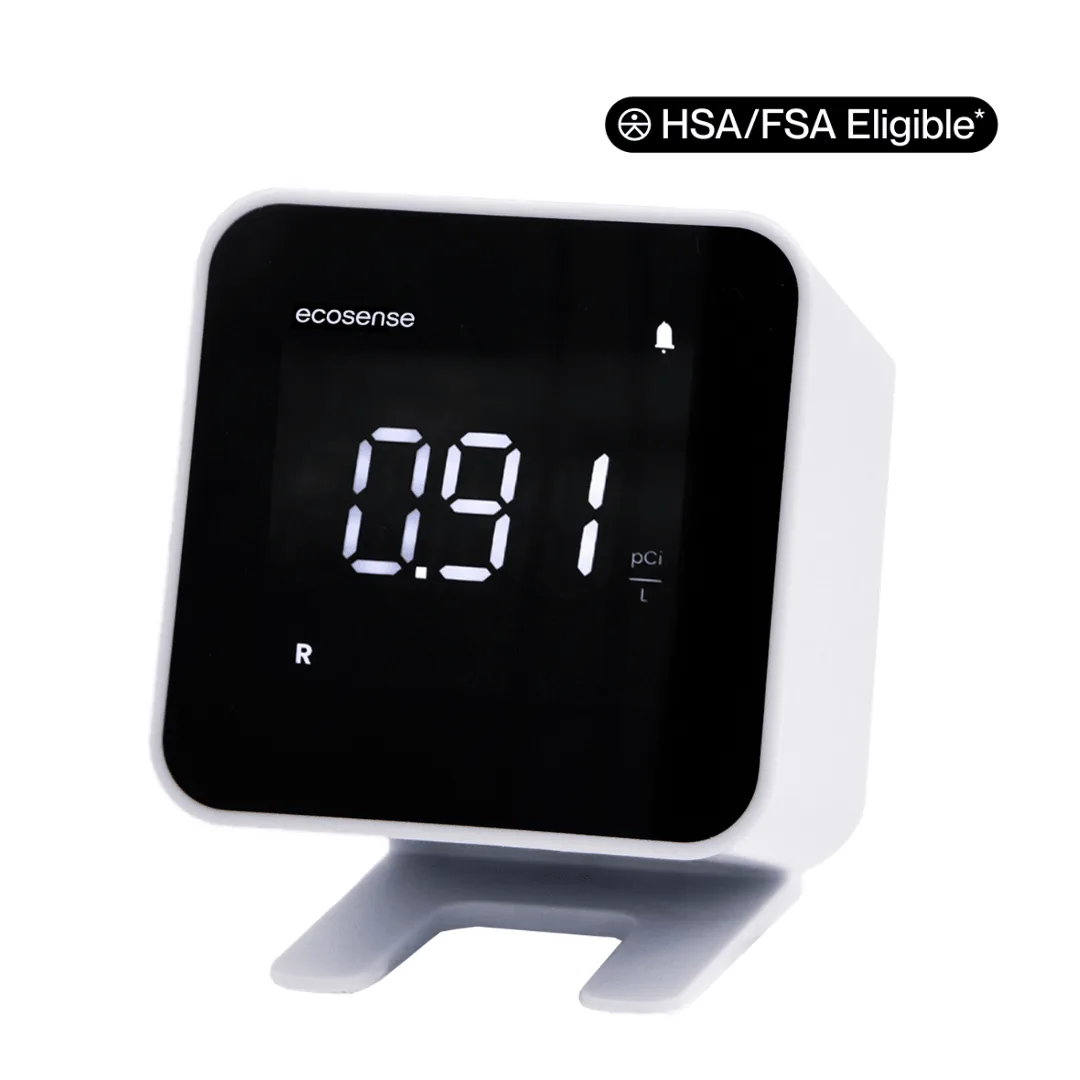
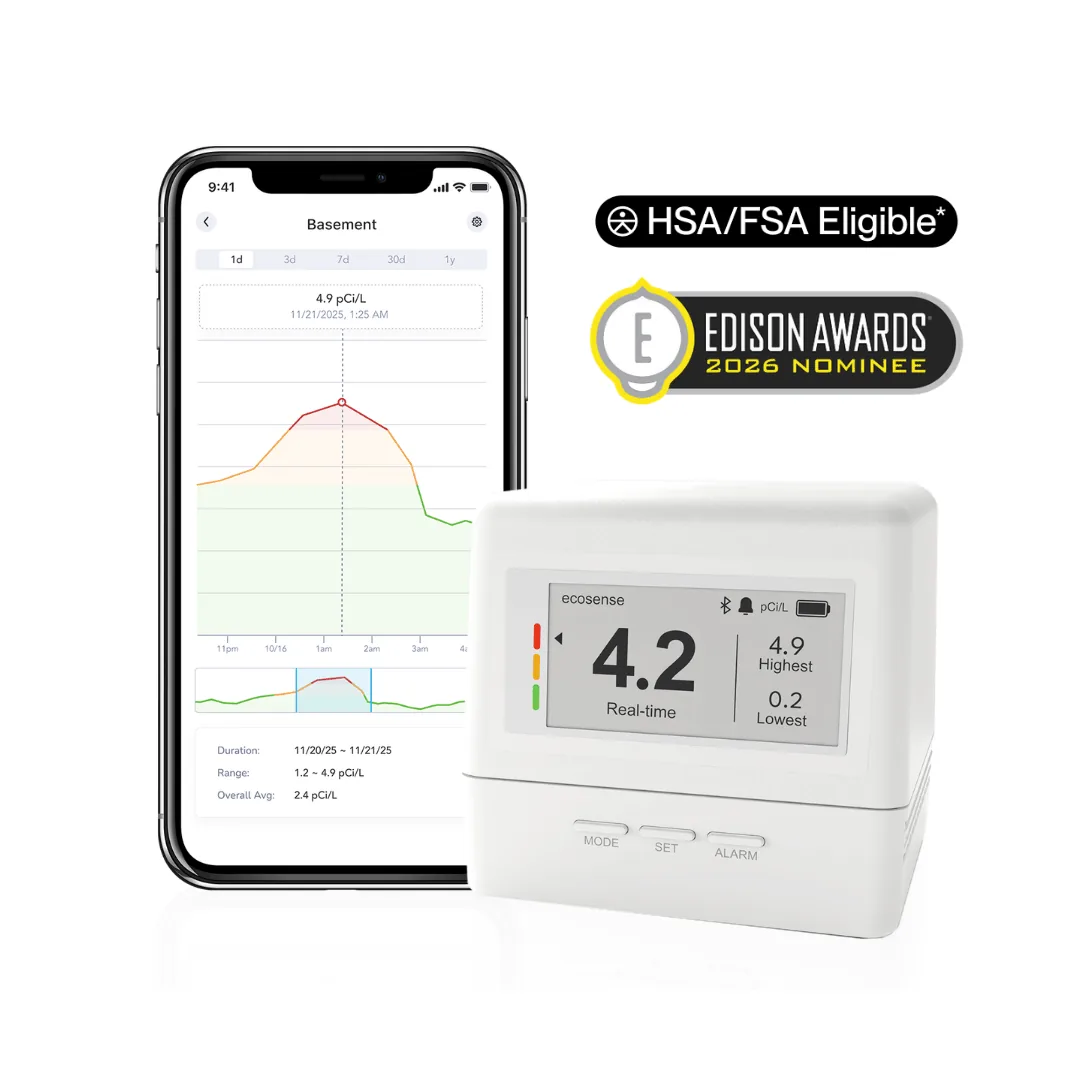
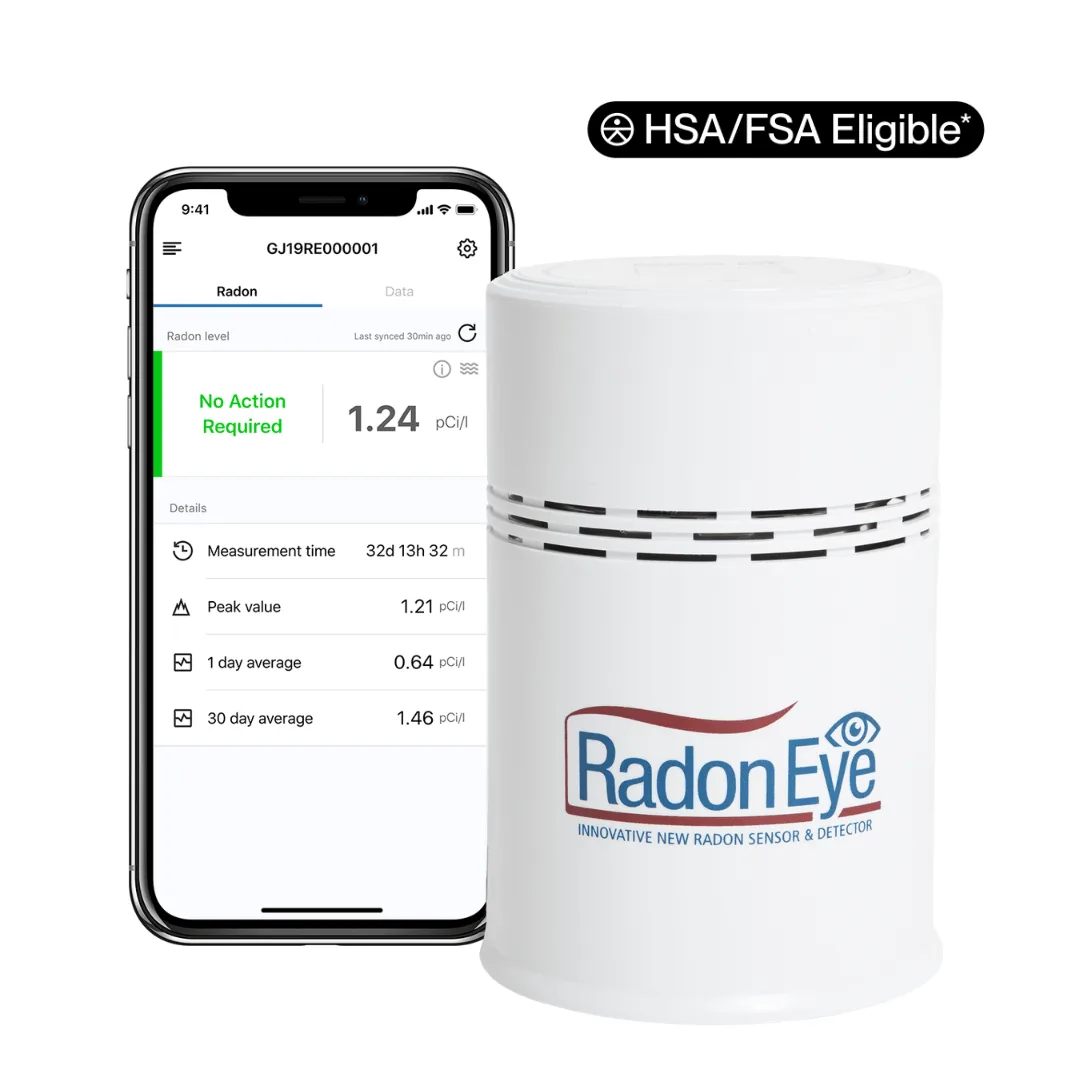
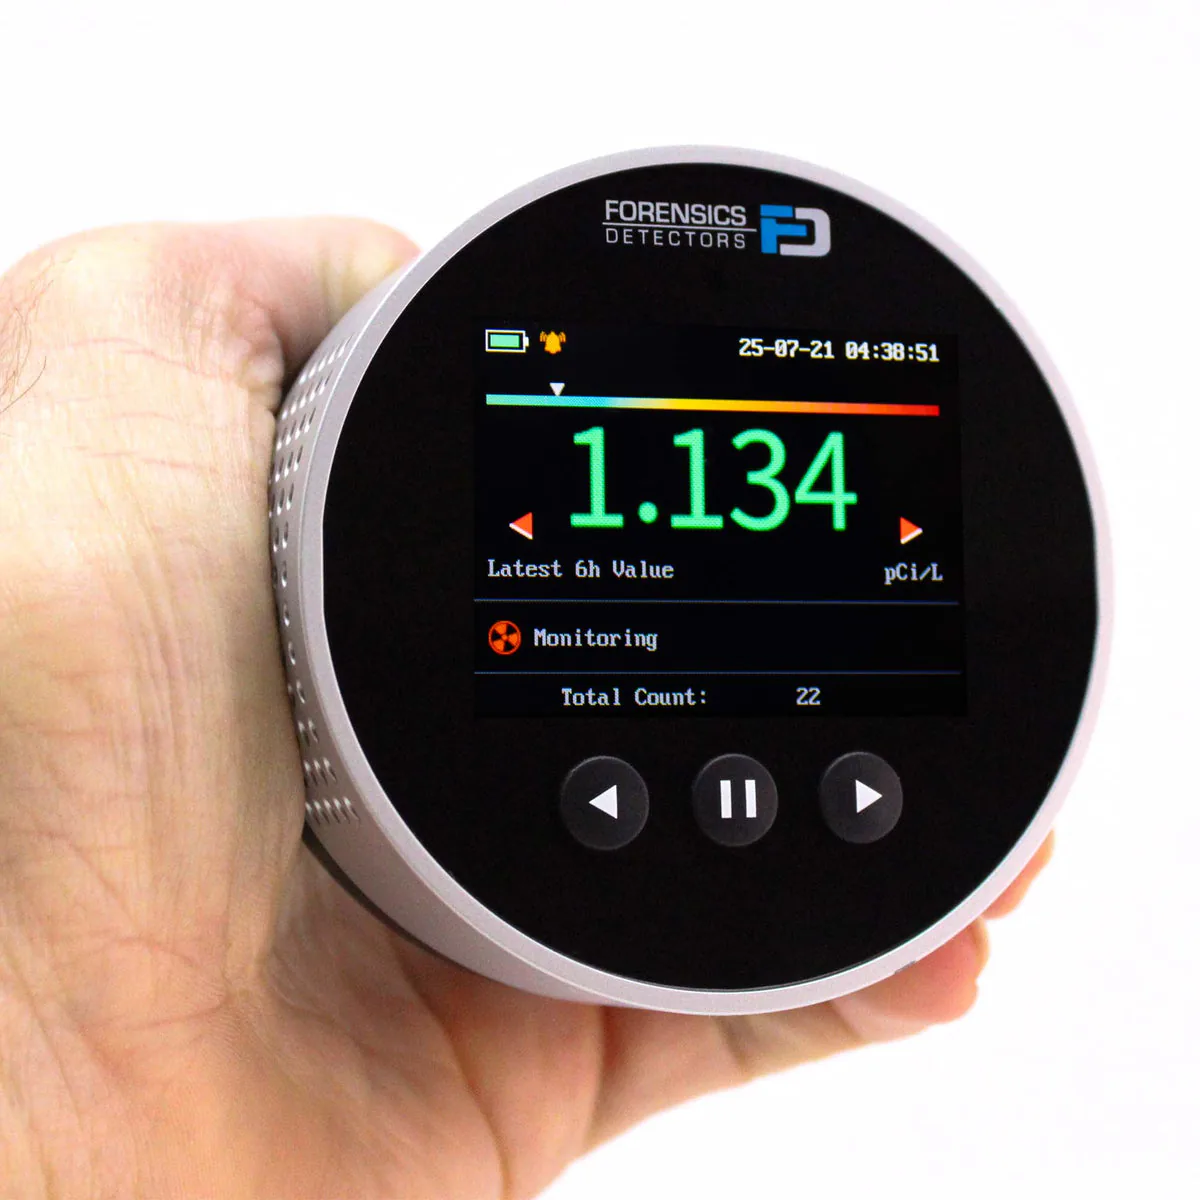
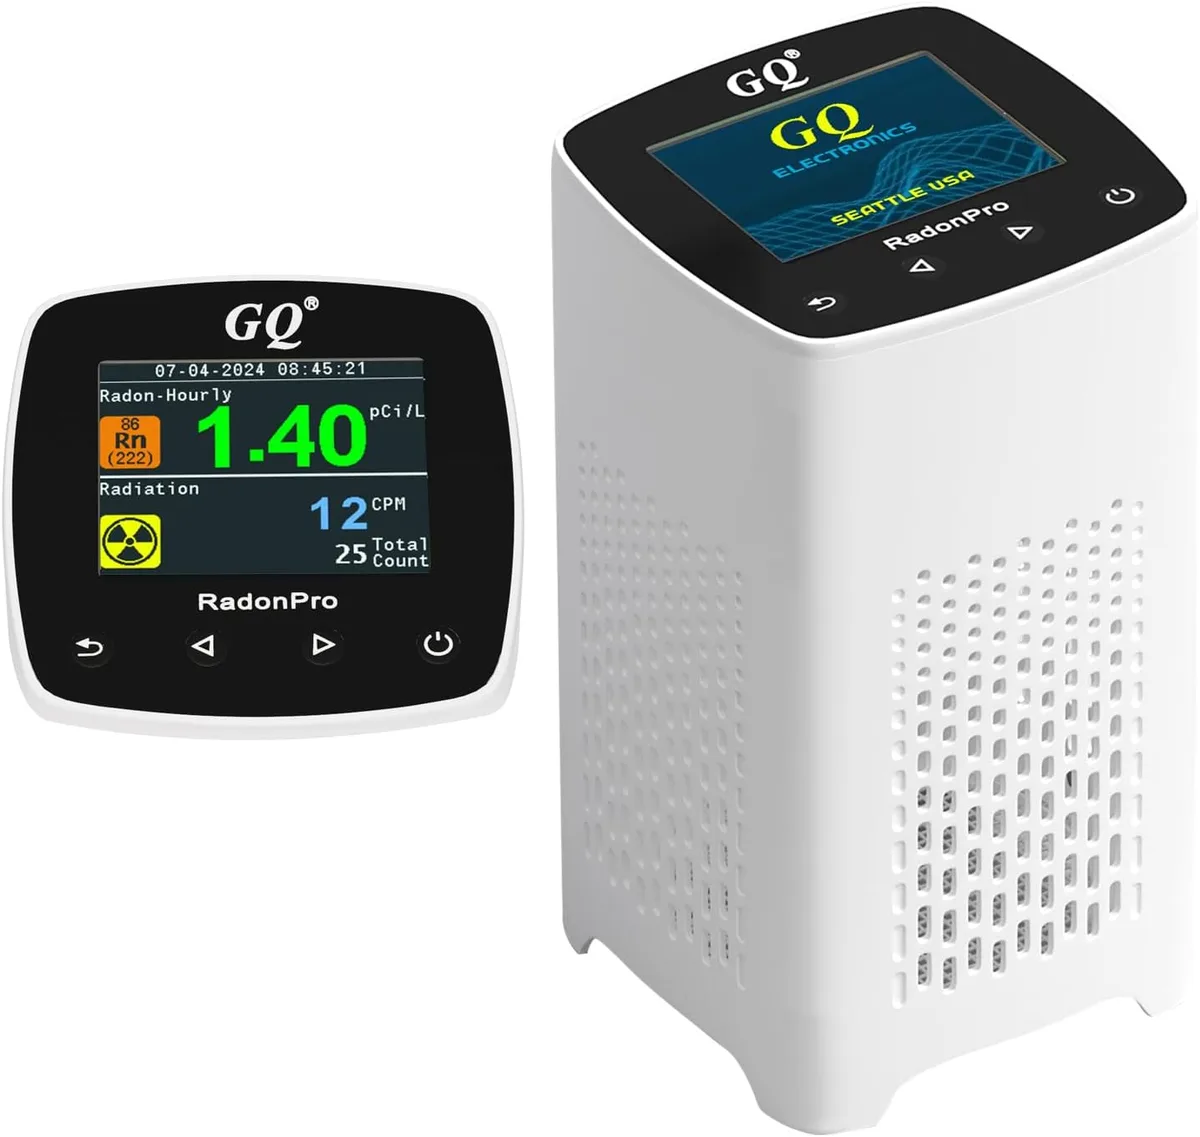
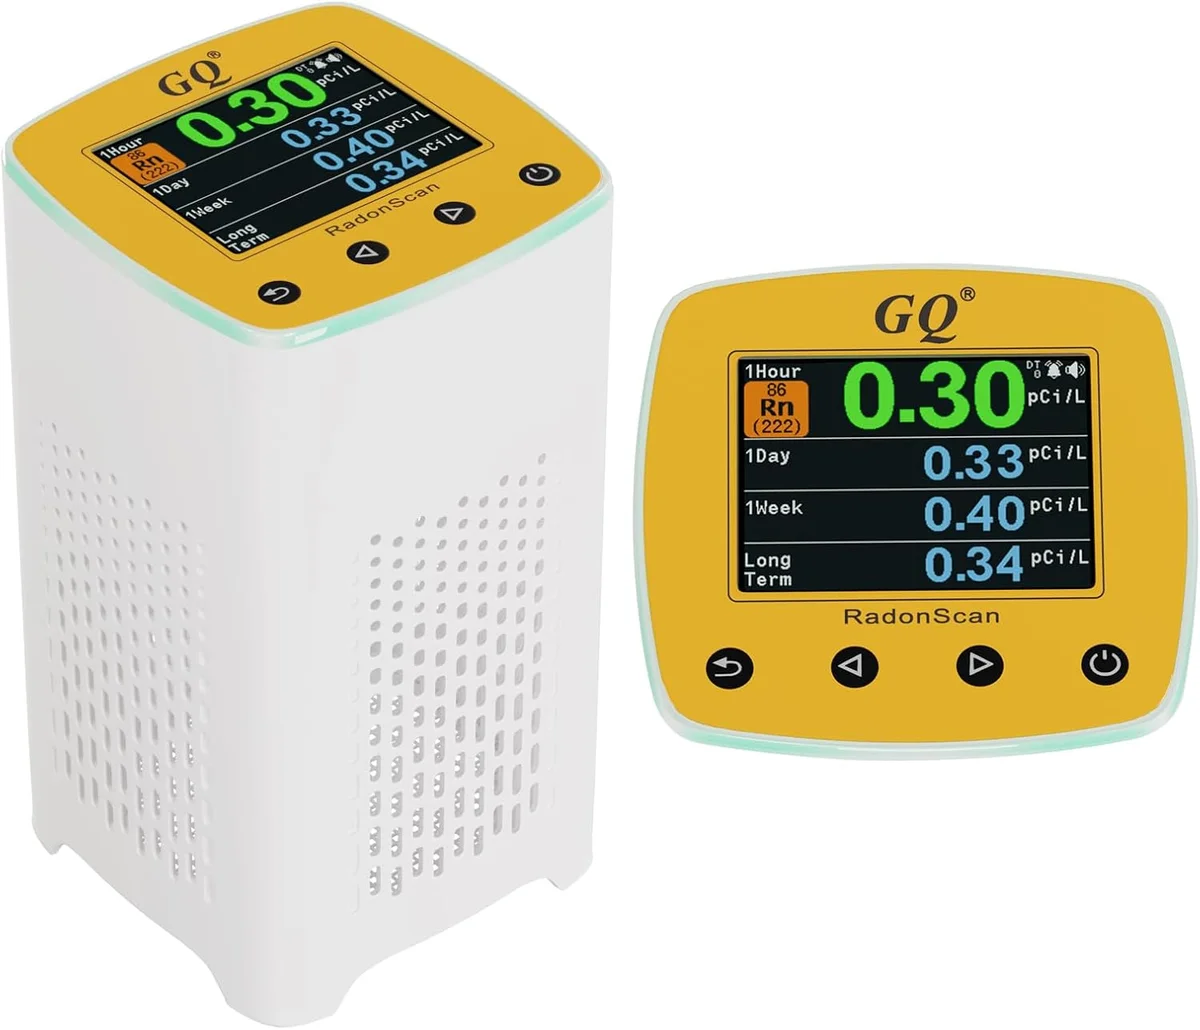
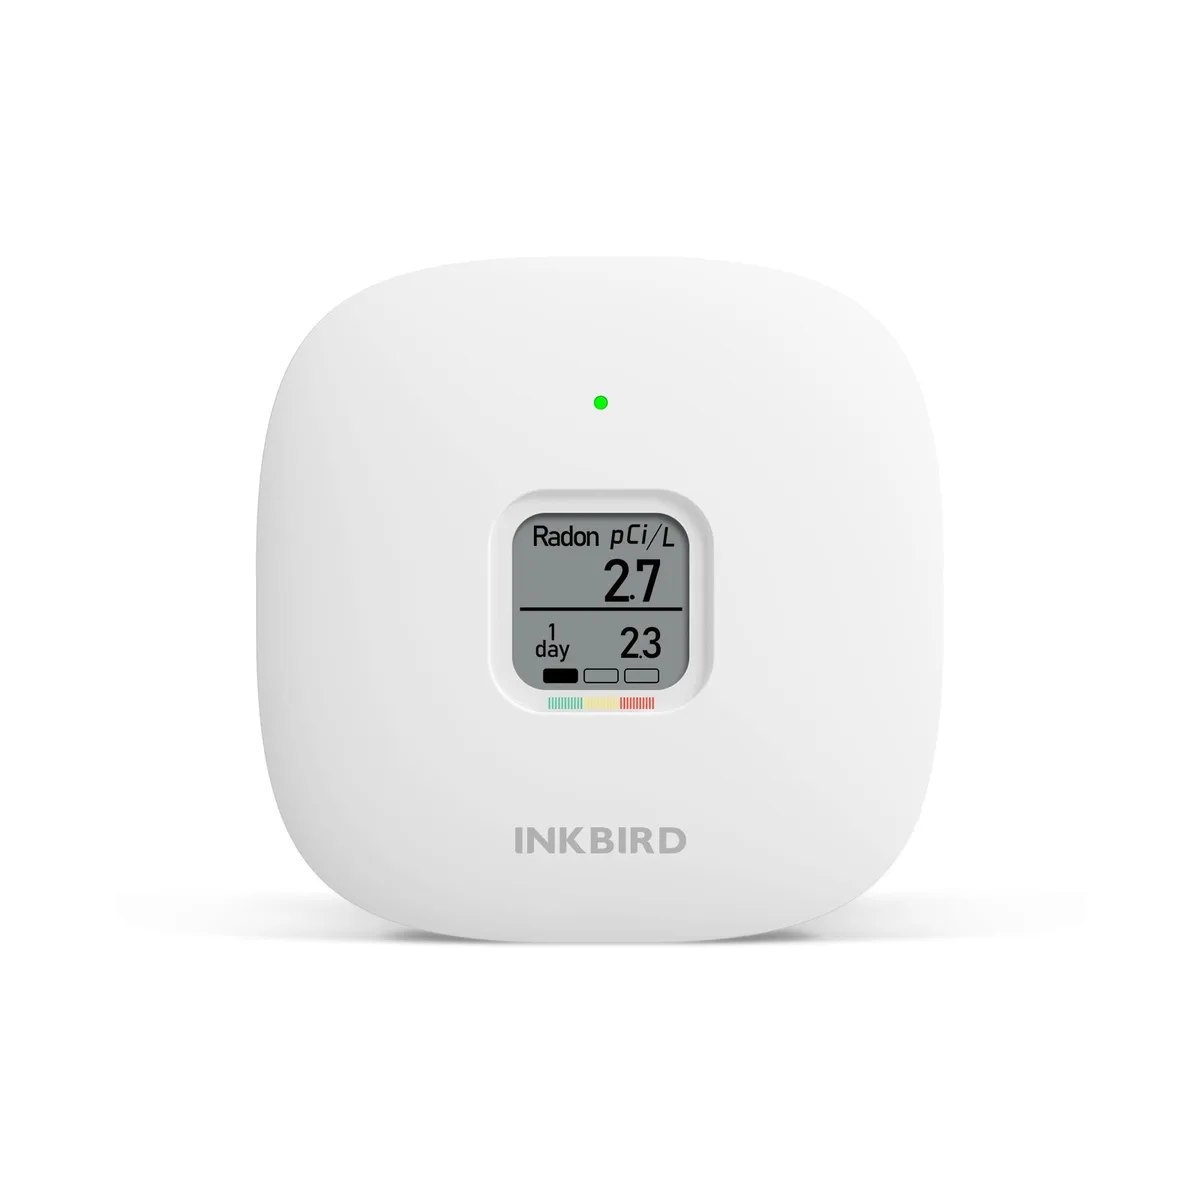
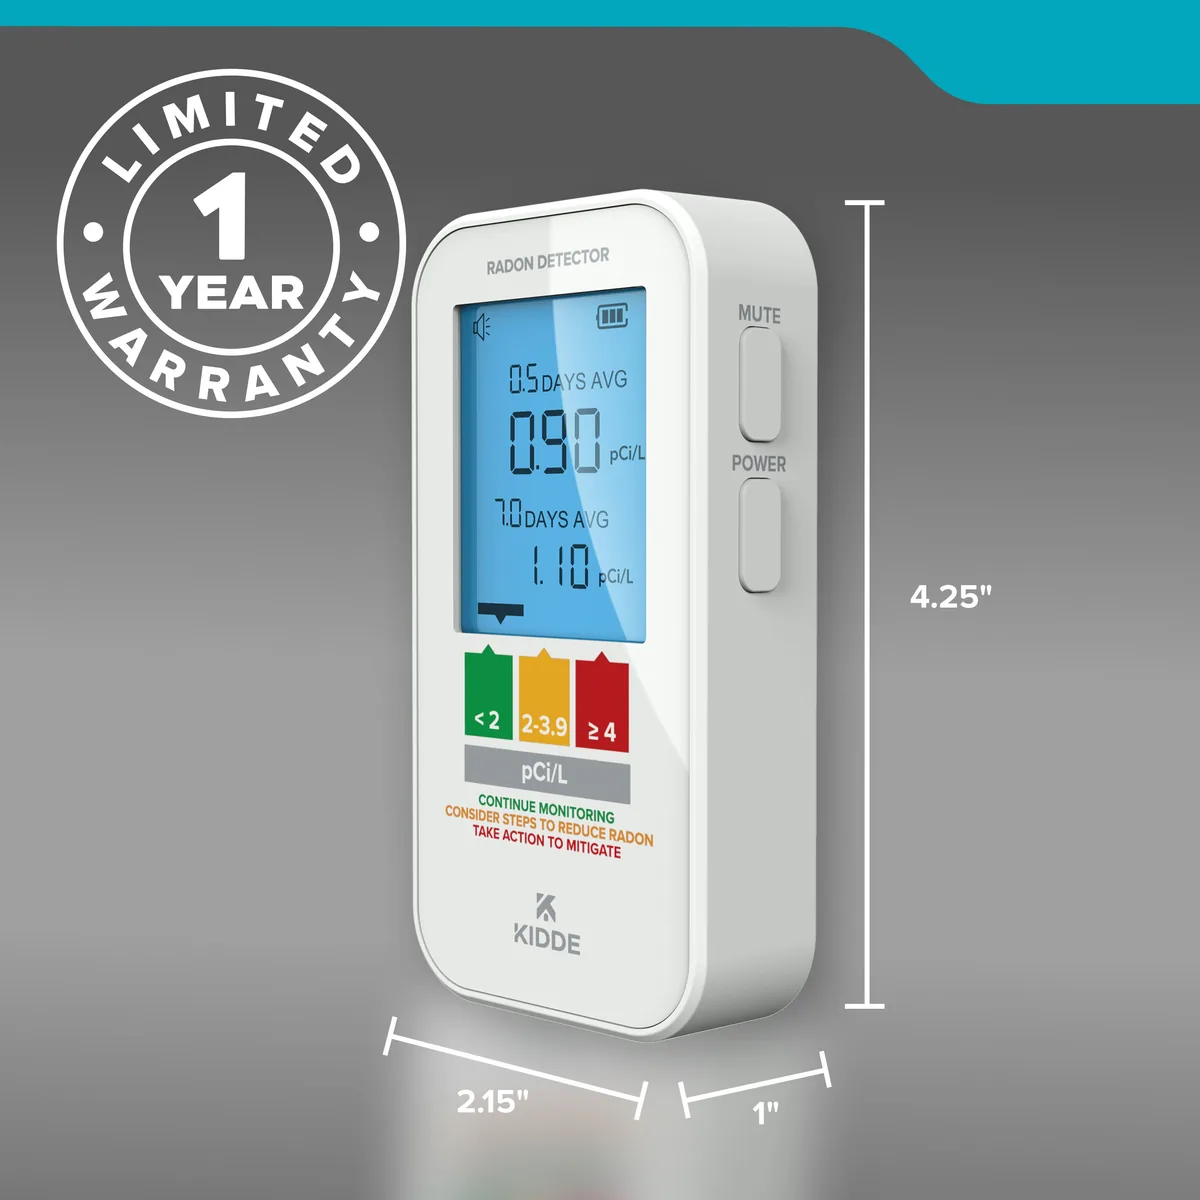
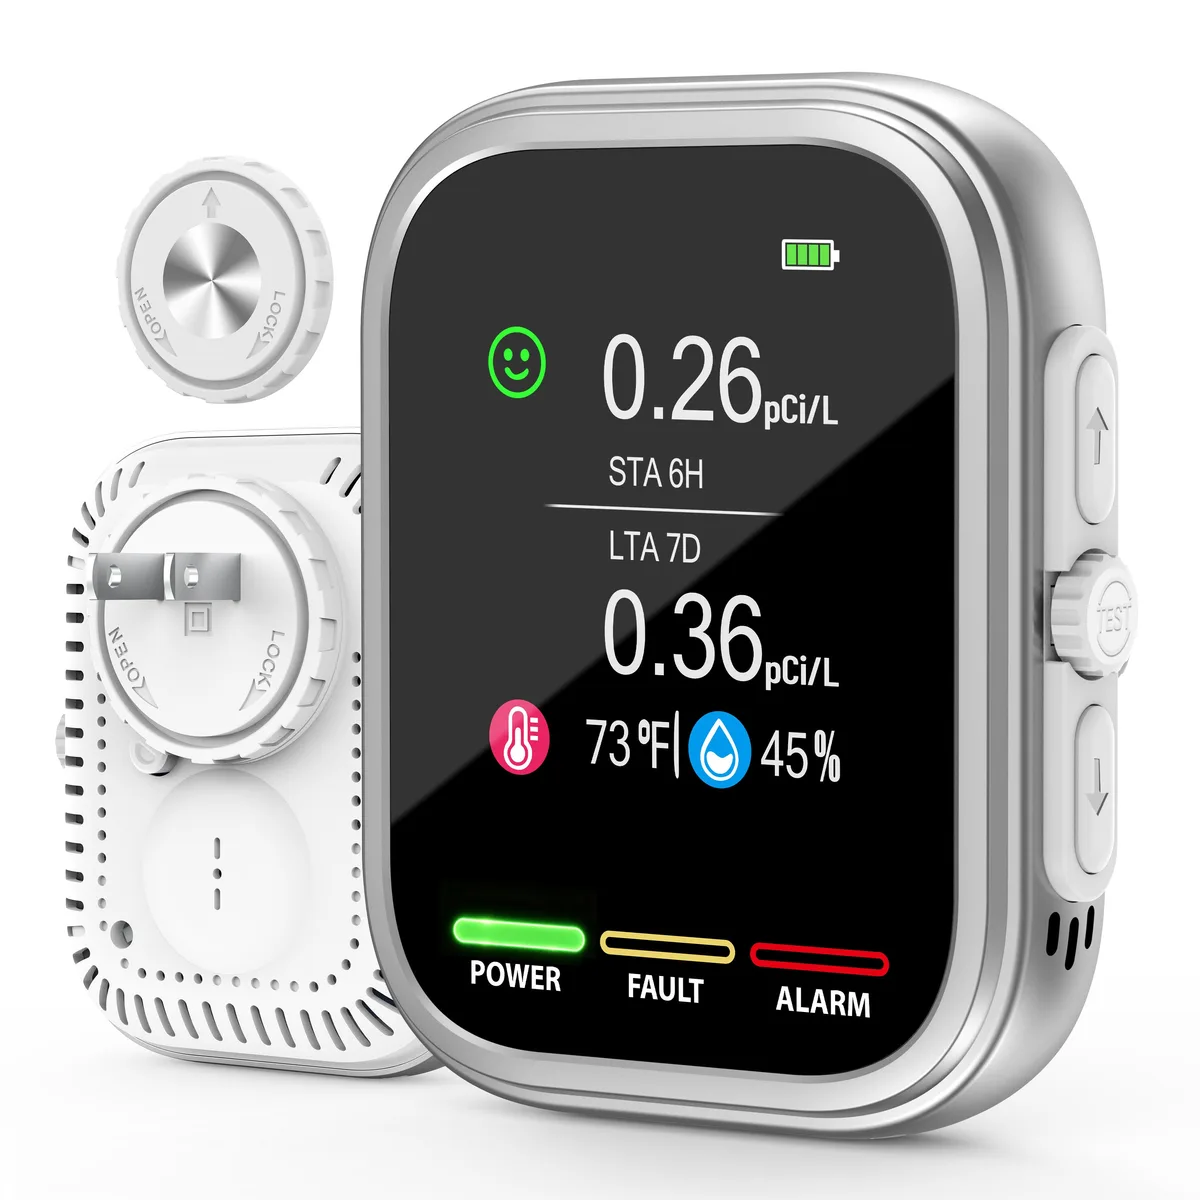
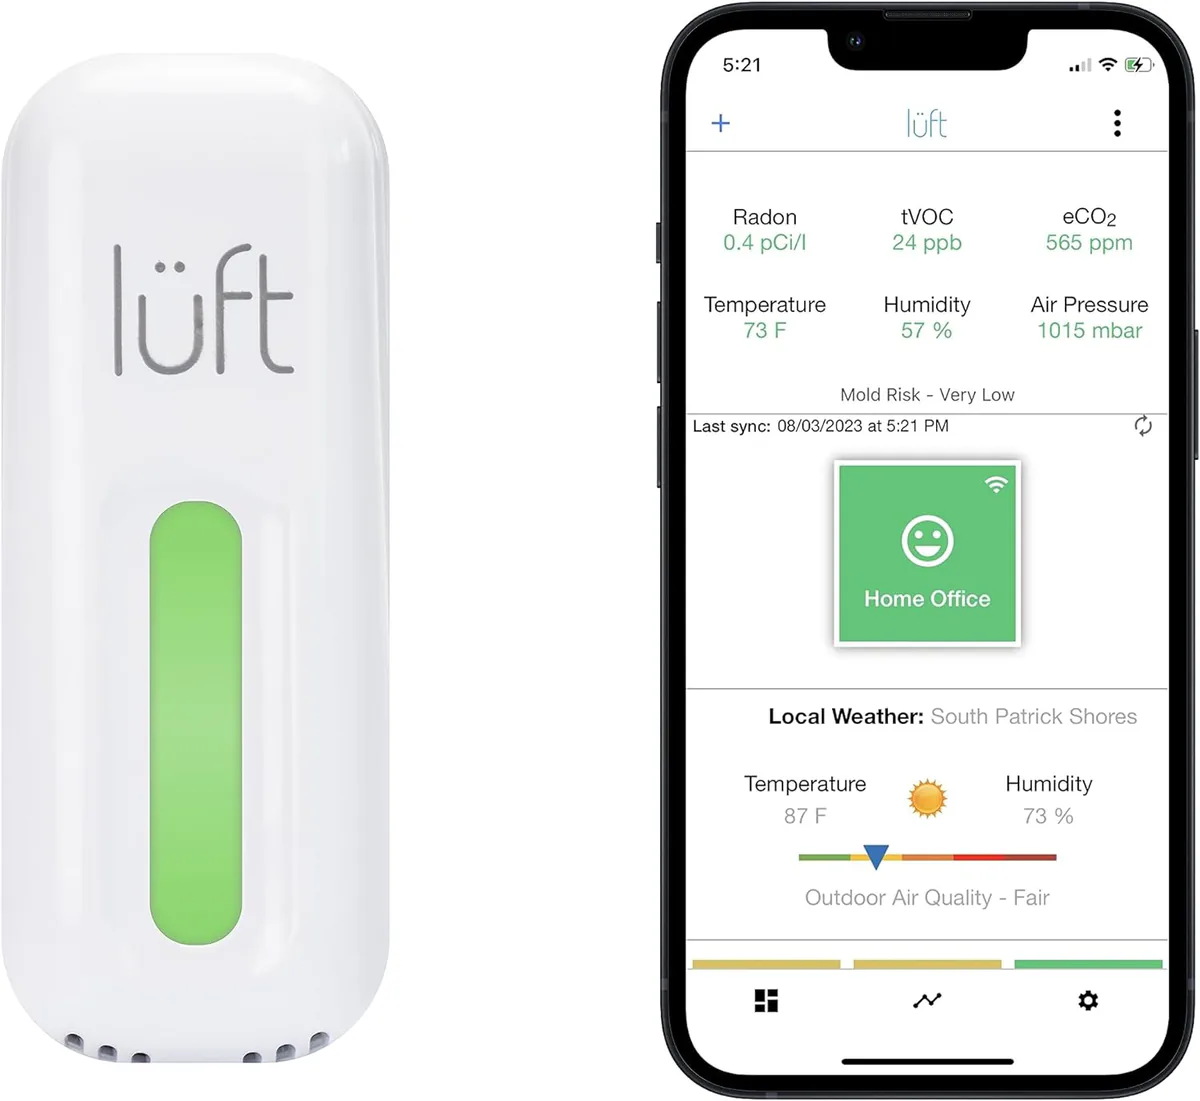
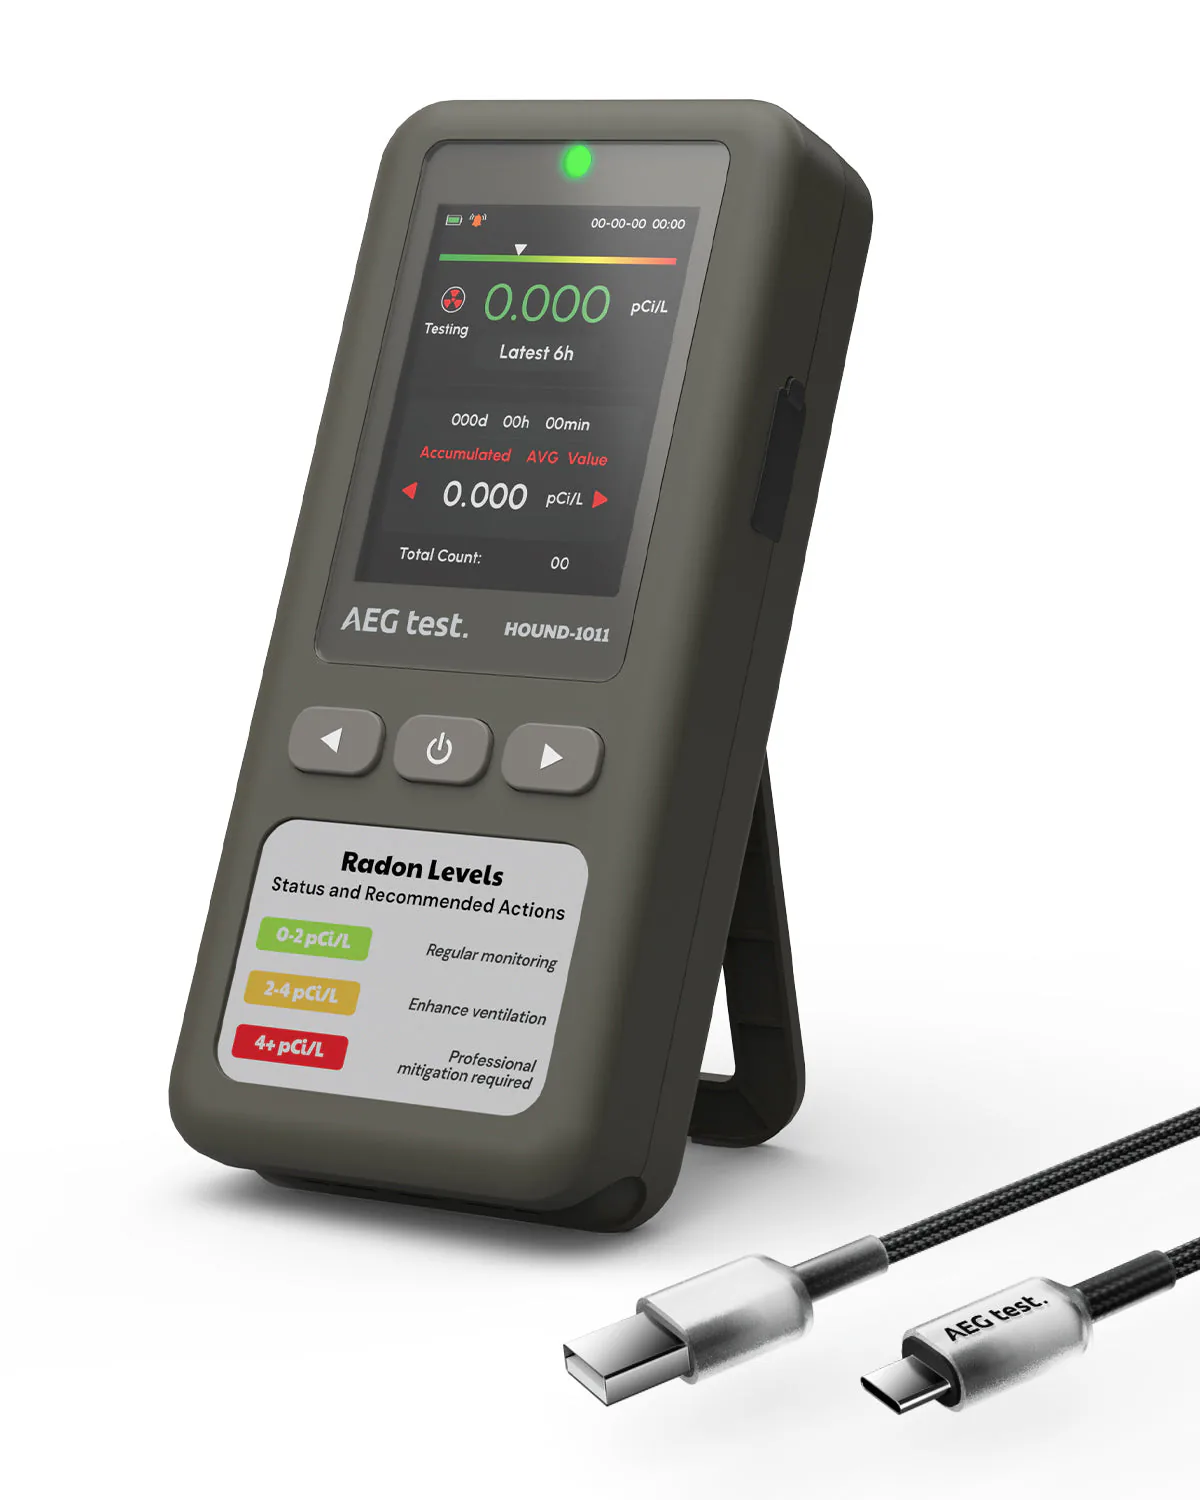
- Digital detectorsConsumer devices that display a running radon reading without a lab.
- Water radon testsKits for radon dissolved in well water, analyzed by a lab.
Mitigation
- Mitigation fansThe inline fan that keeps a soil depressurization system running, sized by the installer.
- System indicatorsU-tube manometers and fan alarms that show whether a mitigation system is still working.
- Sealing materialsCrack, joint and sump sealing used alongside a mitigation system, not instead of one.
Texas / Next steps
What to do next
Learn
Know what radon is
What radon is, how it gets indoors, and why a county zone is not a reading for your home.
Learn about radonTest
Test the building you live in
Short-term or long-term, where the device goes, and closed-house conditions.
How to testFix
Bring a high level down
How a mitigation system works, and the retest that confirms it.
How mitigation worksFind a pro
Hire a certified professional
Measurement and mitigation professionals by state, with their certifications.
Find a professional
Informational. Follow EPA guidance. EPA says all radon tests should be taken for a minimum of 48 hours, with windows and doors closed from 12 hours before a short-term test.