
Long-term kit
RL416 long-term radon test kit, lab fee included
- Lab fee included
Method: Alpha track
In home: 90 days to 12 months
Locations and reports
EPA puts Clayton County in Zone 1, its highest radon zone, and high results are common there: 62.6% of the 310 radon tests reported to CDC (2008 to 2017, laboratory totals) came back at or above 4 pCi/L. Homes with elevated levels occur in all three zones, so only a test measures yours.
Data checked By Radon411Methodology
Share at 4+ pCi/L
62.6%
4.1 pts above IA
310 tests, 2008 to 2017
Median result
5.8pCi/L
Action level reached
Midpoint of the tests, 2008 to 2017
Tests reported
310
71st of 99 by tests
Reported to CDC before any fix, 2008 to 2017
EPA radon zone
Zone 1
Highest potential
1 highest, 3 lowest
EPA predicts over 4 pCi/L indoors
Rank in Iowa
55 of 99
Middle half
By share, of 99 with 30+ tests
Read a result for Clayton County
EPA’s own thresholds; the figures are the area’s, never this home’s.
EPA’s reading of 5.8 pCi/L
At or above 4 pCi/L
This result is at or above 4 pCi/L. EPA recommends fixing a home when the radon level is 4 pCi/L or higher. Clayton County's median reported result, 2008 to 2017.
The data
Clayton County, At a glance
Predicted: EPA radon zone
EPA puts all of Clayton County in
USGS geologic potential: High across 100% of the county's area
Predicted: EPA Map of Radon Zones
Measured: tests reported to CDC
Of 310 pre-mitigation tests reported to CDC, not homes in this area.
| Result band | Tests Measured | Share Measured |
|---|---|---|
| Under 2 pCi/L | 52 | 16.8% |
| 2 to 4 pCi/L | 64 | 20.6% |
| 4 pCi/L and above | 194 | 62.6% |
These are the 310 tests reported to CDC for Clayton County over 2008 to 2017 (laboratory totals), many from homes being sold or already suspected of a problem: they describe the county's reported tests, not this house.
Measured: CDC tracking data. Figure above: 2008 to 2017, laboratory. Measured data period: 2005 to 2017 (every CDC figure on file).
Clayton County, Compared
More than half: 62.6% of the 310 radon tests reported to CDC for Clayton County over the 2008 to 2017 laboratory totals read at least 4 pCi/L. That places it 55th of 99 Iowa counties with 30 or more tests for the same period. That is 4.1 points above the 58.5% pooled from 99 Iowa counties.
The median result, 5.8 pCi/L, sits above EPA's 4 pCi/L action level, and the top reported result was 85.8 pCi/L. The rest split 16.8% under 2 pCi/L and 20.6% from 2 to 4 (Iowa: 21.8% and 19.7%). Zone 1 on EPA's map (predicted average above 4 pCi/L) and a 62.6% share point the same way here.
4 of its 8 bordering counties with figures ran higher, led by Allamakee County at 73.2%; Dubuque County reported 46.8%. Statewide for the same period, Sioux County reported the highest share (84.2%) and Decatur County the lowest (25.9%).
CDC's ten-year totals for Clayton County went from 248 tests (2005 to 2014) to 310 (2008 to 2017), the share going from 64.5% to 62.6%.
Nationally, every county with a figure for the same period pools to 35.7%; Clayton County sits 26.9 points above it. CDC also counts 21 tests taken after mitigation in Clayton County for the same period: tests in homes where a fix was already in.
Pooled shares: Radon411's sum of CDC's county counts for one period.
Clayton County, Geology
USGS's geologic map puts all of Clayton County's mapped land in one class: high radon potential. The map puts 94.2% of Clayton County in the area it calls Paleozoic Plateau and 4.0% in Iowan Surface, with one smaller area beside them. USGS gives the first a radon index of 13 and the second 12, both in the high band (12 to 17).
| Area | The rock, in USGS's words | Potential | Radon index | Share of land |
|---|---|---|---|---|
| Paleozoic Plateau | Ordovician carbonate and Cambrian sandstone bedrock covered by varying amounts of Quaternary glacial deposits and loess. | High | 13 | 94.2% |
| Iowan Surface | Pre-Illinoian glaical deposits and loess. | High | 12 | 4.0% |
| Loess-Covered Drift Plains | Pre-Illinoian and Illinoian glacial deposits, and loess. | High | 13 | 1.6% |
Names, descriptions and indexes: U.S. Geological Survey, Geologic Radon Potential Map (2025). Shares: Radon411, from the map cut to the boundary.
On high-potential ground Clayton County is close to Iowa as a whole: 100% of its land against 98.8%. Of the 8 counties that border it, none has as large a share of high-potential ground; Buchanan County comes nearest at 100%.
The map rates the ground, not the air in any home.
Local help
Clayton County, Local resources
You can reach the Hotline by calling 1-800-383-5992 to order low-cost radon test kits and find answers to your radon questions.
Iowa’s radon program approves applications for persons who wish to become certified to perform radon testing or credentialed to perform mitigation and laboratories that provide radon testing devices and analytical services.
However, per Iowa Code chapters 543B.9 and 543B.18 and Iowa Administrative Code 193E Chapter 14 administered by the Iowa Real Estate Commission, a seller must disclose any known tests for the presence of radon and if yes, provide the date of last report and the result(s).
What it means
Clayton County, Questions
Over the 2008 to 2017 laboratory totals, 62.6% of the radon tests reported to CDC for Clayton County, Iowa were at or above 4 pCi/L, and the median reported pre-mitigation result was 5.8 pCi/L. Of 99 Iowa counties with 30 or more tests for the same period, 54 reported a higher share; pooled, the state comes to 58.5%.
Clayton County borders 8 counties: Delaware County, IA, Fayette County, IA, Grant County, WI, Buchanan County, IA, Allamakee County, IA, Dubuque County, IA, Crawford County, WI and Winneshiek County, IA.
Products
Clayton County, Products
In Clayton County, 62.6% of 310 tests reported to CDC over the 2008 to 2017 laboratory totals reached 4 pCi/L, against 58.5% pooled across Iowa. In Zone 1 the year-round level in Clayton County is the one to know: a long-term test (more than 90 days) or a monitor, with a short-term kit for a first answer.
Long-term kit
Method: Alpha track
In home: 90 days to 12 months
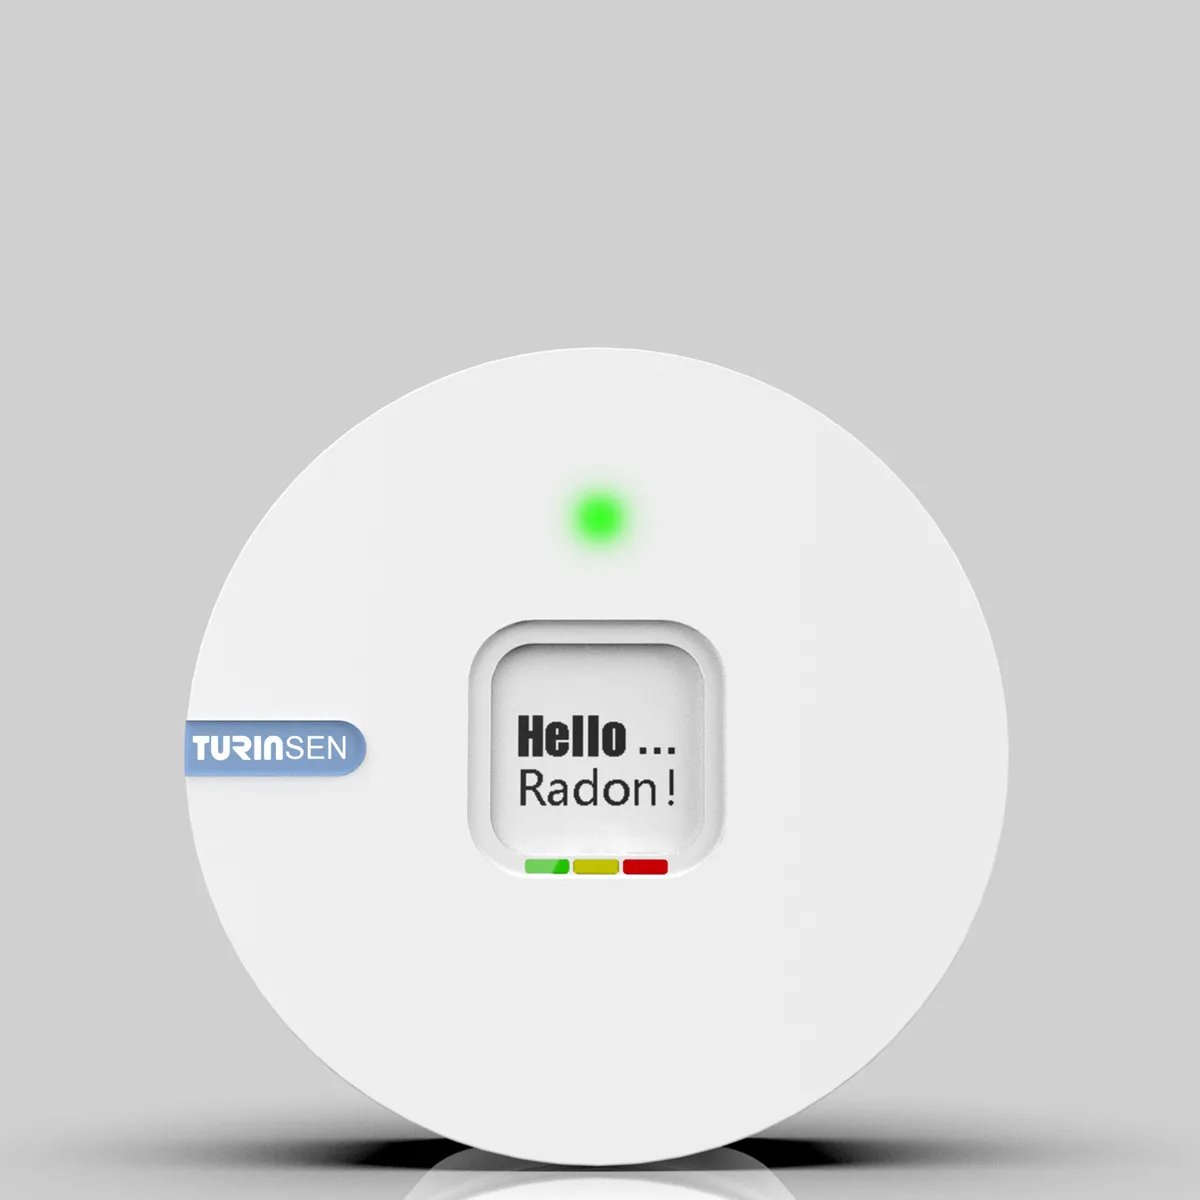
Monitor
Method: Alpha spectrometry
First reading: Within 24 hours
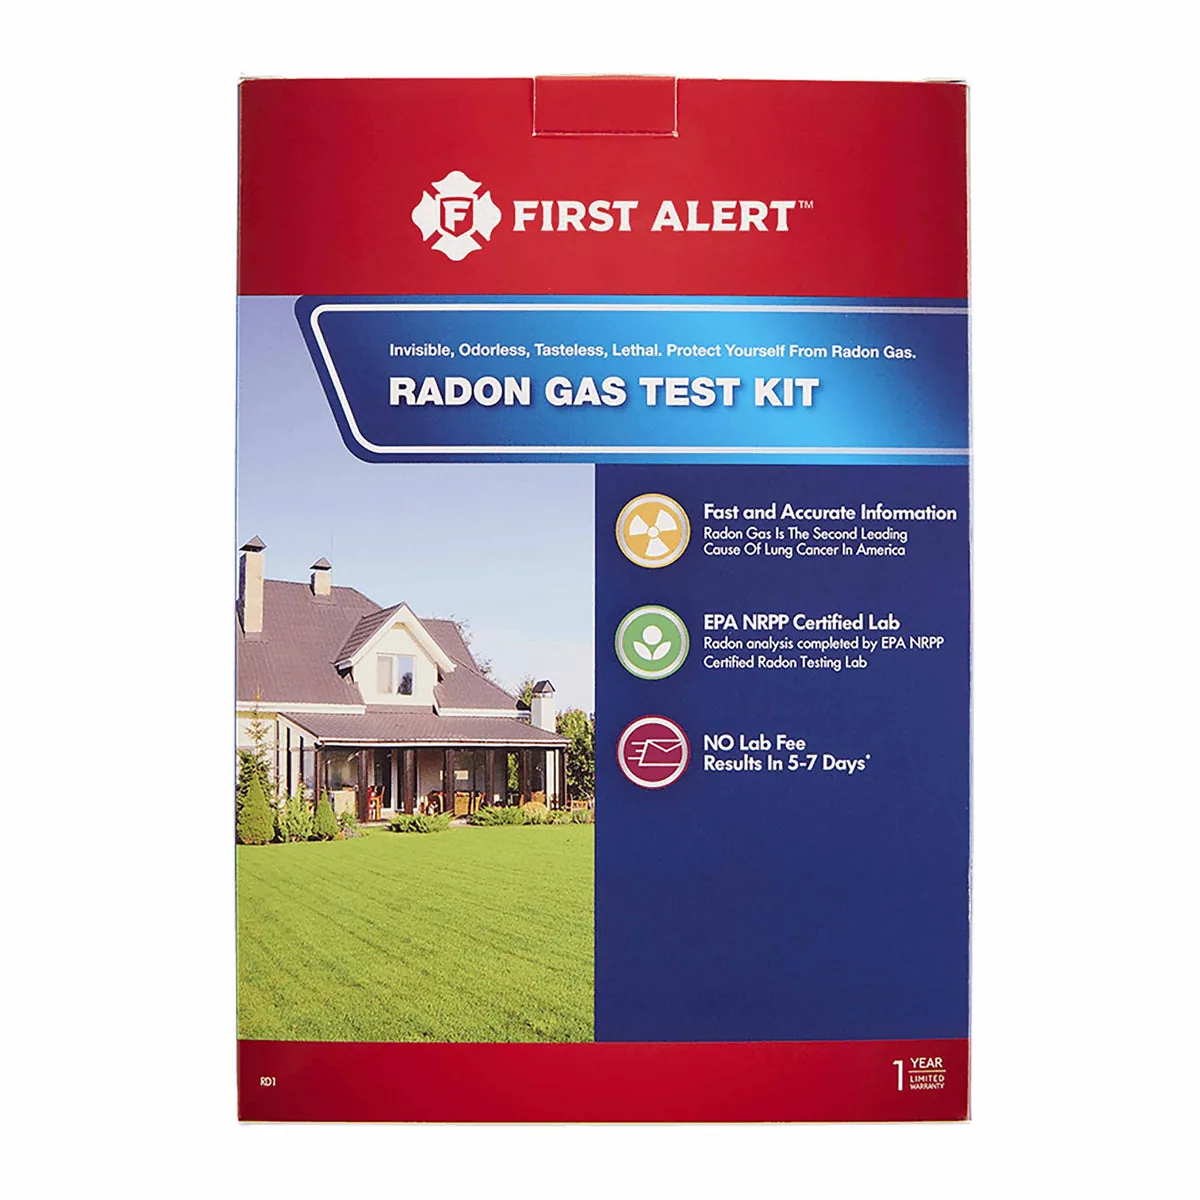
Short-term kitFirst Alert
Method: Charcoal
In home: 2 to 4 days
Test kits and monitors: 1 of 3
Clayton County is in EPA Zone 1, the highest predicted radon potential. Best radon monitors for Zone 1 counties like Clayton County
Explore
Clayton County, Bordering counties
73.2%at or above 4 pCi/L
Median 7.0 pCi/L · 492 tests · 10.6 points above Clayton County
66.4%at or above 4 pCi/L
Median 6.2 pCi/L · 1,071 tests · 3.8 points above Clayton County
64.0%at or above 4 pCi/L
Median 5.5 pCi/L · 636 tests · 1.4 points above Clayton County
62.7%at or above 4 pCi/L
Median 5.6 pCi/L · 746 tests · 0.1 points above Clayton County
59.4%at or above 4 pCi/L
Median 5.1 pCi/L · 160 tests · 3.2 points below Clayton County
51.2%at or above 4 pCi/L
Median 4.1 pCi/L · 564 tests · 11.4 points below Clayton County
50.0%at or above 4 pCi/L
Median 4.0 pCi/L · 520 tests · 12.6 points below Clayton County
46.8%at or above 4 pCi/L
Median 3.6 pCi/L · 3,775 tests · 15.8 points below Clayton County
Clayton County, Cities and towns
About 16,845 people live in Clayton County by the Census Bureau's estimate for July 1, 2025, 182 fewer than in 2020 (−1.1%). That works out to 22 people per square mile of land. Postville, the largest place on its list (2,402 residents in all), extends beyond Clayton County, so no share of the total is worked out for it. Reported testing is thin here: 310 tests over 2008 to 2017, or 18.4 for every 1,000 residents (2025 estimate), where Iowa as a whole comes to 29.4.
From Postville to Elkport, CDC publishes no figure by town: each reads Clayton County's.
| Place | Residents | Since 2020 | Share of residents |
|---|---|---|---|
| Postvilleextends beyond Clayton County | 2,402 | −4.3% | Counted whole |
| Guttenberg | 1,789 | −1.5% | 10.6% |
| Monona | 1,444 | −2.0% | 8.6% |
| Elkader | 1,183 | −2.6% | 7.0% |
| Strawberry Point | 1,126 | −2.4% | 6.7% |
| Edgewoodextends beyond Clayton County | 906 | −0.1% | Counted whole |
| Garnavillo | 739 | −2.0% | 4.4% |
| McGregor | 720 | −2.4% | 4.3% |
| Marquette | 436 | +2.1% | 2.6% |
| Luana | 309 | +3.0% | 1.8% |
| Farmersburg | 263 | −3.3% | 1.6% |
| Volga | 199 | −2.5% | 1.2% |
18 incorporated places, as listed in the U.S. Census Bureau’s 2020 place reference files. “(part)” marks a place that extends into another county. Residents: U.S. Census Bureau population estimates for July 1, 2025 (Vintage 2025). A place that extends beyond Clayton County is counted whole, so it has no share.
Clayton County, Homes
Clayton County is a place of houses on their own lots: 81% of its 8,791 homes are detached single-family houses, against 72% across Iowa. The homes are older than Iowa's as a whole: half were built before 1962 (1971 for Iowa), and 49% date from before 1960. Owners live in 77% of the occupied homes (Iowa: 72%), so for most households a test and a fix are their own to order.
| Homes | Clayton County | Iowa |
|---|---|---|
| Housing units | 8,791 | 1,427,175 |
| Detached houses | 81% | 72% |
| In buildings of 5 or more | 6% | 14% |
| Mobile homes | 4% | 3% |
| Built before 1960 | 49% | 39% |
| Built since 2000 | 16% | 21% |
| Middle year built | 1962 | 1971 |
| Owner-occupied | 77% | 72% |
Census Bureau, American Community Survey, 2019 to 2023: estimates from a sample of homes, looser for a small place. Shares by Radon411.