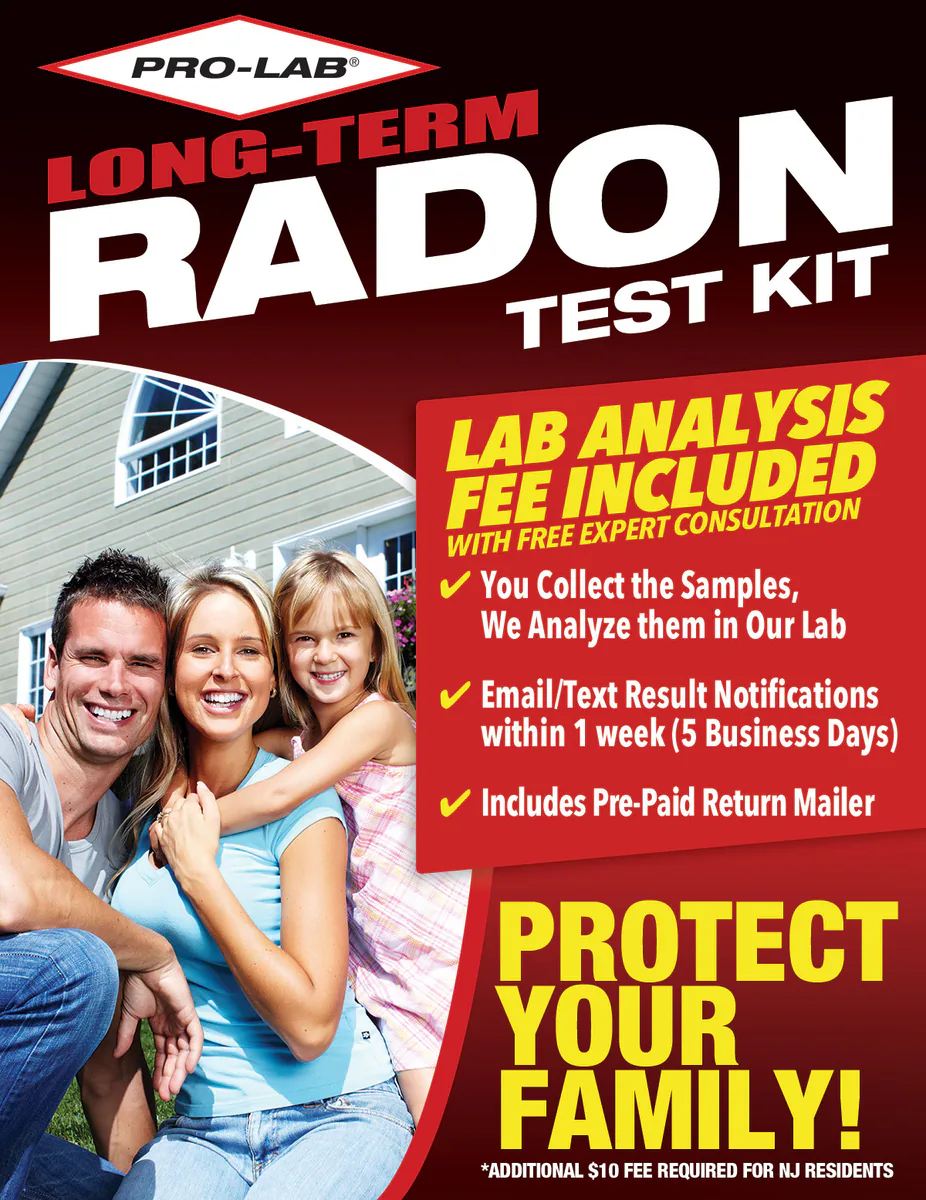
Long-term kit
RL416 long-term radon test kit, lab fee included
- Lab fee included
Method: Alpha track
In home: 90 days to 12 months
Locations and reports
EPA puts Lincoln County in Zone 1, its highest radon zone, and only 9 radon tests from it are on file with CDC (2022). Homes with elevated levels occur in all three zones, so only a test measures yours.
Data checked By Radon411Methodology
Share at 4+ pCi/L
63.6%
31.8 pts above KS
33 tests, 2021
Median result
4.5pCi/L
Action level reached
Midpoint of the tests, 2021
Tests reported
33
59th of 62 by tests
Reported to CDC before any fix, 2021
EPA radon zone
Zone 1
Highest potential
1 highest, 3 lowest
EPA predicts over 4 pCi/L indoors
Rank in Kansas
4 of 62
Top quarter
By share, of 62 with 30+ tests
Read a result for Lincoln County
EPA’s own thresholds; the figures are the area’s, never this home’s.
EPA’s reading of 4.5 pCi/L
At or above 4 pCi/L
This result is at or above 4 pCi/L. EPA recommends fixing a home when the radon level is 4 pCi/L or higher. Lincoln County's median reported result, 2021.
The data
Lincoln County, At a glance
Predicted: EPA radon zone
EPA puts all of Lincoln County in
USGS geologic potential: High across 100% of the county's area
Predicted: EPA Map of Radon Zones
Measured: tests reported to CDC
| Year | Share of reported tests at or above 4 pCi/L |
|---|---|
| 2016 | 33.3% |
| 2017 | 60.0% |
| 2018 | 100.0% |
| 2019 | 20.0% |
| 2020 | 50.0% |
| 2021 | 63.6% |
| 2022 | 22.2% |
2022: 22.2%. Across these years the share ran from 20.0% to 100.0%. Each column counts radon tests reported to CDC that year, not homes.
Only 9 tests were reported to CDC for Lincoln County over 2022, and tests are often run on homes being sold or already suspected of a problem: so few describe neither the county nor this house.
Measured: CDC tracking data. Figure above: 2022. Measured data period: 2016 to 2022 (every CDC figure on file).
Lincoln County, Compared
More than half: 63.6% of the 33 radon tests reported to CDC for Lincoln County in 2021 read at least 4 pCi/L. That places it 4th of 62 Kansas counties with 30 or more tests for the same period. That is 31.8 points above the 31.8% pooled from 96 Kansas counties.
The newest figure, in 2022, counts only 9 tests (22.2% at or above 4 pCi/L), too few to compare, so this reading uses the 33-test figure.
The median result, 4.5 pCi/L, sits above EPA's 4 pCi/L action level, and the top reported result was 14.2 pCi/L. The rest split 9.1% under 2 pCi/L and 27.3% from 2 to 4 (Kansas: 45.3% and 22.9%). Zone 1 on EPA's map (predicted average above 4 pCi/L) and a 63.6% share point the same way here.
No bordering county with a figure for the same period reported a higher share; the closest is Russell County at 56.3%, the lowest Ottawa County at 31.7%. Statewide for the same period, Norton County reported the highest share (93.8%) and Doniphan County the lowest (0.0%).
The busiest year on file was 2021, with 33 tests reported; the quietest, 2016, had 6.
Nationally, every county with a figure for the same period pools to 24.4%; Lincoln County sits 39.2 points above it.
Pooled shares: Radon411's sum of CDC's county counts for one period.
Lincoln County, Geology
USGS's geologic map puts all of Lincoln County's mapped land in one class: high radon potential. All of it lies in the area the map calls Smoky Hills, to which USGS gives a radon index of 12, in the high band (12 to 17).
| Area | The rock, in USGS's words | Potential | Radon index | Share of land |
|---|---|---|---|---|
| Smoky Hills | Cretaceous marine sandstone, shale, and siltstone covered by discontinuous loess deposits. | High | 12 | 100% |
Names, descriptions and indexes: U.S. Geological Survey, Geologic Radon Potential Map (2025). Shares: Radon411, from the map cut to the boundary.
Lincoln County has more high-potential ground than Kansas as a whole: 100% of its land against 59.9%. Of the 6 counties that border it, none has as large a share of high-potential ground; Ellsworth County comes nearest at 100%.
The map rates the ground, not the air in any home.
Local help
Lincoln County, Local resources
What it means
Lincoln County, Questions
In 2022, 22.2% of the radon tests reported to CDC for Lincoln County, Kansas were at or above 4 pCi/L, and the median reported pre-mitigation result was 3.2 pCi/L. Of 62 Kansas counties with 30 or more tests for the same period, 3 reported a higher share; pooled, the state comes to 31.8%.
Lincoln County borders 6 counties: Mitchell County, Ellsworth County, Russell County, Ottawa County, Saline County and Osborne County.
Products
Lincoln County, Products
In Lincoln County, 63.6% of 33 tests reported to CDC in 2021 reached 4 pCi/L, against 31.8% pooled across Kansas. In Zone 1 the year-round level in Lincoln County is the one to know: a long-term test (more than 90 days) or a monitor, with a short-term kit for a first answer.
Long-term kit
Method: Alpha track
In home: 90 days to 12 months
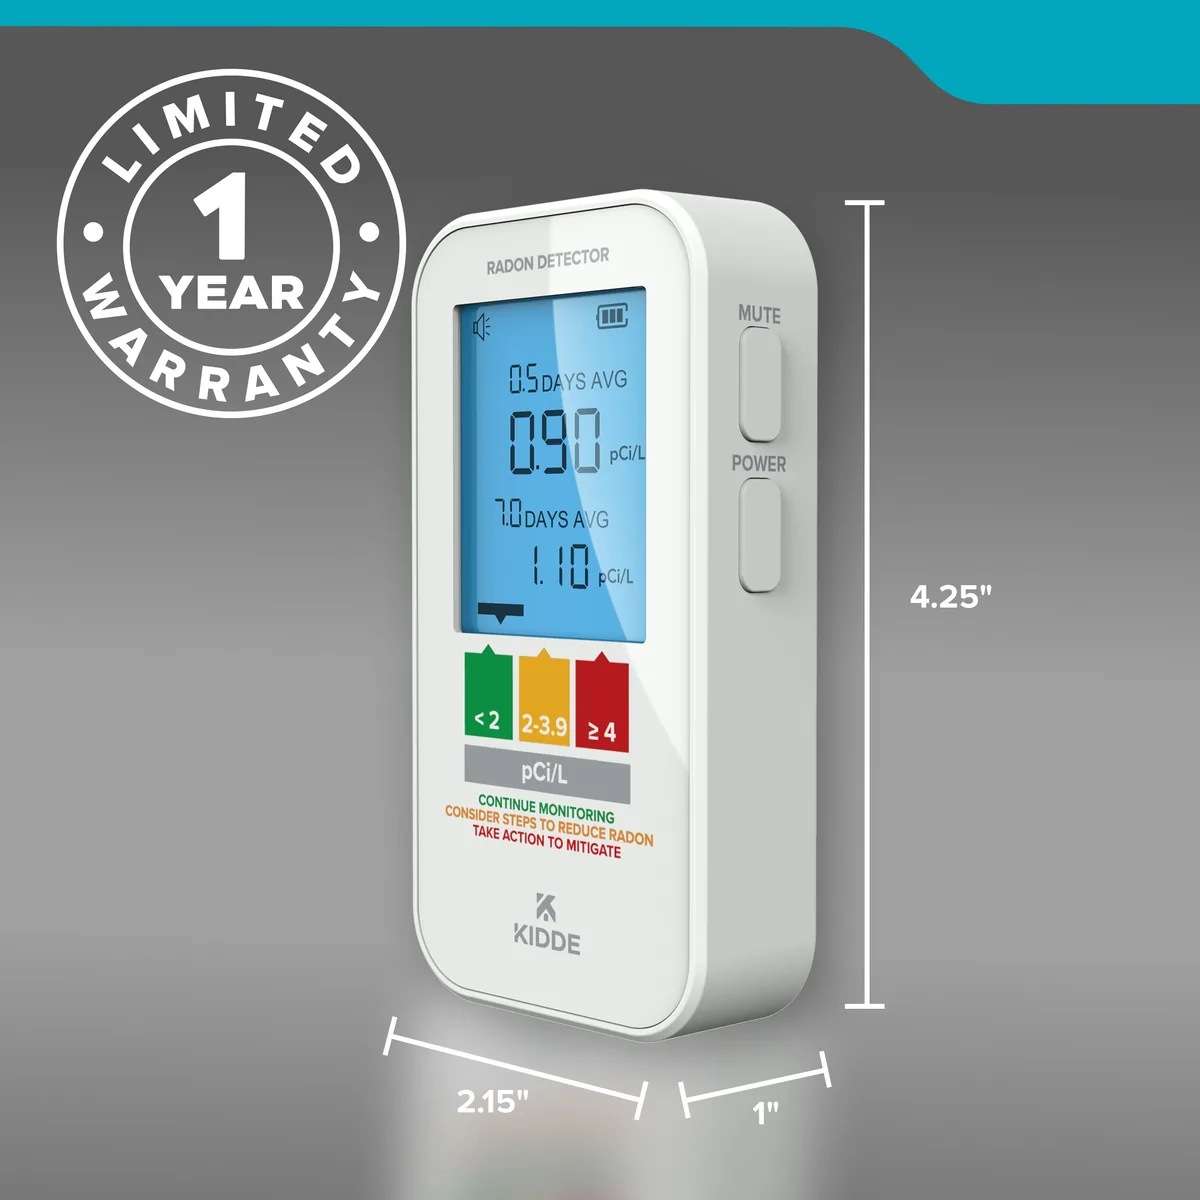
MonitorKidde
Method: Semiconductor sensor
First reading: Within 12 hours
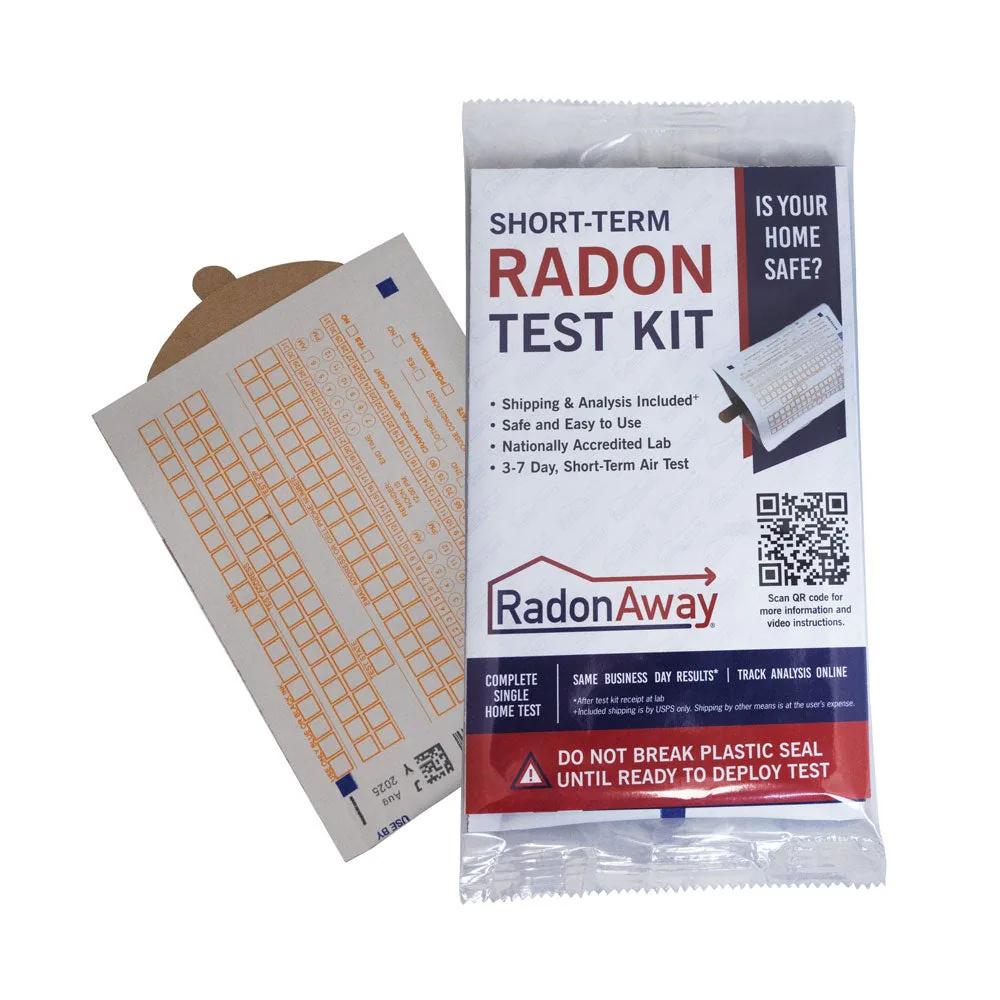
Short-term kit
In home: 72 to 168 hours
Test kits and monitors: 1 of 3
Lincoln County is in EPA Zone 1, the highest predicted radon potential. Best radon monitors for Zone 1 counties like Lincoln County
Explore
Lincoln County, Bordering counties
56.3%at or above 4 pCi/L
Median 4.8 pCi/L · 48 tests · 7.3 points below Lincoln County
55.9%at or above 4 pCi/L
Median 4.8 pCi/L · 177 tests · 7.7 points below Lincoln County
37.0%at or above 4 pCi/L
Median 2.8 pCi/L · 1,920 tests · 26.6 points below Lincoln County
35.2%at or above 4 pCi/L
Median 2.9 pCi/L · 162 tests · 28.4 points below Lincoln County
31.7%at or above 4 pCi/L
Median 2.6 pCi/L · 180 tests · 31.9 points below Lincoln County
14.3%at or above 4 pCi/L
Median 1.2 pCi/L · 21 tests · 49.3 points below Lincoln County
Lincoln County, Cities and towns
About 2,861 people live in Lincoln County by the Census Bureau's estimate for July 1, 2025, 89 fewer than in 2020 (−3.0%). Spread over its land, that is 4.0 people to the square mile. Its largest town, Lincoln Center, has 1,136 residents, 39.7% of the total. Together its 4 incorporated places hold 56.2% of those residents; the other 43.8% live outside any of them. Reported testing is thin here: 33 tests over 2021, or 11.5 for every 1,000 residents (2025 estimate), where Kansas as a whole comes to 23.5.
From Lincoln Center to Barnard, CDC publishes no figure by town: each reads Lincoln County's.
| Place | Residents | Since 2020 | Share of residents |
|---|---|---|---|
| Lincoln Center | 1,136 | −2.9% | 39.7% |
| Sylvan Grove | 281 | −3.1% | 9.8% |
| Beverly | 134 | −2.9% | 4.7% |
| Barnard | 57 | −3.4% | 2.0% |
4 incorporated places, as listed in the U.S. Census Bureau’s 2020 place reference files. Residents: U.S. Census Bureau population estimates for July 1, 2025 (Vintage 2025).
Lincoln County, Homes
Lincoln County is a place of houses on their own lots: 88% of its 1,667 homes are detached single-family houses, against 72% across Kansas. More than half of its homes were built before 1940, where the middle year for Kansas is 1975; 5% have gone up since 2000. Owners live in 79% of the occupied homes (Kansas: 67%), so for most households a test and a fix are their own to order.
| Homes | Lincoln County | Kansas |
|---|---|---|
| Housing units | 1,667 | 1,285,221 |
| Detached houses | 88% | 72% |
| In buildings of 5 or more | 5% | 13% |
| Mobile homes | 4% | 4% |
| Built before 1960 | 68% | 33% |
| Built since 2000 | 5% | 20% |
| Middle year built | 1939 or earlier | 1975 |
| Owner-occupied | 79% | 67% |
Census Bureau, American Community Survey, 2019 to 2023: estimates from a sample of homes, looser for a small place. Shares by Radon411.